
Pulmonary embolism in ecg
pulmonary embolism ECG electrocardiogram S1Q3T3 right heart strain
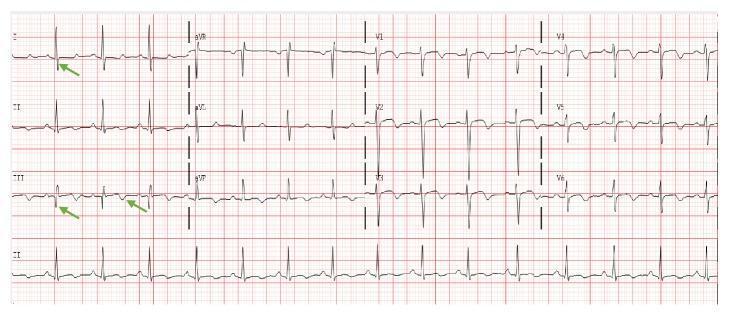
This diagnostic image is a 12-lead electrocardiogram (ECG) displayed on standard pink grid paper. The tracing shows a normal sinus rhythm with a heart rate of approximately 95 beats per minute. The primary educational focus is the classic S1Q3T3 sign, a sign of acute right ventricular strain often associated with pulmonary embolism. Key visual findings marked with green arrows include a deep S wave in Lead I, a prominent Q wave in Lead III, and an inverted T wave in Lead III. The QRS complex morphology is otherwise narrow with a normal axis. The chest leads (V1-V6) show normal R-wave progression. This visual material is used in medical education to teach the recognition of ECG manifestations of pulmonary hypertension and acute right-sided heart strain. Target audience includes medical students, residents, and emergency medicine practitioners.
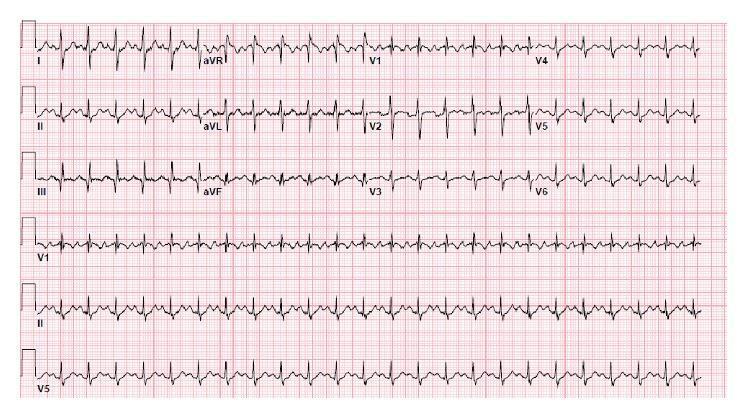
This diagnostic image is a 12-lead electrocardiogram (ECG) recorded at standard speed and voltage. The tracing demonstrates sinus tachycardia, characterized by a rapid heart rate with present P waves preceding each QRS complex. The most clinically significant finding is the 'S1Q3T3' pattern, a classic sign of right ventricular strain. This is visually evidenced by a prominent, deep S wave in Lead I, a discernible Q wave in Lead III, and an inverted T wave in Lead III. Additionally, the precordial leads (V1-V6) show T-wave inversions and ST-segment changes, further supporting a right heart pressure overload morphology. This specific combination of findings is strongly associated with acute pulmonary embolism and right heart strain in the appropriate clinical context. The ECG includes a long rhythm strip at the bottom (Leads V1, II, and V5) to facilitate rate and rhythm analysis.
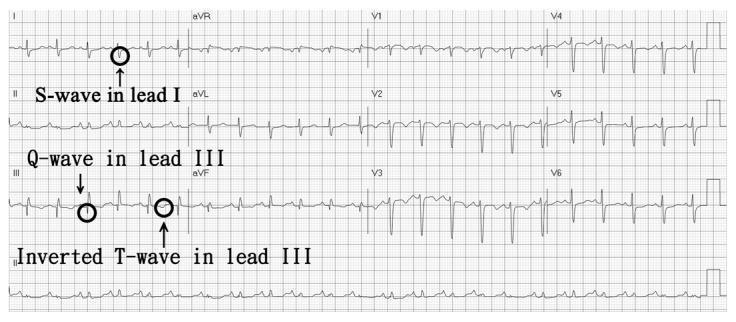
This diagnostic image is a 12-lead electrocardiogram (ECG) tracing demonstrating a classic S1Q3T3 pattern, a clinical sign of acute right heart strain often associated with pulmonary embolism. The ECG is annotated with black circles and arrows highlighting three primary visual features: a prominent S-wave in lead I (terminal negative deflection of the QRS), a pathological Q-wave in lead III (initial negative deflection), and an inverted T-wave in lead III. The tracing also shows sinus tachycardia, evidenced by a regular rhythm with a heart rate exceeding 100 beats per minute. The QRS complexes are generally narrow and upright in the precordial leads (V1-V6). This illustration is designed for medical students and clinicians to identify specific morphological ECG abnormalities that reflect the pathophysiological stress of the right ventricle against increased pulmonary vascular resistance.
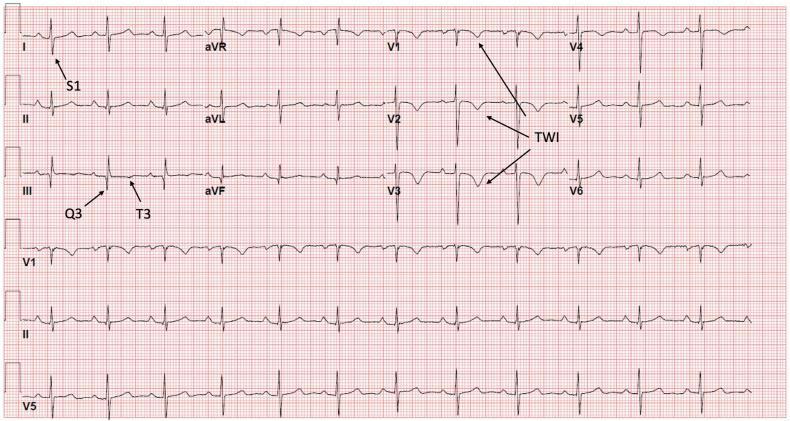
Diagnostic Image: A 12-lead electrocardiogram (ECG) displayed on a standard red grid, demonstrating classic features associated with acute right ventricular (RV) strain. The tracing shows a sinus rhythm with several key diagnostic findings. In the limb leads, an S1Q3T3 pattern is visible, marked with labels: a deep S-wave in lead I (S1), a pathological Q-wave in lead III (Q3), and an inverted T-wave in lead III (T3). In the precordial leads, there are prominent, deep, symmetric T-wave inversions (TWI) extending from V1 through V6, which are also highlighted with arrows. These visual markers collectively illustrate the McGinn-White sign, often associated with acute pulmonary embolism. The ECG serves as an educational tool for recognizing the cardiovascular manifestations of increased right-sided heart pressure and strain.
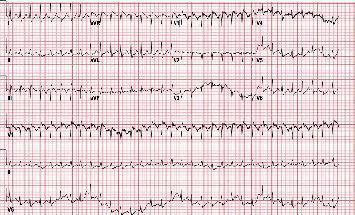
This diagnostic image is a 12-lead electrocardiogram (ECG) demonstrating a rapid, regular rhythm with narrow QRS complexes, consistent with supraventricular tachycardia (SVT). A hallmark feature of acute right heart strain is visible via the S1Q3T3 pattern: lead I shows a prominent S-wave, lead III displays a significant Q-wave, and there is T-wave inversion also in lead III. The tracing exhibits tachycardia with a rate exceeding 100 beats per minute. These findings are clinically significant for diagnosing pulmonary embolism or other causes of acute pulmonary hypertension in an emergency or critical care setting. The ECG is presented on standard pink grid paper, showing limb leads (I, II, III, aVR, aVL, aVF) and precordial leads (V1-V6) alongside a rhythm strip.
ECG Findings in Pulmonary Embolism (PE)
Classic ECG Findings
1. Sinus Tachycardia
- The most common finding (heart rate >100 bpm)
- Reflects hypoxia, anxiety, and reduced cardiac output
- Scores 2 points on the PE-ECG severity score
2. S1Q3T3 Pattern (McGinn-White Sign)
- S wave in Lead I + Q wave in Lead III + T-wave inversion in Lead III
- Represents acute RV strain and right axis deviation
- Relatively specific but insensitive (seen in ~20% of cases)
- The finding that's classically tested but actually present in a minority of patients
3. T-Wave Inversions in Precordial Leads (V1-V4)
- The most common abnormality after sinus tachycardia
- Caused by RV strain and ischemia
- T-wave inversions extending from V1 through V4 (or even V1-V6 in severe cases) indicate right heart pressure overload
- More commonly seen than S1Q3T3
4. Right Bundle Branch Block (RBBB)
- Incomplete RBBB is more common than complete RBBB
- Reflects RV conduction delay from acute right heart strain
- Incomplete RBBB scores 2 points; complete RBBB scores 3 points
5. Right Axis Deviation
- Axis shifts rightward due to RV overload
- May be associated with S waves in leads I and aVL
6. P Pulmonale
- Tall, peaked P waves in lead II (>2.5 mm)
- Reflects right atrial enlargement/overload
7. ST-Segment Changes
- ST depression or elevation can occur, usually nonspecific
- ST elevation in V1, aVR may be seen in severe RV strain
8. Atrial Arrhythmias
- Atrial fibrillation, atrial flutter, or other SVTs can be triggered
- Result from right atrial stretch
ECG Severity Scoring (Tintinalli's Table 56-3)
| Finding | Score |
|---|---|
| Tachycardia (>100 bpm) | 2 |
| Incomplete RBBB | 2 |
| Complete RBBB | 3 |
| T-wave inversion V1-V4 | 4 |
| T-wave inversion V1 (<1 mm / 1-2 mm / >2 mm) | 0 / 1 / 2 |
| T-wave inversion V2 (<1 mm / 1-2 mm / >2 mm) | 1 / 2 / 3 |
| T-wave inversion V3 (<1 mm / 1-2 mm / >2 mm) | 1 / 2 / 3 |
| S wave in Lead I | 0 |
| Q wave in Lead III | 1 |
| Inverted T in Lead III | 1 |
| Complete S1Q3T3 pattern (add) | 2 |
| Maximum total | 21 |
- Tintinalli's Emergency Medicine, 9th ed., Table 56-3
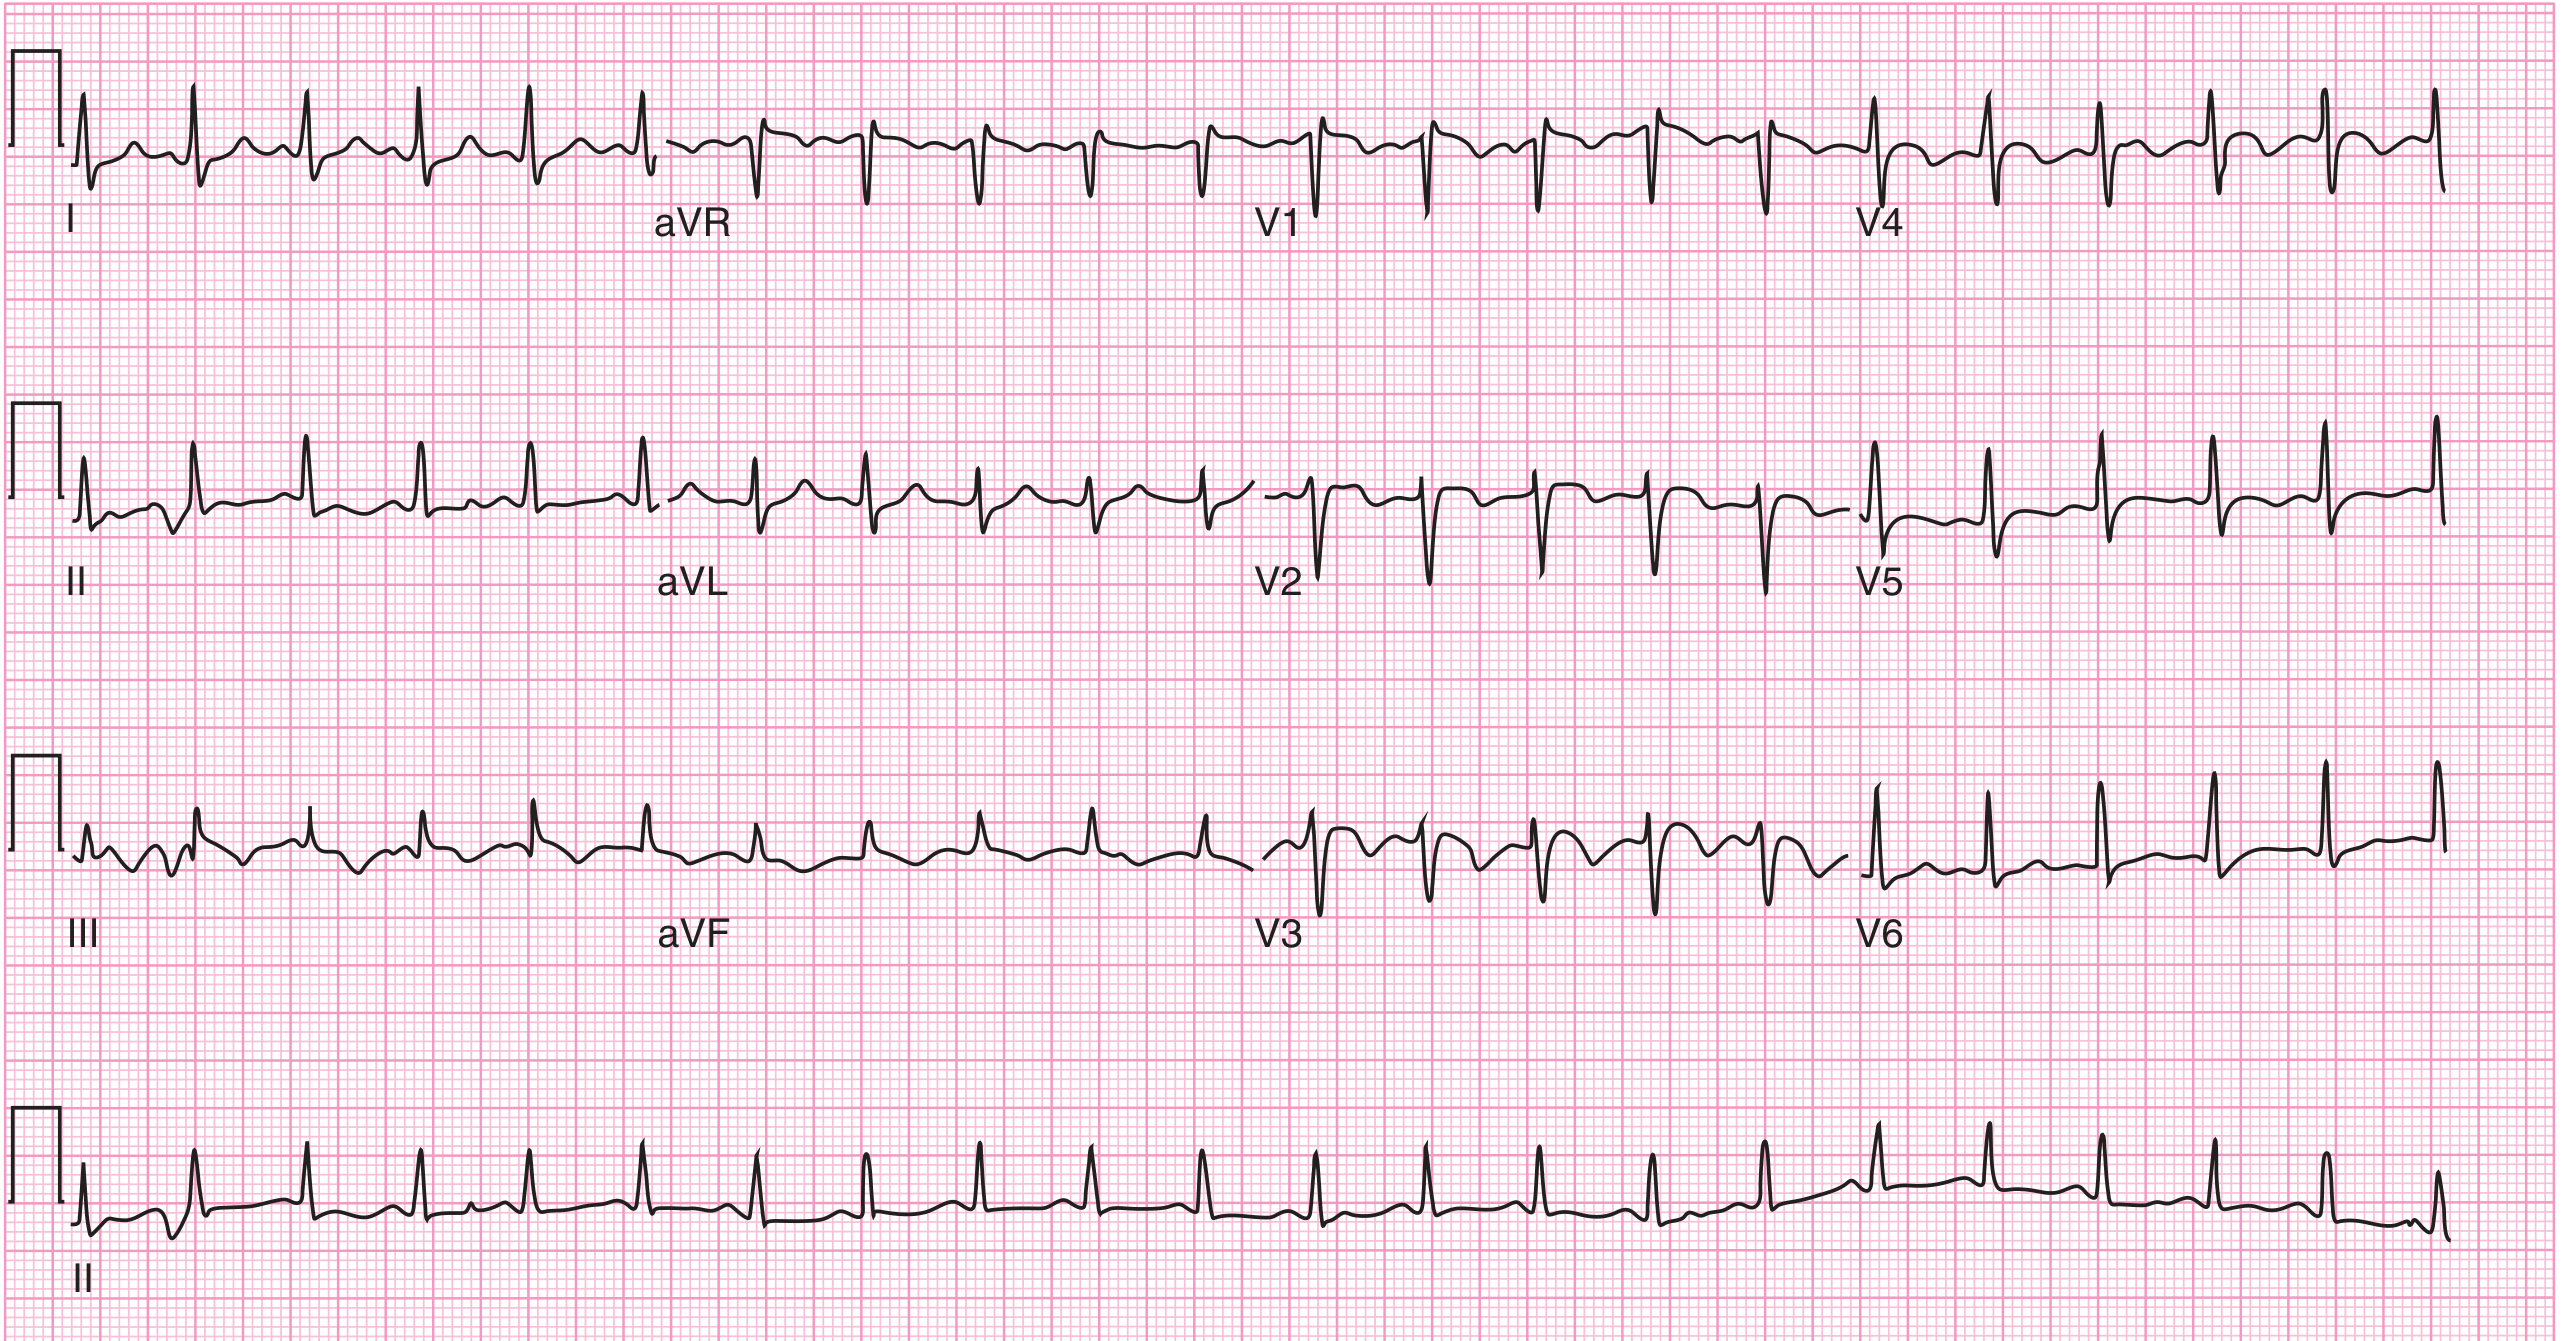
ECG from Harrison's: Classic Large PE
Annotated S1Q3T3 ECG Examples
Key Points to Remember
| Feature | Detail |
|---|---|
| Most common ECG finding | Sinus tachycardia |
| Most specific sign | S1Q3T3 (but low sensitivity ~20%) |
| Most common abnormality (after tachycardia) | T-wave inversions V1-V4 |
| ECG is | Non-specific; cannot diagnose or exclude PE alone |
| Computer interpretation | Often MISSES PE-specific findings |
| Severity | ECG changes are more prominent in massive/submassive PE |