
You are an expert HKMLE tutor helping me ACE the Hong Kong Medical Licensing Examination (Papers 1, 2, and 3). Create a high-yield, comprehensive study note for Module 1D: Valvular + Pericardial + Cardiomyopathies + Infective Endocarditis that covers BOTH: - Part 1: Knowledge Content (Papers 1 & 2) - Part 2: OSCE Script (Paper 3) You are FULLY AUTHORISED to add any sections, mnemonics, tables, diagrams, clinical pearls, trap warnings, red flags, drug interactions, trial data, comparisons, flowcharts, quick summaries, or anything else you think will help me ACE this exam. --- DIAGRAM REQUIREMENTS --- If you can generate actual images/diagrams, include them. If not, use clear written descriptions instead of text-based ASCII diagrams. ═══════════════════════════════════════════════════════════════ PART 1: KNOWLEDGE NOTE (Papers 1 & 2) ═══════════════════════════════════════════════════════════════ --- REQUIREMENTS --- For each major condition, include: ● Definition ● Classification (with table where helpful) ● Aetiology / Causes (with a BOLD mnemonic) ● Pathophysiology (step-by-step) ● Risk factors (with mnemonic) ● Symptoms (with mnemonic) ● Signs (with mnemonic) ● Investigations (with mnemonic). Provide a prioritised diagnostic algorithm (Bedside → Labs → Imaging). ● Management (acute and chronic, with mnemonics for treatment steps). Differentiate standard international guidelines from local Hong Kong Hospital Authority (HA) protocols and Centre for Health Protection (CHP) recommendations. Break down emergency steps into explicit verbal orders. ● Complications (with mnemonic where possible) ● Prognosis (with mnemonic where possible) --- ADD THESE ELEMENTS THROUGHOUT PART 1 --- ● ⚠ HKMLE TRAP boxes (Highlight where standard US/UK textbook answers will cause me to lose marks) ● 🏢 HA CLINICAL PATHWAY boxes (Specify default drug formulations, staging systems, or referral pathways used in HK public hospitals) ● 📋 CHP STATUTORY NOTIFICATION boxes (Explicitly flag if the condition is a statutory notifiable infectious disease in HK) ● 🌏 LOCAL EPIDEMIOLOGY VARIANT boxes (Highlight high-prevalence local variations) ● 📋 INVESTIGATION INTERPRETATION boxes (Provide a classic raw data result example and its 1-sentence interpretation) ● ⚖ LEGAL & ETHICAL ORDINANCE boxes (Flag relevant local legislation) ● 📌 QUICK SUMMARY boxes ● 🚨 RED FLAGS box ● ❓ COMMON EXAM QUESTION box ● 🔬 BASIC SCIENCE INTEGRATION box --- REQUIRED TABLES AT END OF PART 1 --- ● ⚠ DRUG TRAPS table ● 📊 NOTABLE TRIALS table ● 🧠 MASTER MNEMONICS table ● 🔗 CROSS-MODULE LINKS ═══════════════════════════════════════════════════════════════ PART 2: OSCE SCRIPT (Paper 3) ═══════════════════════════════════════════════════════════════ --- FORMAT REQUIREMENTS --- Structure the OSCE script as a complete station walkthrough with EXACT TIMING for each section: 1. ═══════════ STATION INTRODUCTION ═══════════ ● Station title and time allocation (typically 8-10 minutes) ● Patient presentation summary (what the examiner tells you) ● Immediate first actions 2. ═══════════ OPENING SCRIPT ═══════════ ● EXACT WORDS to say to the patient (verbatim) ● How to introduce yourself ● How to explain the examination ● How to obtain verbal consent 3. ═══════════ SYSTEMATIC EXAMINATION SEQUENCE ═══════════ ● Step-by-step examination in the CORRECT ORDER ● Patient positioning for each step ● EXACT WORDS to say while examining ● What findings to state out loud to the examiner ● "I would also..." statements (shows broader knowledge) ● Time allocation for each step 4. ═══════════ KEY FINDINGS SUMMARY ═══════════ ● What you MUST identify ● How to verbally present findings to the examiner ● Abnormal vs normal findings 5. ═══════════ CLOSING PRESENTATION ═══════════ ● EXACT WORDS for your closing statement ● Summary of positive findings ● Differential diagnosis (if appropriate) ● Investigations you would arrange ● Management plan (if appropriate) 6. ═══════════ EXAMINER PROBES ═══════════ ● Common "What else?" questions ● Common "Why did you do that?" questions ● EXACT ANSWERS for each probe 7. ═══════════ TIME MANAGEMENT ═══════════ ● How to divide your 8-10 minutes ● Pacing guide ● What to do if you run out of time 8. ═══════════ RED FLAGS ═══════════ ● MUST-NOT-MISS findings ● Emergency actions ● When to stop the examination and call for help 9. ═══════════ HKMLE OSCE TRAPS ═══════════ ● Common mistakes HK candidates make in this station ● How examiners penalise candidates ● How to avoid losing marks 10. ═══════════ EXECUTION CHECKLIST ═══════════ ● Simple tick-box checklist for the candidate ● Run through this during practice --- ADD THESE ELEMENTS THROUGHOUT PART 2 --- ● 🗣 "SAY THIS" - Exact verbal script in quotes ● ✅ "DO THIS" - Physical action to perform ● ❌ "DON'T SAY/DON'T DO" - Common errors ● ⏱️ "TIME CHECK" - Pacing reminders ● 🔑 "MAKE-OR-BREAK" - Examiner's critical observation points ═══════════════════════════════════════════════════════════════ FINAL OUTPUT FORMAT ═══════════════════════════════════════════════════════════════ The document should have: 1. A clear title page with the topic and "HKMLE Complete Study Note" 2. Table of Contents 3. Part 1: Knowledge Note (Papers 1 & 2) - complete with all sections and tables 4. A clear separator page between Part 1 and Part 2 5. Part 2: OSCE Script (Paper 3) - complete with all sections 6. A final summary page with key takeaways Generate now.
"valvular heart disease"[MeSH Terms] AND "guideline"[pt]
"infective endocarditis"[MeSH Terms] AND "guideline"[pt]
heart murmur auscultation valvular disease diagram

Summary : This figure illustrates a patient-centred evaluation process for the treatment of valvular heart disease, emphasizing shared decision-making based on clinical findings, disease severity, comorbidities, and patient preferences. flowchart: # Nodes : • Clinical examination (circle with stethoscope icon) • Confirmation of disease severity (circle with diagnostic tool icons) • Concomitant cardiac conditions (circle with heart illustration) • Comorbidities / frailty (circle with organ icons) • Patient’s preferences and goals (central illustration of patient and clinician at a table) • Heart Team evaluation (box: “Risk stratification including use of clinical scores; Timing and type of treatment”) • Shared treatment decision (box) # Connectors : • Arrows indicate a clockwise sequence: Clinical examination → Confirmation of disease severity → Concomitant cardiac conditions → Comorbidities/frailty → Heart Team evaluation → Shared treatment decision. • Central node (Patient’s preferences and goals) is visually emphasized and connected to the process, indicating its central role in decision-making. # Layout : • Circular/loop layout with four numbered steps (1–4) around the central patient-clinician interaction. • Heart Team evaluation and Shared treatment decision are placed to the right, following the assessment steps. • ESC and EACTS logos are present at the bottom right. # Analysis : • The diagram highlights a cyclical, multidisciplinary approach to valvular heart disease management, integrating clinical assessment, disease severity, comorbidities, and patient values. • The central placement of patient preferences underscores the importance of shared decision-making. • The process is iterative, suggesting ongoing reassessment and adaptation of treatment plans.
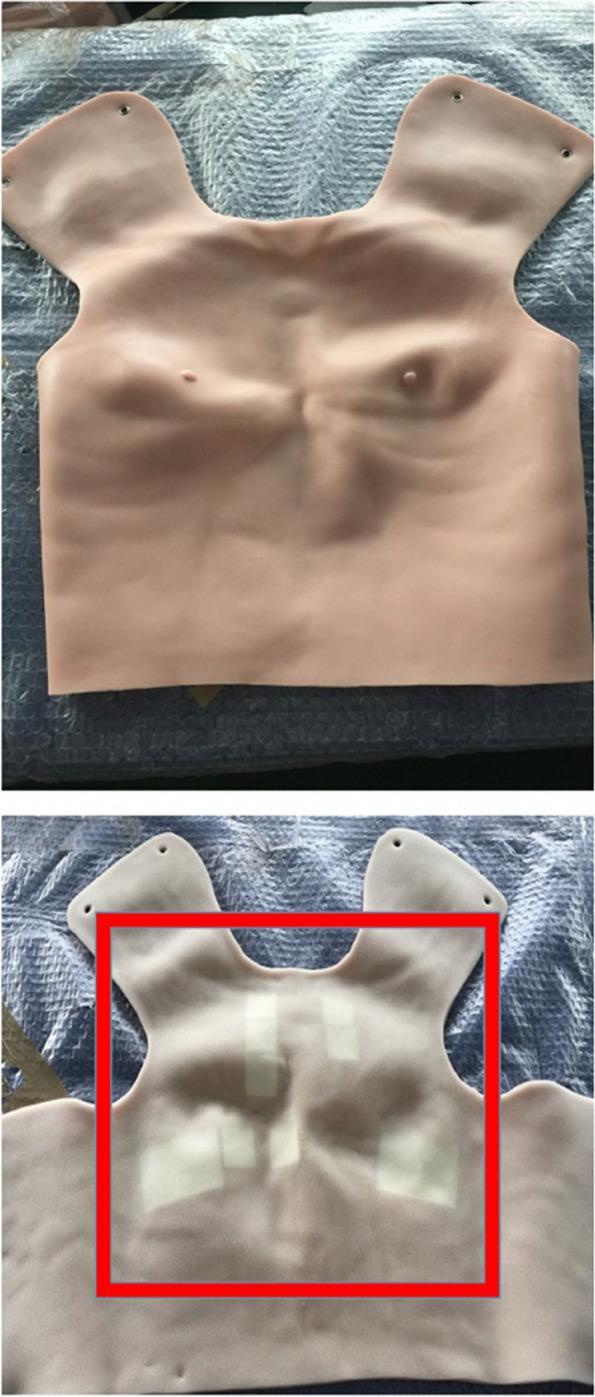
This medical educational photograph displays a prototype wearable auscultation vest designed for cardiovascular simulation. The top image shows the exterior surface of the vest, which is constructed from a skin-like, pale-toned material. It features anatomical landmarks including the suprasternal notch, clavicles, nipples, and contours representing the underlying ribcage and sternum to facilitate accurate stethoscope placement. The bottom image reveals the underside of the vest, highlighting the internal technology. Within the red box, several rectangular white panel speakers are visible, strategically adhered to the interior surface. These speakers are positioned at anatomically-standardized precordial auscultation sites to play real patient recordings of valvular heart disease sounds. The device is intended for hybrid simulation, allowing medical students to perform realistic physical examinations on standardized patients. This tool bridges the gap between theoretical knowledge of heart murmurs and clinical diagnostic skills by providing authentic auditory findings in a controlled, repeatable educational setting.
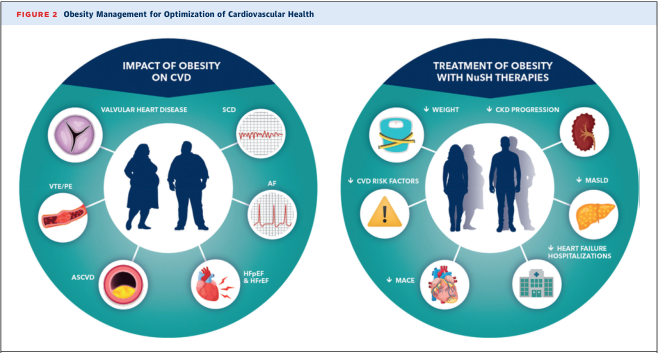
Summary : This figure presents two circular diagrams comparing the impact of obesity on cardiovascular disease (CVD) and the effects of treating obesity with NuSH therapies on various health outcomes. infographic: # Left Circle: Impact of Obesity on CVD : • Central silhouette of two adults. • Surrounding icons and labels for: – Valvular Heart Disease (heart valve illustration) – SCD (Sudden Cardiac Death, ECG tracing) – AF (Atrial Fibrillation, ECG tracing) – HFpEF & HFrEF (Heart Failure with preserved/reduced ejection fraction, heart muscle illustration) – ASCVD (Atherosclerotic Cardiovascular Disease, heart illustration) – VTE/PE (Venous Thromboembolism/Pulmonary Embolism, blood vessel illustration) # Right Circle: Treatment of Obesity with NuSH Therapies : • Central silhouette of two adults. • Surrounding icons and labels for: – Weight (scale and measuring tape) – CKD Progression (Chronic Kidney Disease, kidney illustration) – MASLD (Metabolic Dysfunction-Associated Steatotic Liver Disease, liver illustration) – Heart Failure Hospitalizations (hospital building) – MACE (Major Adverse Cardiovascular Events, heart illustration) – CVD Risk Factors (triangle warning sign) # Design Encodings : • Circular layout for both diagrams. • Icons visually represent each condition or outcome. • Consistent color palette (teal, blue, white, and accent colors for organs). • Central silhouettes emphasize the human impact. # Analysis : • The left diagram highlights multiple cardiovascular and thromboembolic conditions associated with obesity. • The right diagram shows that NuSH therapies for obesity target a broad range of health outcomes, including weight reduction, slowing CKD progression, reducing liver disease, lowering heart failure hospitalizations, decreasing major adverse cardiovascular events, and mitigating CVD risk factors. • The visual structure emphasizes the multifaceted impact of obesity and the potential benefits of targeted therapies.
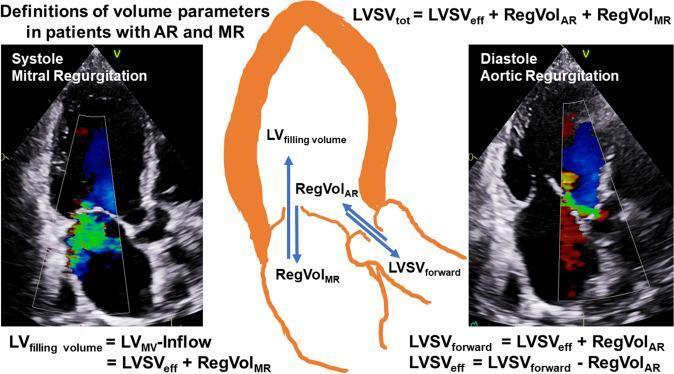
This educational image combines diagnostic echocardiography and an anatomical diagram to define left ventricular (LV) volume parameters in the context of combined valvular heart disease. The left panel shows a systolic color Doppler echocardiogram in an apical view, highlighting Mitral Regurgitation (MR). A mosaic-colored turbulent jet is visible originating from the mitral valve and entering the left atrium. The right panel displays a diastolic color Doppler echocardiogram demonstrating Aortic Regurgitation (AR), with a blue-red turbulent jet flowing from the aortic valve into the LV outflow tract. Centrally, a schematic illustration of the heart outlines blood flow vectors: RegVolMR (regurgitant volume through the mitral valve), RegVolAR (regurgitant volume through the aortic valve), and LVSVforward (forward stroke volume). Mathematical formulas define key hemodynamic concepts, including LV filling volume, total LV stroke volume (LVSVtot), and effective stroke volume (LVSVeff). This material is designed for intermediate to advanced medical learners to understand the complex volume dynamics and echocardiographic assessment of interdependent valvular lesions.
cardiac tamponade pericardial effusion echocardiogram
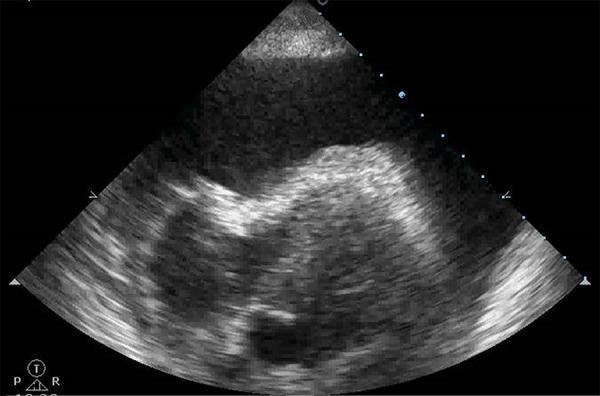
This diagnostic image is a transthoracic echocardiogram (ultrasound) in a subcostal or apical view, demonstrating a large pericardial effusion leading to cardiac tamponade. The most prominent feature is a significant, echo-free (anechoic to hypoechoic) space surrounding the cardiac structures, which represents fluid accumulation within the pericardial sac. Centrally, the heart appears relatively small or compressed within this large volume of fluid. The ultrasound shows the characteristic grayscale appearance of the myocardium and endocardium, though the cardiac chambers are obscured by the surrounding effusion. Clinically, this visual finding is pathognomonic for cardiac tamponade when associated with hemodynamic instability, as the intrapericardial pressure exceeds intracardiac filling pressure, compromising cardiac output. This image serves as a critical educational tool for emergency physicians and cardiologists in identifying life-threatening obstructive shock through point-of-care ultrasound (POCUS).
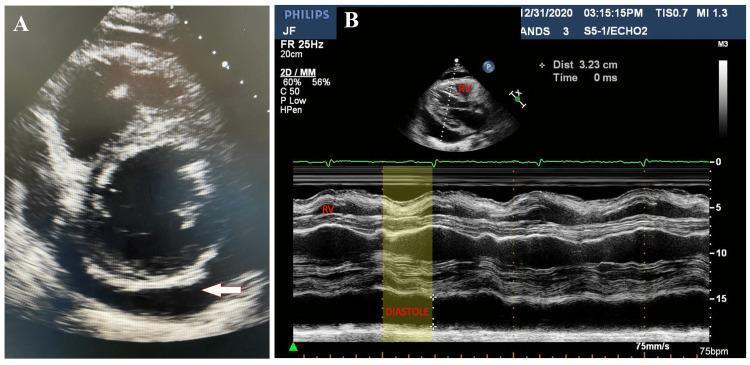
Two-panel echocardiographic study demonstrating pericardial effusion and signs of cardiac tamponade. Panel A shows a 2D transthoracic echocardiogram in a parasternal short-axis view at the basal level of the left ventricle. A large, anechoic (dark) space representing a circumferential pericardial effusion is visible surrounding the cardiac structures; a white arrow specifically highlights the posterior fluid collection. Panel B displays an M-mode echocardiogram with a simultaneous EKG trace. A yellow-shaded region highlights early diastolic collapse of the right ventricular (RV) free wall, a critical diagnostic indicator of increased intrapericardial pressure leading to hemodynamic compromise. The imagery illustrates key pathophysiological findings of cardiac tamponade, specifically the inward motion of the right ventricular wall during diastole when ventricular pressure is lowest, caused by the external pressure of the large effusion.
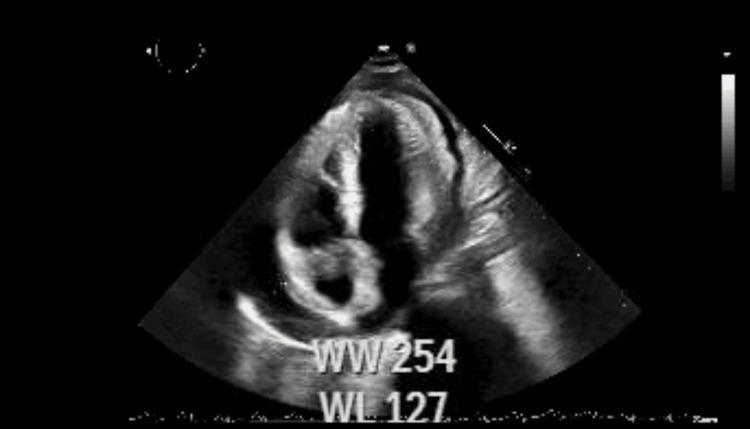
A diagnostic echocardiogram in the apical four-chamber view showing the early hemodynamic signs of cardiac tamponade. The image demonstrates a small-to-moderate circumferential pericardial effusion, visible as an anechoic (dark) space between the hyperechoic pericardium and the epicardium. Key clinical findings include visible compression and diastolic collapse of the right heart chambers, particularly the right atrium and right ventricle, due to increased intrapericardial pressure. There is evidence of abnormal septal motion, often associated with pericardial constriction or tamponade physiology. The overall cardiac silhouette appears slightly distorted by the external fluid pressure. This diagnostic image is intended for intermediate to advanced medical learners to illustrate the pathophysiology of obstructive shock secondary to pericardial effusion and the importance of echocardiography in identifying early signs of cardiac tamponade.
"infective endocarditis" AND diagnosis treatment
"cardiomyopathy" AND management guidelines
hypertrophic cardiomyopathy echocardiogram septal hypertrophy
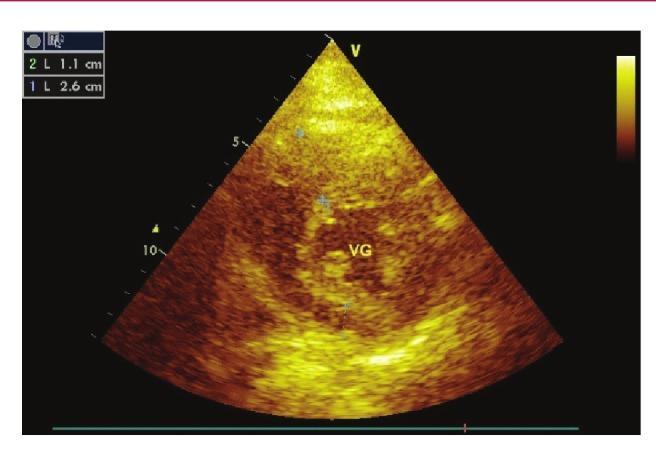
Diagnostic ultrasound image showing a transthoracic echocardiogram in a parasternal short-axis (PSAX) view at the level of the papillary muscles. The image demonstrates hallmark features of Hypertrophic Cardiomyopathy (HCM) in a 27-year-old patient. A significant asymmetric septal hypertrophy is visualized, with on-screen electronic calipers measuring the interventricular septum at 2.6 cm (26 mm). In contrast, the posterior wall measurement is marked at 1.1 cm (11 mm), resulting in a septal-to-posterior wall ratio of approximately 2.36, well above the clinical threshold for asymmetric hypertrophy. The left ventricular (VG) cavity appears reduced in size due to the encroaching hypertrophied myocardium. The myocardial texture is heterogeneous and echogenic, typical of fiber disarray seen in HCM. This clinical photograph is used to illustrate cardiac structural remodeling and the diagnostic criteria for cardiomyopathy in cardiology education.
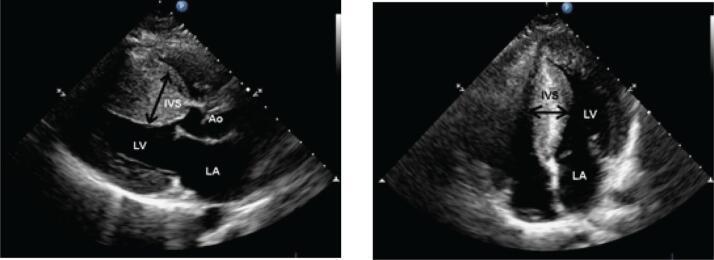
Transthoracic echocardiogram (TTE) images displaying classic hallmarks of Hypertrophic Cardiomyopathy (HCM). The left panel shows a parasternal long-axis view, while the right panel shows an apical four-chamber view. Both views demonstrate severe asymmetrical hypertrophy of the interventricular septum (IVS), highlighted by calipers. The IVS is markedly thickened compared to the posterior wall, exhibiting increased echogenicity that may suggest myofibrillar disarray or fibrosis. This septal hypertrophy results in significant encroachment into the left ventricular (LV) cavity, leading to a reduced LV chamber size. The left atrium (LA) appears dilated, a common secondary finding due to diastolic dysfunction. In the long-axis view, the thickened septum is positioned near the aortic root (AO), illustrating the anatomical substrate for potential left ventricular outflow tract (LVOT) obstruction. These findings are critical for diagnosing obstructive or non-obstructive HCM and assessing the risk of cardiovascular complications.
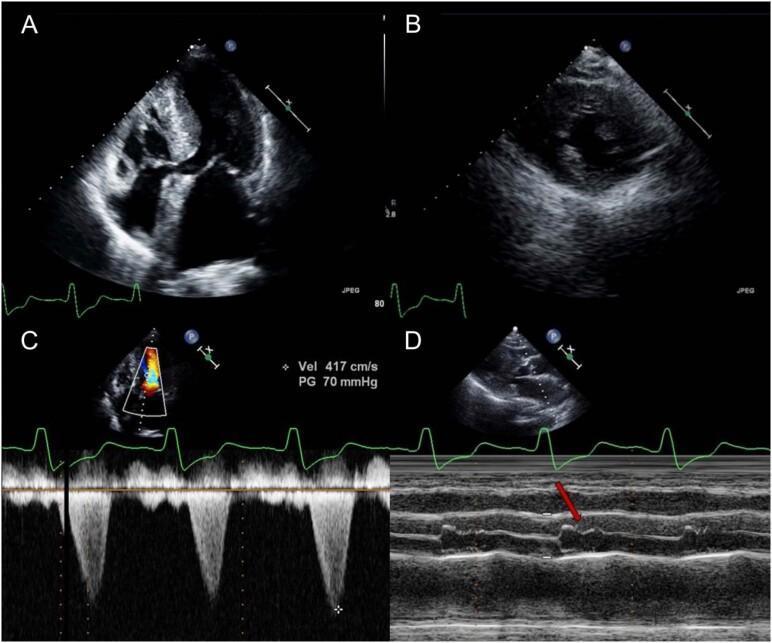
Transthoracic echocardiogram panel demonstrating diagnostic features of hypertrophic cardiomyopathy (HCM). Panel A (apical four-chamber view) and Panel B (parasternal short-axis view) illustrate asymmetric septal hypertrophy, with the interventricular septum measuring 19 mm compared to a 13 mm posterior wall. Panel C shows continuous-wave Doppler across the left ventricular outflow tract (LVOT), revealing a late-peaking systolic jet with a peak velocity of 417 cm/s and a significant pressure gradient (PG) of 70 mmHg, indicative of dynamic obstruction. Panel D presents an M-mode echocardiogram through the aortic valve; the red arrow highlights mid-systolic closure of the aortic valve leaflets, a classic sign of severe LVOT obstruction. The composite images effectively demonstrate the structural and hemodynamic hallmarks of obstructive HCM, including the relationship between septal thickening and valvular dysfunction.
aortic stenosis mitral regurgitation valve pathology
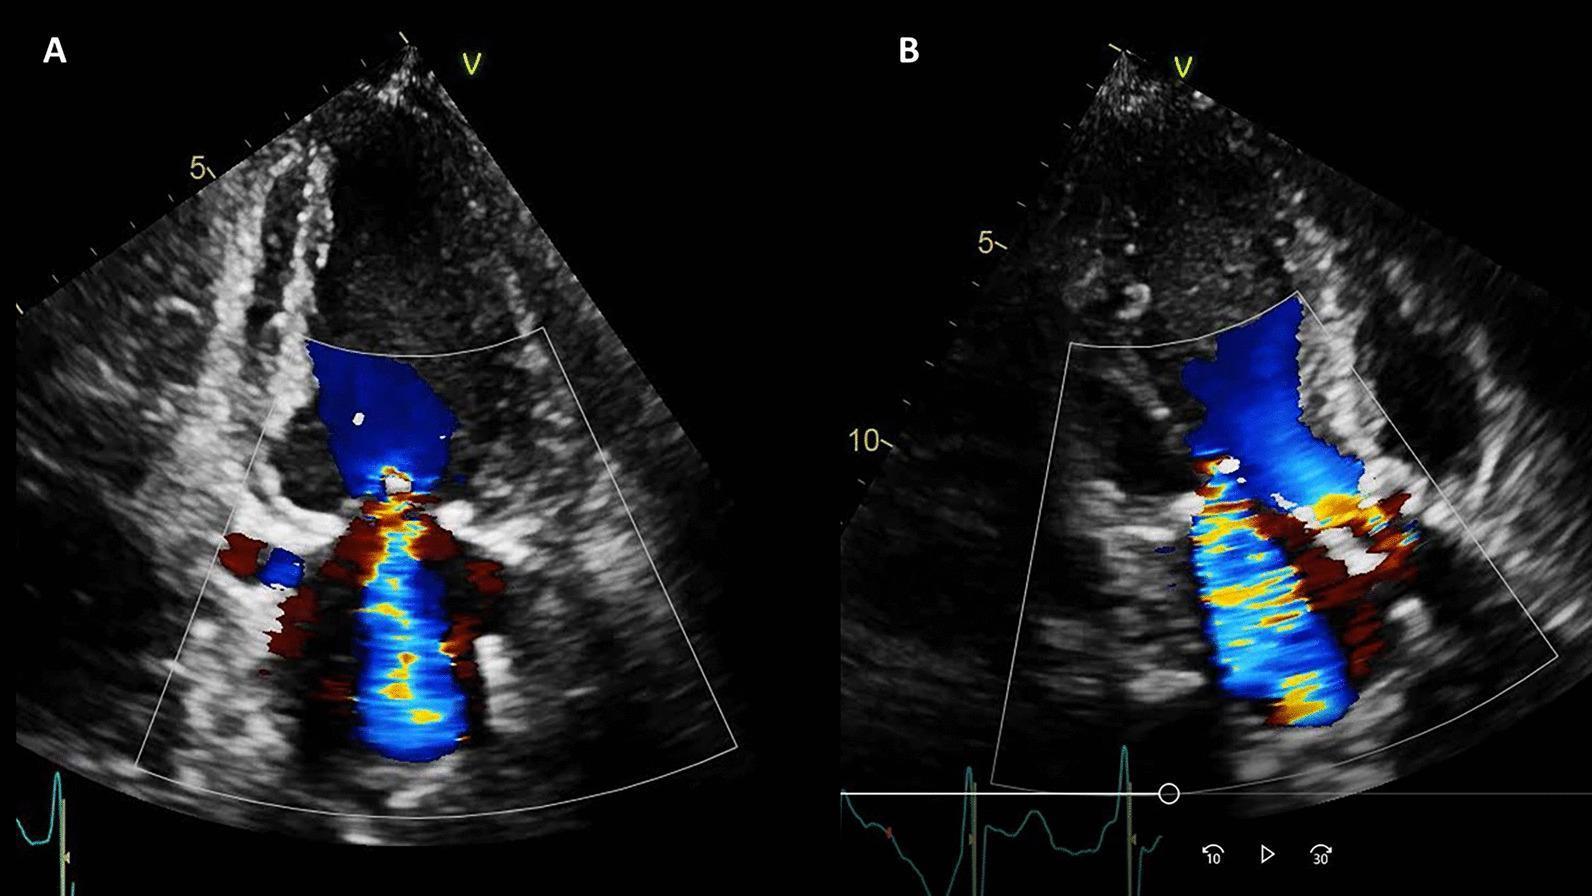
Two color Doppler transthoracic echocardiography images (TTE) demonstrating valvular pathology in a patient with heart failure. Figure A displays an apical two-chamber view, while Figure B shows an apical three-chamber view. In both panels, a prominent blue-colored systolic jet originates from the mitral valve and extends deep into the left atrium, signifying severe mitral regurgitation (MR) with flow moving away from the ultrasound transducer. Concurrently, the aortic valve region exhibits high-velocity, turbulent flow, visualized as a multi-colored mosaic pattern (red, yellow, and blue) within the left ventricular outflow tract and proximal aorta. These findings are clinically indicative of hemodynamically significant mitral regurgitation and concurrent aortic valve dysfunction, such as stenosis or regurgitation. The images include anatomical landmarks of the left ventricle and left atrium, with ECG gating visible at the bottom of the frames, providing essential visual evidence for assessing valvular heart disease and its impact on cardiac hemodynamics.
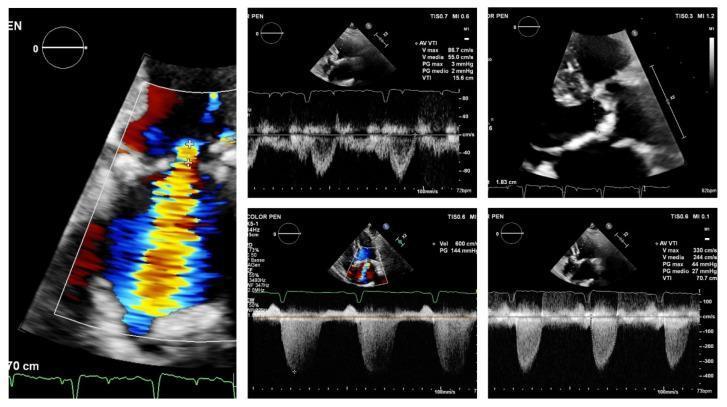
This composite diagnostic image displays multiple echocardiographic views evaluating a patient with concomitant severe aortic stenosis (AS) and mitral regurgitation (MR). The panel on the left features a color Doppler assessment of a mitral regurgitant jet, demonstrating high-velocity, turbulent flow characterized by a central yellow-red mosaic pattern transitioning to blue at the periphery, originating from the mitral valve into the left atrium. The top-right and middle-right panels provide 2D anatomical views and pulsed-wave Doppler (PWD) of the left ventricular outflow tract (LVOT). The bottom panels display spectral Doppler tracings used for hemodynamic quantification. The continuous-wave Doppler (CWD) of the aortic valve shows a peak velocity (Vmax) of 330 cm/s and a mean pressure gradient (MPG) of 27 mmHg, while the mitral jet velocity is recorded at 600 cm/s (6 m/s). This multi-modal ultrasound study illustrates a paradoxical low-flow, low-gradient AS phenotype where the severe MR complicates the estimation of AS severity due to reduced forward stroke volume and altered jet momentum flux.
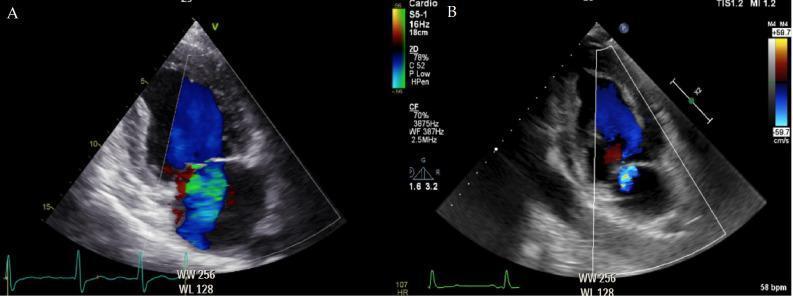
This diagnostic image consists of two side-by-side transthoracic echocardiograms (apical four-chamber views) using color Doppler imaging to evaluate mitral regurgitation (MR). Image A depicts a patient with severe aortic stenosis (AS) and concomitant moderate mitral regurgitation. A large, prominent color jet is visible, characterized by a blue mosaic pattern indicating flow away from the transducer into the left atrium, with significant turbulent flow (aliasing) represented by green and red speckling. This reflects high-velocity regurgitant flow due to left ventricular pressure overload. Image B shows the same patient 24 hours after transcatheter aortic valve replacement (TAVR). The color Doppler signal is markedly reduced to a trace regurgitant jet, demonstrating a significant decrease in the spatial extent and intensity of the flow. This comparative visual illustrates the hemodynamic interdependence of valvular lesions, where the correction of aortic stenosis and subsequent normalization of left ventricular systolic pressure lead to an immediate functional improvement in mitral valve competence.
infective endocarditis vegetation echocardiogram Duke criteria
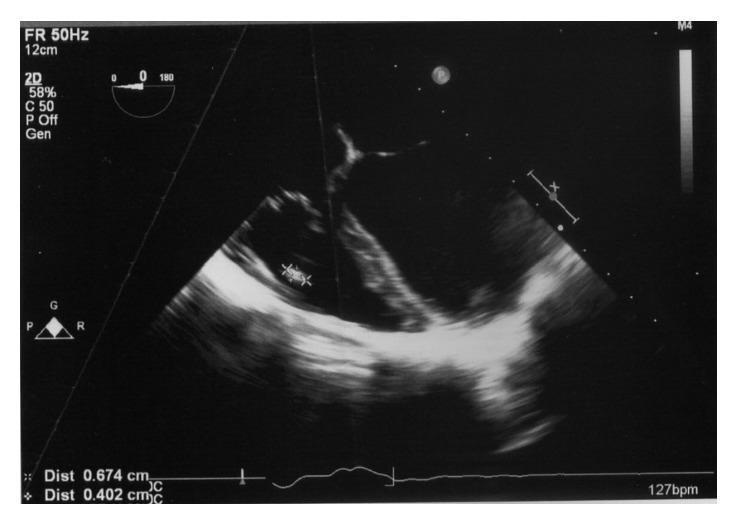
A grayscale diagnostic image from a transoesophageal echocardiogram (TOE) demonstrating a tricuspid valve vegetation in a patient with infective endocarditis. The image shows a mid-oesophageal four-chamber view focusing on the right side of the heart. A distinct, irregularly shaped, pedunculated mass measuring approximately 7 mm x 4 mm is visible, attached to the posterior leaflet of the tricuspid valve. This mass exhibits heterogeneous echogenicity, appearing more echodense than the surrounding blood pool but less uniform than the valve leaflet itself. Clinical significance includes the diagnosis of right-sided infective endocarditis, often associated in this context with pre-existing conditions like a ventricular septal defect (VSD). Key educational concepts illustrated include echocardiographic identification of valvular vegetations, assessment of mass size and mobility on heart valves, and the application of Duke's criteria for diagnosing endocarditis. The image provides critical visual evidence for managing structural heart disease and systemic infection.
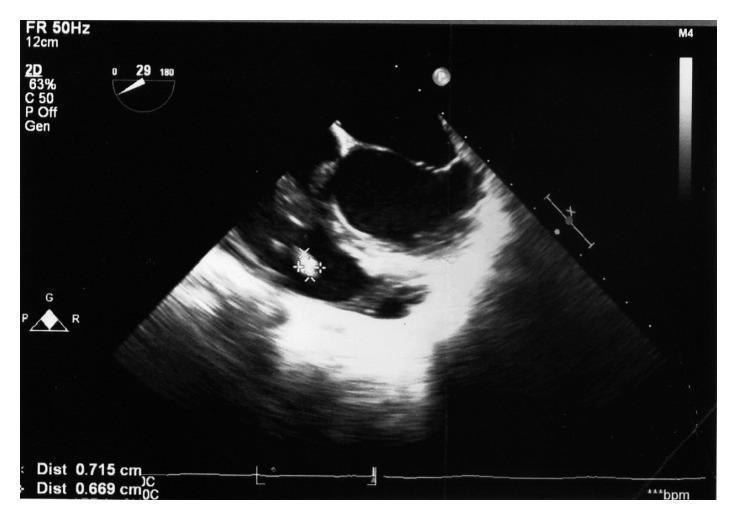
This diagnostic image is a 2D transoesophageal echocardiogram (TOE) demonstrating a significant finding in the context of infective endocarditis. The primary focus is a distinct, hyperechoic, irregular mass marked with white asterisks, identified as a cardiac vegetation. Electronic calipers measure the structure's dimensions at approximately 0.715 cm by 0.669 cm. The vegetation is attached to the posterior leaflet of the tricuspid valve, visible within the right-sided heart chambers. Technical parameters displayed include a frame rate (FR) of 50Hz, imaging depth of 12cm, and a sector angle of 29 degrees. This visual is clinically significant for the diagnosis and monitoring of tricuspid valve endocarditis, illustrating the persistence of vegetation size despite antibiotic therapy. Key educational concepts include ultrasound echogenicity of vegetations, tricuspid valve anatomy, and the application of Duke's criteria in clinical cardiology.
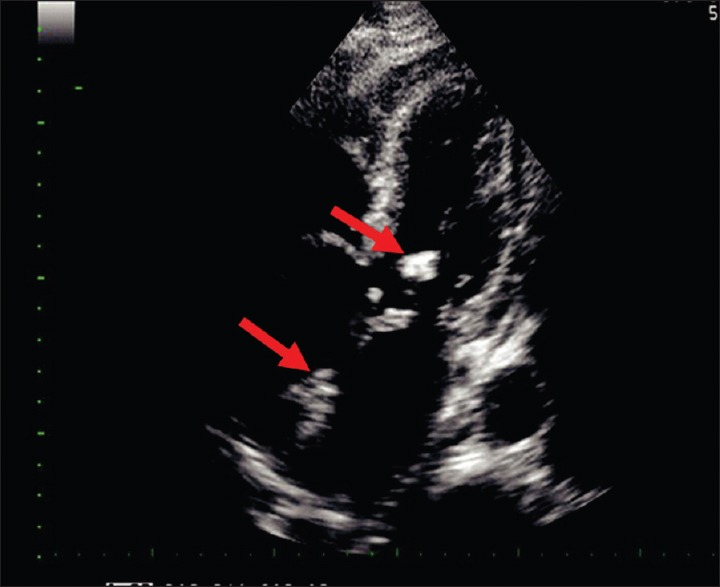
**Imaging Modality:** Transthoracic echocardiogram (TTE), grayscale B-mode. **Anatomical Region:** Parasternal long-axis view of the heart, focusing on the left ventricular outflow tract (LVOT), aortic valve, and mitral valve apparatus. **Observed Pathology:** Infective endocarditis presenting as multiple valvular vegetations. Two prominent, irregular, echogenic masses are identified (marked by red arrows). **Characteristic Visual Features:** * **Vegetations:** Highly echogenic, mobile-appearing pedunculated masses. * **Distribution:** One vegetation is localized to the non-coronary cusp of the aortic valve. A second, larger vegetation is attached to the atrial surface of the anterior mitral valve leaflet. * **Morphology:** The masses exhibit heterogeneous echogenicity and irregular borders, characteristic of fibrin-platelet-bacterial aggregations. **Key Diagnostic Features:** The simultaneous involvement of the aortic and mitral valves suggests "kissing vegetations" or contiguous spread of infection. These findings are primary diagnostic criteria for definitive infective endocarditis according to the Modified Duke Criteria. The image lacks color Doppler, but the anatomical positioning indicates a high risk for valvular regurgitation and embolic events.
dilated cardiomyopathy restrictive amyloid cardiac MRI
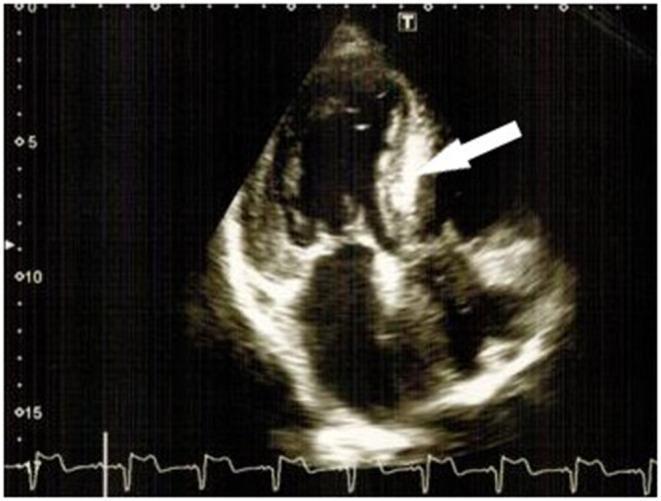
This diagnostic image is a 2D transthoracic echocardiogram in an apical four-chamber view, demonstrating hallmark features of restrictive cardiomyopathy, specifically cardiac amyloidosis. The visual highlights significant concentric left ventricular hypertrophy (LVH) with a markedly thickened interventricular septum. A white arrow points to the 'characteristic luminescence' or 'sparkling' appearance of the myocardial tissue, which indicates increased echogenicity due to amyloid protein deposition. Both atria appear moderately dilated, which is consistent with the restrictive filling pattern and diastolic dysfunction typical of infiltrative heart diseases. The image also captures a concurrent ECG strip at the bottom for cardiac cycle timing. Key educational concepts illustrated include the visualization of myocardial texture changes, wall thickening (hypertrophy), and chamber enlargement as diagnostic indicators for amyloid-related cardiac involvement.
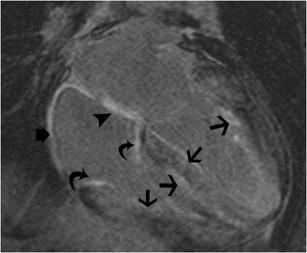
This diagnostic cardiac MRI is a four-chamber delayed-enhancement (LGE) view demonstrating characteristic findings of cardiac amyloidosis. The image shows a diffuse and global pattern of hyperenhancement involving multiple cardiac structures. Notable features include intense late gadolinium enhancement of the tricuspid valve leaflets (curved arrows) and the interatrial septum (arrowhead). Furthermore, there is diffuse, transmural hyperenhancement of both the left and right ventricular myocardium (straight arrows), alongside visible enhancement of the right atrial wall (short arrow). These findings indicate an extensive interstitial deposition of amyloid proteins throughout the heart, characteristic of restrictive cardiomyopathy. The image highlights the systemic nature of amyloid infiltration, affecting not only the ventricular and atrial myocardium but also the valvular apparatus and septal structures, which distinguishes it from regional ischemic patterns of enhancement.
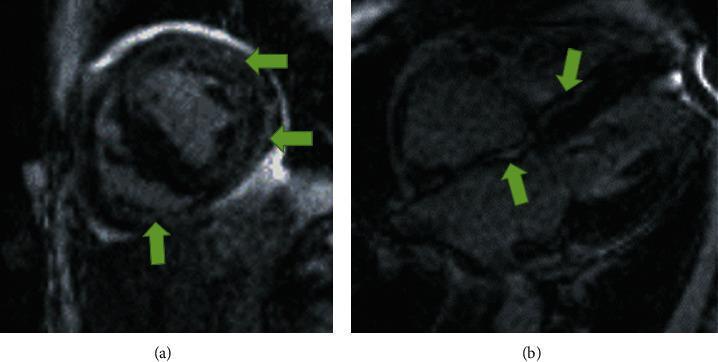
This diagnostic imaging figure consists of two delayed gadolinium enhancement (LGE) cardiac MRI sequences demonstrating hallmark findings of infiltrative cardiomyopathy, specifically cardiac amyloidosis. Image (a) displays a short-axis view of the ventricles, where green arrows indicate extensive, diffuse mid-myocardial and subendocardial late gadolinium enhancement within the left ventricular myocardium. Image (b) presents a four-chamber view highlighting significant enhancement along the atrial walls and the interatrial septum (green arrows), which is a highly suggestive feature of amyloid deposition. The enhancement patterns do not follow a specific coronary vascular territory, distinguishing this from ischemic injury. Anatomically, the images show thickened myocardial walls and biatrial enlargement, consistent with the restrictive filling patterns and decreased systolic function associated with wild-type transthyretin amyloidosis (wt-ATTR). These visual markers serve as critical diagnostic evidence for differentiating amyloidosis from other forms of hypertrophic or restrictive heart disease in clinical cardiology.
Please continue and give me the pdf
mkdir -p /tmp/workspace/hkmle-module1d && ls /tmp/workspace/hkmle-module1d/
You are an expert HKMLE tutor helping me ACE the Hong Kong Medical Licensing Examination (Papers 1 and 2). Create a high-yield, comprehensive, beginner-friendly study note for the topic below. You are FULLY AUTHORISED to add any sections, mnemonics, tables, diagrams (text-based), clinical pearls, trap warnings, red flags, drug interactions, trial data, comparisons, flowcharts, quick summaries, or anything else you think will help me ACE this exam. --- DIAGRAM REQUIREMENTS --- If you can generate actual images/diagrams, include them. If not, use clear written descriptions instead of text-based ASCII diagrams. --- REQUIREMENTS --- For each major condition, include: - Definition - Classification (with table where helpful) - Aetiology / Causes (with a BOLD mnemonic) - Pathophysiology (step-by-step, beginner-friendly) - Risk factors (with mnemonic) - Symptoms (with mnemonic) - Signs (with mnemonic) - Investigations (with mnemonic). Provide a prioritised diagnostic algorithm (Bedside → Labs → Imaging). - Management (acute and chronic, with mnemonics for treatment steps). Differentiate standard international guidelines from local Hong Kong Hospital Authority (HA) protocols and Centre for Health Protection (CHP) recommendations. Break down emergency steps into explicit verbal orders. - Complications (with mnemonic where possible) - Prognosis (with mnemonic where possible) --- ADD THESE ELEMENTS THROUGHOUT --- - ⚠️ HKMLE TRAP boxes (Highlight where standard US/UK textbook answers will cause me to lose marks on Paper 1 & 2) - 🏢 HA CLINICAL PATHWAY boxes (Specify default drug formulations, staging systems, or referral pathways used in HK public hospitals) - 📋 CHP STATUTORY NOTIFICATION boxes (Explicitly flag if the condition is a statutory notifiable infectious disease in HK) - 🌏 LOCAL EPIDEMIOLOGY VARIANT boxes (Highlight high-prevalence local variations, e.g., Klebsiella liver abscesses, Recurrent Pyogenic Cholangitis, local Thalassemia/G6PD patterns) - 📋 INVESTIGATION INTERPRETATION boxes (Provide a classic raw data result example—e.g., ABG, CSF, ECG—and its 1-sentence interpretation) - ⚖️ LEGAL & ETHICAL ORDINANCE boxes (Flag relevant local legislation, e.g., Cap. 136 Mental Health Ordinance or mandatory reporting rules) - 📌 QUICK SUMMARY boxes - 🚨 RED FLAGS box - ❓ COMMON EXAM QUESTION box - 🔬 BASIC SCIENCE INTEGRATION box --- REQUIRED TABLES AT THE END --- - ⚠️ DRUG TRAPS table - 📊 NOTABLE TRIALS table - 🧠 MASTER MNEMONICS table - 🔗 CROSS-MODULE LINKS --- TOPIC --- Module 1D: Valvular + Pericardial + Cardiomyopathies + Infective Endocarditis Valvular Heart Disease: - Aortic stenosis (AS) — causes (bicuspid, calcific, rheumatic), pathophysiology, symptoms (SAD), signs (slow-rising pulse, narrow pulse pressure, ejection systolic murmur), investigations (Echo, catheterisation), management (TAVI vs SAVR), indications for surgery. - Aortic regurgitation (AR) — causes (rheumatic, bicuspid, endocarditis, aortic dissection, Marfan), pathophysiology, symptoms, signs (wide pulse pressure, collapsing pulse, early diastolic murmur), management (surgical indications). - Mitral stenosis (MS) — causes (rheumatic — most common), pathophysiology, symptoms (dyspnoea, haemoptysis, hoarseness), signs (malar flush, tapping apex, opening snap, mid-diastolic murmur), management (valvotomy, replacement). - Mitral regurgitation (MR) — causes (rheumatic, myxomatous, ischaemic), pathophysiology (acute vs chronic), symptoms, signs (pansystolic murmur at apex radiating to axilla), management (surgical indications). - Rheumatic heart disease — Jones criteria, prophylaxis (secondary penicillin), HK relevance. Pericardial Disease: - Acute pericarditis — causes, clinical features (positional chest pain, pericardial friction rub, ECG changes), investigations, management (aspirin, colchicine, AVOID steroids). - Cardiac tamponade — Beck's triad, pulsus paradoxus, ECG (low voltage, electrical alternans), Echo, emergency pericardiocentesis. - Constrictive pericarditis — causes, Kussmaul's sign, dip-and-plateau (square root sign), management (pericardiectomy). Cardiomyopathies: - Dilated cardiomyopathy (DCM) — causes (familial, viral, alcohol), pathophysiology, management (HFrEF GDMT, ICD/CRT, transplant). - Hypertrophic cardiomyopathy (HCM) — genetics (MYH7, MYBPC3), pathophysiology (asymmetric septal hypertrophy, LVOT obstruction), symptoms (syncope, sudden death), management (beta-blockers, verapamil, ICD, septal myectomy/alcohol ablation). - Restrictive cardiomyopathy (RCM) — causes (amyloid, sarcoid, haemochromatosis), pathophysiology, management (treat underlying cause). - Arrhythmogenic right ventricular cardiomyopathy (ARVC) — genetics, ECG (T-wave inversion V1-V3, epsilon waves), management (ICD). Infective Endocarditis (IE): - Classification (native valve, prosthetic valve, intravenous drug use) - Aetiology (Strep viridans, Staph aureus, Enterococcus, HACEK) - Modified Duke Criteria (major and minor) - Clinical features (Osler's nodes, Janeway lesions, Roth spots, splinter haemorrhages) - Investigations (blood cultures, Echo) - Management (IV antibiotics — benzylpenicillin + gentamicin for Strep viridans; vancomycin + gentamicin if Staph/unknown) - Prophylaxis (NICE vs AHA/ESC differences — HK HA practice) - Complications (heart failure, abscess, emboli) Generate the complete ace-level note now.
"hypertrophic cardiomyopathy" AND guideline
"infective endocarditis" AND ESC guidelines 2023
aortic stenosis echocardiogram calcified valve gradient
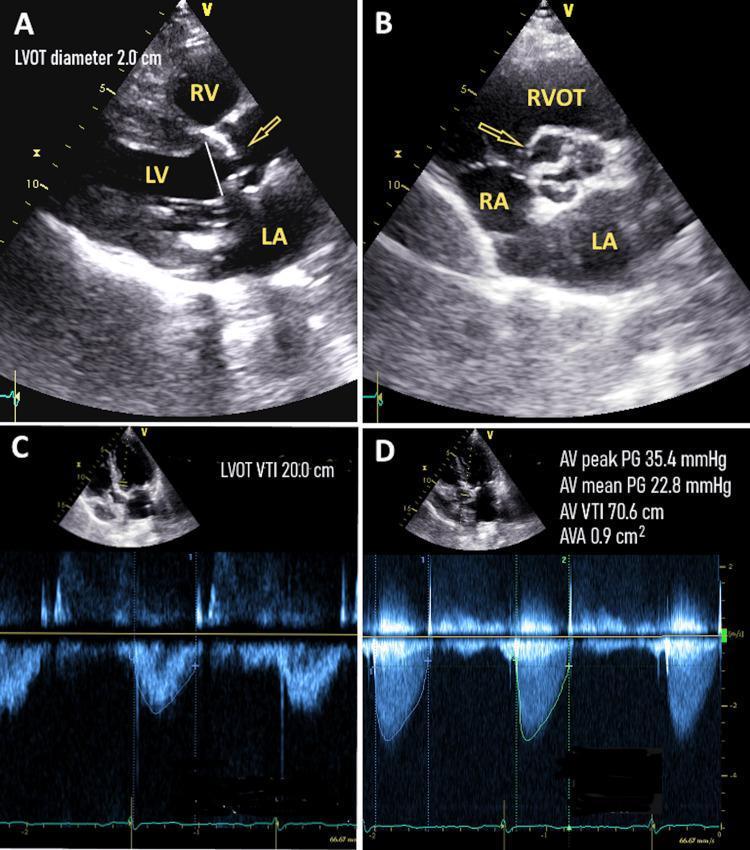
Transthoracic echocardiogram (TTE) panel demonstrating the diagnostic assessment of aortic stenosis. Panel A shows a parasternal long-axis view with a thickened, calcified aortic valve and restricted leaflet opening (arrow); the Left Ventricle Outflow Tract (LVOT) diameter is measured. Panel B provides a parasternal short-axis view (basin view) confirming valvular calcification and reduced orifice area. Panel C displays pulsed-wave Doppler at the apical five-chamber view measuring the LVOT Velocity Time Integral (VTI) at 20.0 cm. Panel D utilizes continuous-wave Doppler across the aortic valve to calculate hemodynamic parameters, including a mean pressure gradient of 22.8 mmHg and a calculated Aortic Valve Area (AVA) of 0.9 cm². The combination of these findings—specifically a low mean gradient (<40 mmHg) despite a small valve area (<1.0 cm²)—is characteristic of low-gradient severe aortic stenosis. Key anatomical landmarks labeled include the Left Ventricle (LV), Right Ventricle (RV), Left Atrium (LA), and Right Atrium (RA).
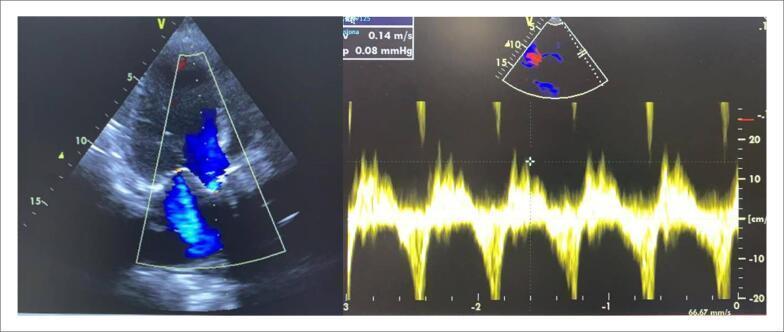
This diagnostic image consists of two panels showcasing a transthoracic echocardiogram (TTE) of a patient with severe aortic stenosis. The left panel shows a 2D apical window view with Color Doppler, highlighting turbulent, high-velocity jet flow (blue/mosaic pattern) across a calcified aortic valve. The right panel displays a Spectral Doppler waveform showing a continuous, repeating velocity pattern with a scale ranging from -20 cm/s to +20 cm/s on the y-axis. Text overlays indicate a measured velocity of 0.14 m/s and a pressure gradient of 0.08 mmHg at the specific cursor point, though the clinical context confirms a high-gradient stenotic profile (mean gradient 35 mmHg, maximum 66 mmHg) and a reduced valve area of 0.6 cm². The image demonstrates the diagnostic assessment of valvular heart disease and left ventricular function, typically used for planning Transcatheter Aortic Valve Implantation (TAVI).
ECG pericarditis saddle-shaped ST elevation electrical alternans
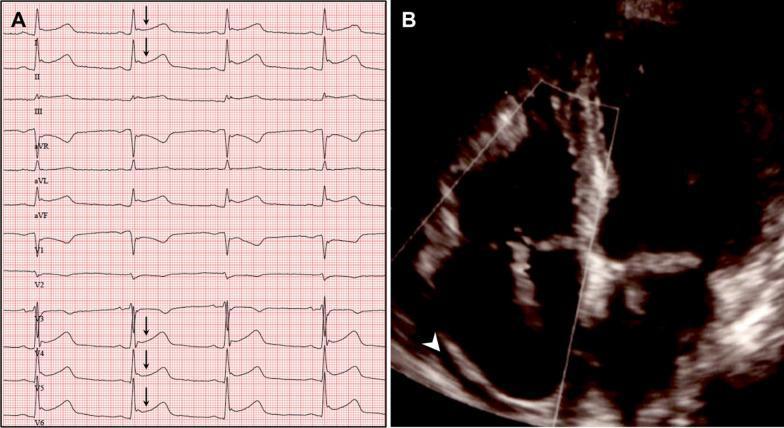
This composite diagnostic image illustrates clinical findings associated with post-cardiac injury syndrome (PCIS) following radiofrequency ablation. Panel A shows a 12-lead electrocardiogram (ECG) demonstrating widespread, saddle-shaped ST-segment elevations, most prominently visible in the lateral and inferior leads (I, II, aVL, and V4-V6), indicated by black arrows. These findings are characteristic of acute pericarditis. Panel B presents a transthoracic echocardiogram in a four-chamber view, where a white arrowhead points to a dark, echo-free space surrounding the cardiac chambers. This represents a circumferential pericardial effusion. Together, these panels provide a clinical correlation between electrical abnormalities (diffuse ST elevation) and structural pathology (fluid in the pericardial space) in the context of post-procedural cardiac inflammation. The content is suitable for medical education regarding complications of cardiac interventions and the diagnosis of acute pericarditis.
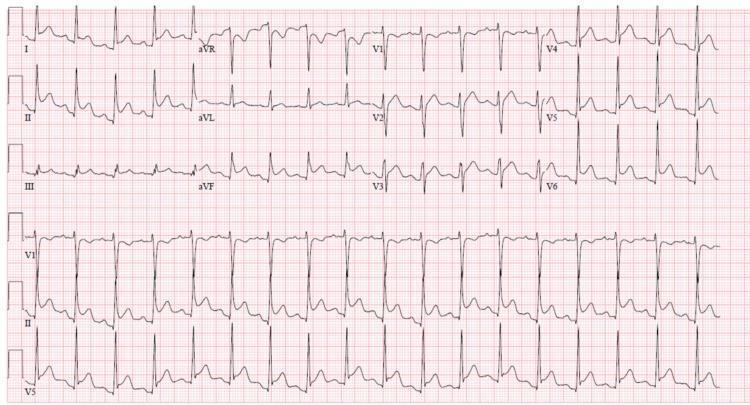
A standard 12-lead electrocardiogram (ECG) demonstrating findings characteristic of acute pericarditis. The tracing shows diffuse, concave 'saddle-shaped' ST-segment elevation across multiple leads, including I, II, III, aVF, and V2 through V6. Conversely, lead aVR displays reciprocal ST-segment depression. A notable diagnostic feature present is PR-segment depression, most clearly visualized in lead II, while lead aVR shows reciprocal PR-segment elevation. Additionally, the TP segments exhibit a subtle downward slope (Spodick's sign) in several leads. The heart rhythm is sinus tachycardia, consistent with a systemic inflammatory process. These combined visual features—diffuse ST elevation and PR segment changes—are classic indicators used to differentiate pericarditis from localized ST-elevation myocardial infarction (STEMI).
infective endocarditis Osler nodes Janeway lesions splinter haemorrhages Roth spots
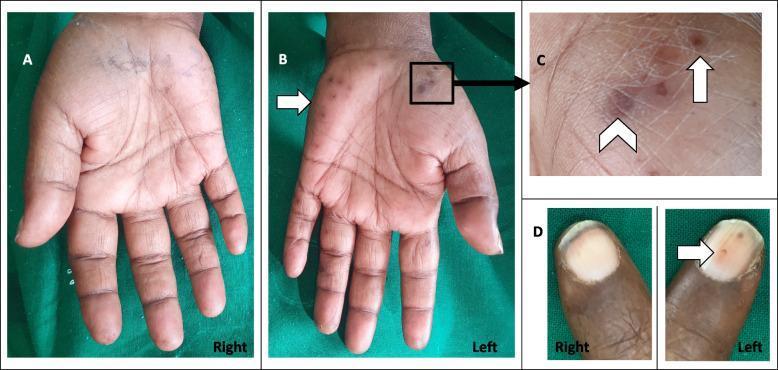
This composite clinical photograph displays the physical findings of infective endocarditis manifest in the hands. Panel A shows a normal right palm for comparison. Panel B illustrates the left palm with multiple erythematous to violaceous lesions located on the thenar and hypothenar eminences. Panel C provides a magnified view of these palm lesions, distinguishing between Osler's nodes—small, raised, tender, reddish-purple nodules (marked with an arrow)—and Janeway lesions, which are flat, non-tender, erythematous macules (marked with an arrowhead). Panel D compares the nailbeds, highlighting a splinter hemorrhage on the left digit, characterized by a small, linear, dark-red streak beneath the nail plate, while the right nailbed appears normal. These peripheral stigmata are classic clinical indicators of septic emboli or immunological responses associated with systemic infections like endocarditis or infected arteriovenous fistulas.
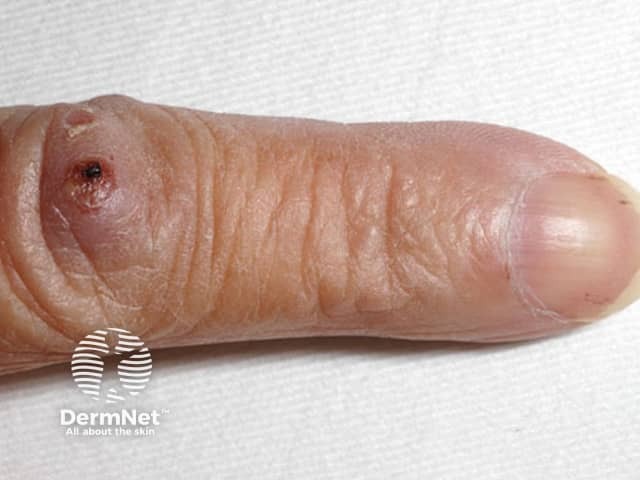
This clinical photograph documents a lateral view of the index finger with visible cutaneous signs of infective endocarditis. The primary subject is dermatologic manifestations: Osler nodes—tender, subcutaneous nodules located at the fingertip/distal phalanx region—alongside splinter hemorrhages beneath the nail plate. The image demonstrates a small, dark lesion near the fingertip base and tiny linear reddish-brown streaks under the nail plate. The surrounding skin shows mild edema and inflammatory changes. These findings are classic for subacute bacterial endocarditis and immune complex–mediated vasculitis. Diagnostic significance: Osler nodes indicate immune-complex deposition in the dermis with concurrent bacteremia and endocardial infection; splinter hemorrhages reflect distal microemboli or microvasculopathy. Differential considerations include Janeway lesions (painless), rheumatoid nodules, vasculitic lesions, or trauma-related changes. Clinical correlation: chest auscultation may reveal a cardiac murmur; blood cultures and inflammatory markers (CRP, ESR) may be positive; treatment decisions rely on echocardiography and microbiology. Imaging modality: clinical photography using a digital camera; technique: macro/close-up; lighting: natural or diffused; magnification: not specified. Anatomical location: distal phalanx of the index finger, fingertip pad; laterality: not specified; anatomical plane: lateral/volar aspect. Use cases: bedside assessment, educational dermatology and internal medicine, documentation of endocarditis signs.
ARVC arrhythmogenic right ventricular cardiomyopathy epsilon wave ECG T wave inversion
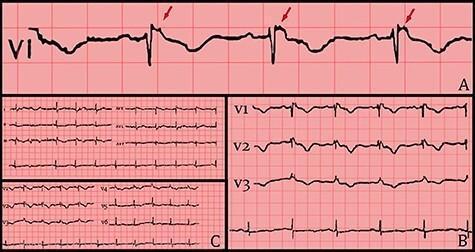
This diagnostic image contains three panels of electrocardiogram (ECG) tracings illustrating the electrical manifestations of Arrhythmogenic Right Ventricular Cardiomyopathy (ARVC). Panel A provides a high-magnification view of lead V1, where red arrows indicate the hallmark Epsilon wave—a low-amplitude notch or 'blip' occurring at the end of the QRS complex and the start of the ST segment. Panel B displays precordial leads V1 through V3, demonstrating a right bundle branch block (RBBB) morphology characterized by widened QRS complexes and persistent T-wave inversions. Panel C presents a standard 12-lead ECG overview following hemodynamic stabilization. The collection emphasizes key diagnostic criteria including repolarization abnormalities (T-wave inversion in V1-V3) and depolarization abnormalities (Epsilon waves). These visual findings are critical for medical students and clinicians in identifying structural right ventricular disease and assessing sudden cardiac death risk.
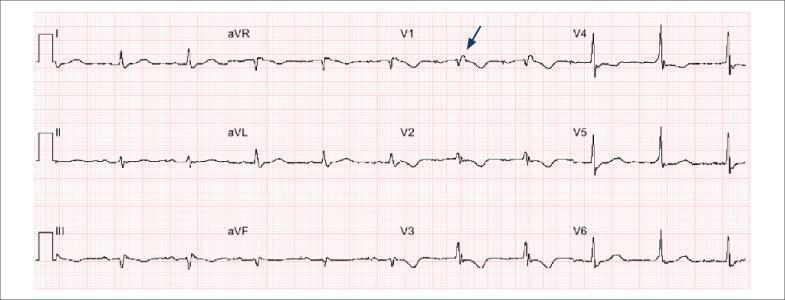
This diagnostic image is a 12-lead electrocardiogram (ECG) demonstrating key diagnostic features of Arrhythmogenic Right Ventricular Cardiomyopathy (ARVC). The tracing shows a normal sinus rhythm with low voltage in the frontal plane leads (I, II, III, aVR, aVL, aVF). A pathognomonic 'epsilon wave' is identified by a blue arrow in lead V1, appearing as a small, low-amplitude notch or positive deflection at the end of the QRS complex and the beginning of the ST segment. Significant repolarization abnormalities are present, specifically deep T-wave inversions across the right precordial leads (V1, V2, and V3). These findings, particularly the combination of terminal notch depolarization (epsilon wave) and precordial T-wave inversion, serve as major diagnostic criteria for ARVC. The educational focus of the image is to illustrate ECG manifestations of right ventricular disease and structural heart conditions associated with sudden cardiac arrest.
mitral stenosis opening snap mid-diastolic murmur malar flush
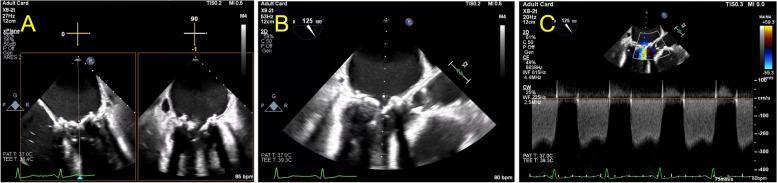
This composite of transesophageal echocardiography (TEE) images illustrates a degenerated bioprosthetic mitral valve presenting with severe stenosis. Panel A displays a biplane view at 0 and 90 degrees (mid-esophageal 4-chamber view), showing significantly thickened and calcified prosthetic leaflets with restricted diastolic motion and a reduced valve orifice. Panel B provides a long-axis view at 125 degrees during end-diastole, further confirming the structural degeneration and restricted opening of the bioprosthesis. Panel C features a continuous wave (CW) Doppler spectral tracing through the mitral valve in the long-axis view. The Doppler envelope is dense with a slow decay of the E-wave (prolonged pressure half-time), indicating severe obstruction. Quantitative assessment shows a peak velocity of approximately 2.5 m/s, consistent with a high transvalvular gradient. The image is a critical educational tool for identifying structural valve deterioration (SVD) in prosthetic mitral valves and utilizing spectral Doppler for hemodynamic quantification of mitral stenosis.
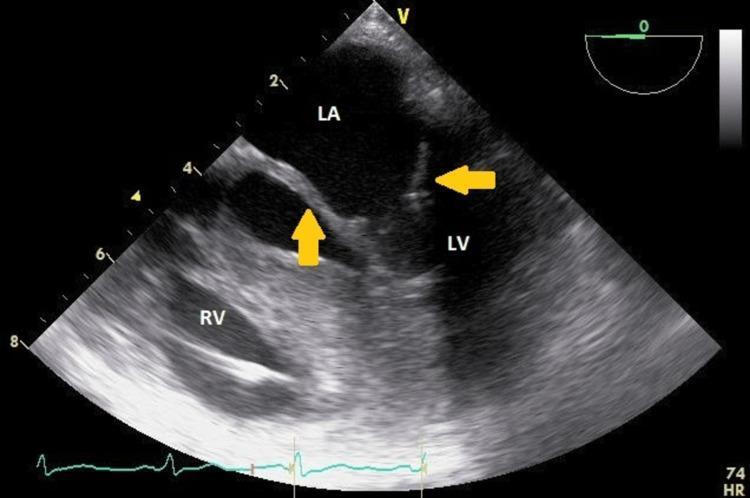
Diagnostic Image: This is a transesophageal echocardiogram (TEE) in a modified mid-esophageal 5-chamber view, demonstrating significant valvular pathology. Anatomical landmarks include the left atrium (LA), left ventricle (LV), and right ventricle (RV). The focus is on the mitral valve, where yellow arrows highlight severely thickened mitral valve leaflets. The leaflets exhibit increased echogenicity and a dense, infiltrated appearance, characteristic of glycosaminoglycan (GAG) deposition. Functionally, the image captures a diastolic frame showing restricted opening and characteristic 'doming' of the mitral leaflets, indicative of moderate mitral stenosis. This visual evidence supports a diagnosis of valvular infiltration, commonly seen in metabolic storage disorders such as mucopolysaccharidosis. The image is a critical educational tool for identifying non-calcific valvular thickening and restricted diastolic excursion in echocardiography.
You are an expert HKMLE tutor helping me ACE the Hong Kong Medical Licensing Examination (Papers 1 and 2). Create a high-yield, comprehensive, beginner-friendly study note for the topic below. You are FULLY AUTHORISED to add any sections, mnemonics, tables, diagrams (text-based), clinical pearls, trap warnings, red flags, drug interactions, trial data, comparisons, flowcharts, quick summaries, or anything else you think will help me ACE this exam. --- DIAGRAM REQUIREMENTS --- If you can generate actual images/diagrams, include them. If not, use clear written descriptions instead of text-based ASCII diagrams. --- REQUIREMENTS --- For each major condition, include: - Definition - Classification (with table where helpful) - Aetiology / Causes (with a BOLD mnemonic) - Pathophysiology (step-by-step, beginner-friendly) - Risk factors (with mnemonic) - Symptoms (with mnemonic) - Signs (with mnemonic) - Investigations (with mnemonic). Provide a prioritised diagnostic algorithm (Bedside → Labs → Imaging). - Management (acute and chronic, with mnemonics for treatment steps). Differentiate standard international guidelines from local Hong Kong Hospital Authority (HA) protocols and Centre for Health Protection (CHP) recommendations. Break down emergency steps into explicit verbal orders. - Complications (with mnemonic where possible) - Prognosis (with mnemonic where possible) --- ADD THESE ELEMENTS THROUGHOUT --- - ⚠️ HKMLE TRAP boxes (Highlight where standard US/UK textbook answers will cause me to lose marks on Paper 1 & 2) - 🏢 HA CLINICAL PATHWAY boxes (Specify default drug formulations, staging systems, or referral pathways used in HK public hospitals) - 📋 CHP STATUTORY NOTIFICATION boxes (Explicitly flag if the condition is a statutory notifiable infectious disease in HK) - 🌏 LOCAL EPIDEMIOLOGY VARIANT boxes (Highlight high-prevalence local variations, e.g., Klebsiella liver abscesses, Recurrent Pyogenic Cholangitis, local Thalassemia/G6PD patterns) - 📋 INVESTIGATION INTERPRETATION boxes (Provide a classic raw data result example—e.g., ABG, CSF, ECG—and its 1-sentence interpretation) - ⚖️ LEGAL & ETHICAL ORDINANCE boxes (Flag relevant local legislation, e.g., Cap. 136 Mental Health Ordinance or mandatory reporting rules) - 📌 QUICK SUMMARY boxes - 🚨 RED FLAGS box - ❓ COMMON EXAM QUESTION box - 🔬 BASIC SCIENCE INTEGRATION box --- REQUIRED TABLES AT THE END --- - ⚠️ DRUG TRAPS table - 📊 NOTABLE TRIALS table - 🧠 MASTER MNEMONICS table - 🔗 CROSS-MODULE LINKS --- TOPIC --- Module 1D: Valvular + Pericardial + Cardiomyopathies + Infective Endocarditis Valvular Heart Disease: - Aortic stenosis (AS) — causes (bicuspid, calcific, rheumatic), pathophysiology, symptoms (SAD), signs (slow-rising pulse, narrow pulse pressure, ejection systolic murmur), investigations (Echo, catheterisation), management (TAVI vs SAVR), indications for surgery. - Aortic regurgitation (AR) — causes (rheumatic, bicuspid, endocarditis, aortic dissection, Marfan), pathophysiology, symptoms, signs (wide pulse pressure, collapsing pulse, early diastolic murmur), management (surgical indications). - Mitral stenosis (MS) — causes (rheumatic — most common), pathophysiology, symptoms (dyspnoea, haemoptysis, hoarseness), signs (malar flush, tapping apex, opening snap, mid-diastolic murmur), management (valvotomy, replacement). - Mitral regurgitation (MR) — causes (rheumatic, myxomatous, ischaemic), pathophysiology (acute vs chronic), symptoms, signs (pansystolic murmur at apex radiating to axilla), management (surgical indications). - Rheumatic heart disease — Jones criteria, prophylaxis (secondary penicillin), HK relevance. Generate the complete ace-level note now.
"valvular heart disease" AND guideline
aortic stenosis slow rising pulse ejection systolic murmur echocardiogram
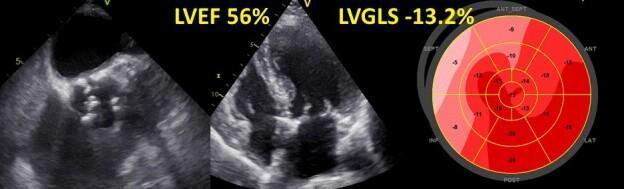
This composite diagnostic image features three panels representing a multimodal echocardiographic assessment of a patient with severe aortic stenosis. The left panel shows a grayscale 2D echocardiogram focusing on the aortic valve, demonstrating significant calcification and structural thickening. The central panel is an apical four-chamber view of the heart with an annotated Left Ventricular Ejection Fraction (LVEF) of 56%, indicating preserved systolic function. The right panel is a color-coded 'bullseye' polar plot illustrating speckle-tracking strain analysis. This plot maps regional longitudinal strain across segments of the left ventricle, including anterior (ANT), septal (SEPT), lateral (LAT), and posterior (POST) walls. A numerical value of -13.2% for Left Ventricular Global Longitudinal Strain (LVGLS) is displayed above the plot. The varying shades of red in the bullseye segments represent localized strain impairment, highlighting the clinical concept that global longitudinal strain can be significantly reduced even when the ejection fraction remains within normal limits. This visual is intended for cardiology and radiology education focusing on hemodynamic assessment and valvular heart disease.
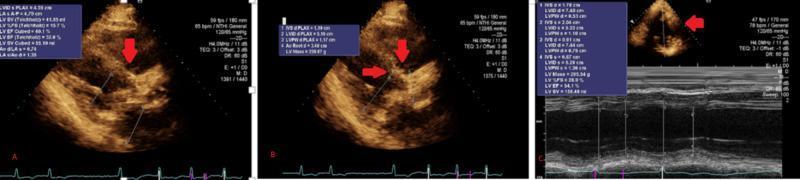
This diagnostic image set consists of three transthoracic echocardiogram panels (A, B, and C) evaluating severe aortic stenosis in a 79-year-old male. Panels A and B demonstrate the parasternal long-axis (PLAX) view, with red arrows highlighting thickened, calcified aortic valve leaflets. These leaflets exhibit significantly reduced mobility and minimal systolic excursion, characteristic of valvular stenosis. Overlaid measurement boxes provide quantitative data, including left ventricular internal diameter in diastole (LVIDd) of approximately 5.4 cm and a preserved ejection fraction (EF) around 54-60%. Panel C presents an M-mode echocardiogram across the left ventricle, illustrating wall thickness and chamber dimensions, with a calculated LV mass of 295.54 g suggesting compensatory hypertrophy. The M-mode also captures the narrow aortic valve orifice. Key anatomical structures visible include the left atrium, left ventricle, and aortic root. This visual content is essential for understanding the diagnostic criteria for severe aortic stenosis, emphasizing both structural leaflet morphology and hemodynamic impact on ventricular function.
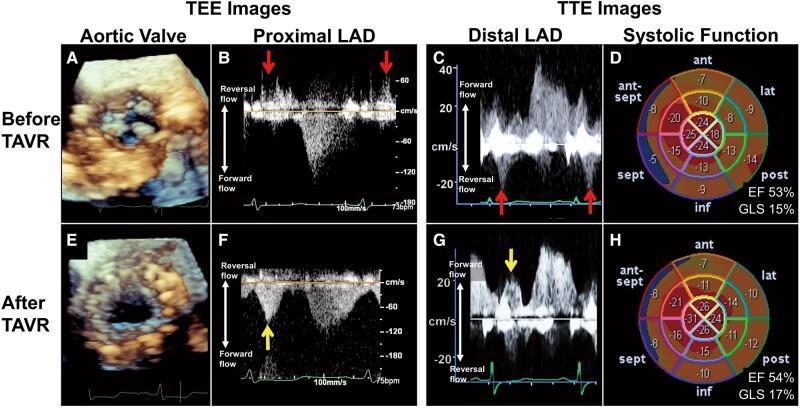
A comparison panel of diagnostic images illustrating hemodynamic and structural changes before and after Transcatheter Aortic Valve Replacement (TAVR) for severe aortic stenosis. The top row (Before TAVR) includes: (A) a 3D transesophageal echocardiogram (TEE) showing restricted aortic cusp motion; (B-C) pulse-wave Doppler scans of the proximal and distal left anterior descending (LAD) coronary artery demonstrating systolic flow reversal (indicated by red arrows); and (D) a transthoracic echocardiography (TTE) bull's-eye plot of global longitudinal strain (GLS 15%) and ejection fraction (EF 53%). The bottom row (After TAVR) shows: (E) relief of stenosis following implantation of a self-expandable valve; (F-G) Doppler scans showing the conversion of systolic LAD flow from reversal to forward flow (indicated by yellow arrows); and (H) post-procedural improvement in myocardial mechanics with GLS increased to 17%. The composite demonstrates the resolution of coronary flow abnormalities and improvement in left ventricular strain following successful TAVR.
aortic regurgitation signs collapsing pulse wide pulse pressure echocardiogram
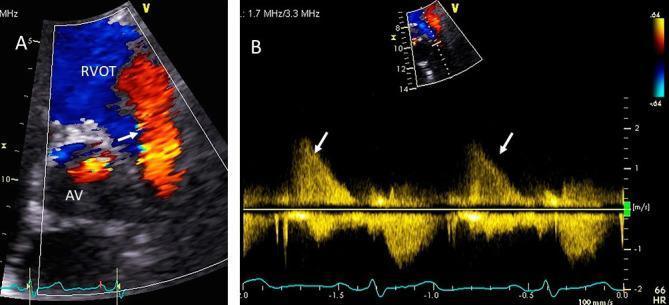
Transthoracic echocardiogram (TTE) demonstrating severe pulmonic regurgitation (PR). Panel A shows a basal short-axis view with color Doppler; the aortic valve (AV) is seen in cross-section, and the pulmonic valve is in long-axis. A wide, predominantly red diastolic regurgitant jet (white arrow) originates at the pulmonic valve and fills greater than 60% of the right ventricular outflow tract (RVOT) width, a key indicator of severity. Panel B displays the corresponding continuous wave (CW) Doppler signal. The PR envelope is characterized by high density and a rapid deceleration (steep slope) of the velocity back to the baseline. The signal terminates prematurely before the onset of the next cardiac cycle, reflecting rapid pressure equalization between the pulmonary artery and the right ventricle in diastole. These findings are diagnostic of hemodynamically significant, severe pulmonic valve regurgitation.
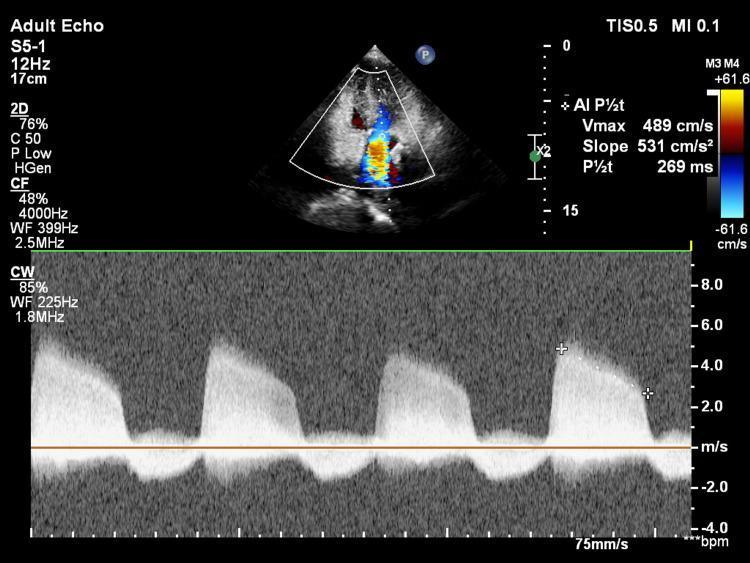
A transthoracic echocardiogram (TTE) image utilizing color Doppler and continuous wave (CW) Doppler to assess aortic regurgitation. The upper panel displays an apical view where color Doppler identifies a high-velocity, mosaic-patterned jet originating from the aortic valve and directed into the left ventricle, indicating significant regurgitant flow. The lower panel shows the corresponding CW spectral Doppler waveform. The waveform exhibits a dense, holodiastolic signal with a peak velocity (Vmax) of 489 cm/s. Quantitative analysis is annotated on the screen, showing a pressure half-time (P½t) of 269 ms and a deceleration slope of 531 cm/s², parameters used to grade the severity of aortic insufficiency. The visual evidence of a well-defined spectral envelope and the calculated P½t are characteristic findings in moderate to severe chronic aortic regurgitation.
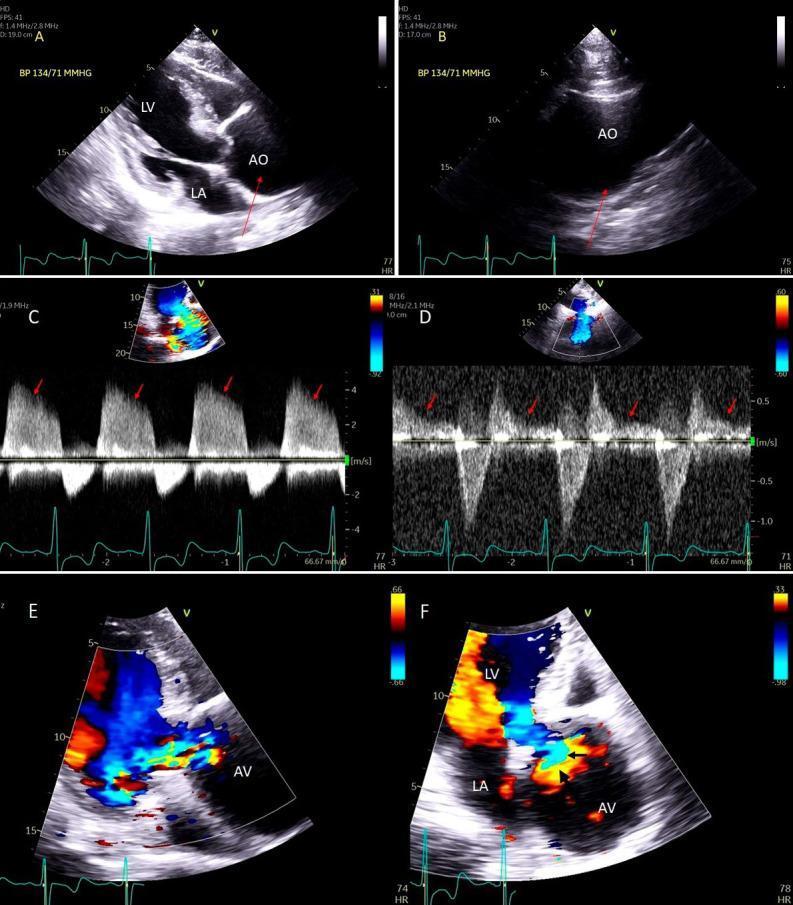
This diagnostic imaging panel consists of six transthoracic echocardiogram (TTE) frames (A-F) illustrating the pathology and hemodynamic assessment of severe aortic regurgitation (AR) caused by aortic root dilation. Frames A and B are 2D parasternal long-axis views demonstrating annulo-aortic ectasia, with markedly dilated and aneurysmal aortic sinuses contrasted against a relatively normal-sized ascending aorta distal to the sinotubular junction. Frame C provides a continuous-wave (CW) Doppler spectral trace showing a dense regurgitant envelope with a steep deceleration slope, indicating rapid pressure equalization and severe AR. Frame D shows CW Doppler at the proximal descending thoracic aorta, revealing holodiastolic (pandiastolic) flow reversal. Frame E is a color Doppler parasternal long-axis view showing a broad regurgitant jet originating from the aortic valve and occupying more than two-thirds of the left ventricular outflow tract (LVOT), with a wide vena contracta visible. Frame F utilizes color Doppler in an apical three-chamber view to demonstrate the flow convergence zone (PISA method) used for quantifying the effective regurgitant orifice area. The collection serves as a comprehensive educational guide for the multi-parametric echocardiographic assessment of valvular incompetence.
rheumatic heart disease mitral stenosis thickened leaflets commissural fusion
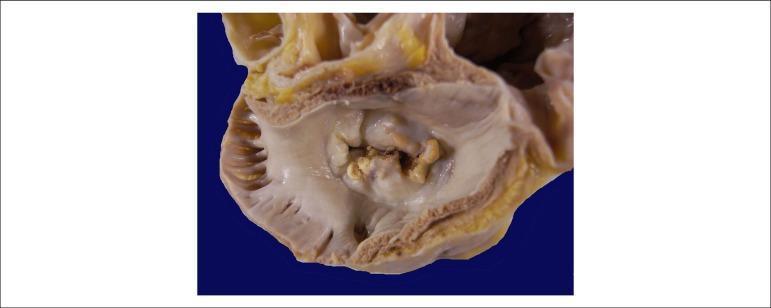
This clinical photograph shows a gross pathological specimen of a human heart, specifically an atrial view of the mitral valve. The image demonstrates hallmark signs of chronic rheumatic heart disease. Key features include significant thickening and fibrosis of the valve leaflets, resulting in a 'fish-mouth' or 'buttonhole' appearance of the valvular orifice. There is evidence of extensive commissural fusion and multiple focal areas of yellowish-white calcification along the leaflet margins and within the valve body. These structural changes characterize severe mitral stenosis, where the restricted opening of the valve impairs blood flow from the left atrium to the left ventricle. The surrounding atrial endocardium appears thickened, consistent with chronic pressure overload. This visual is highly representative for educational purposes in cardiology and pathology to illustrate the long-term sequelae of rheumatic fever on cardiac valves.
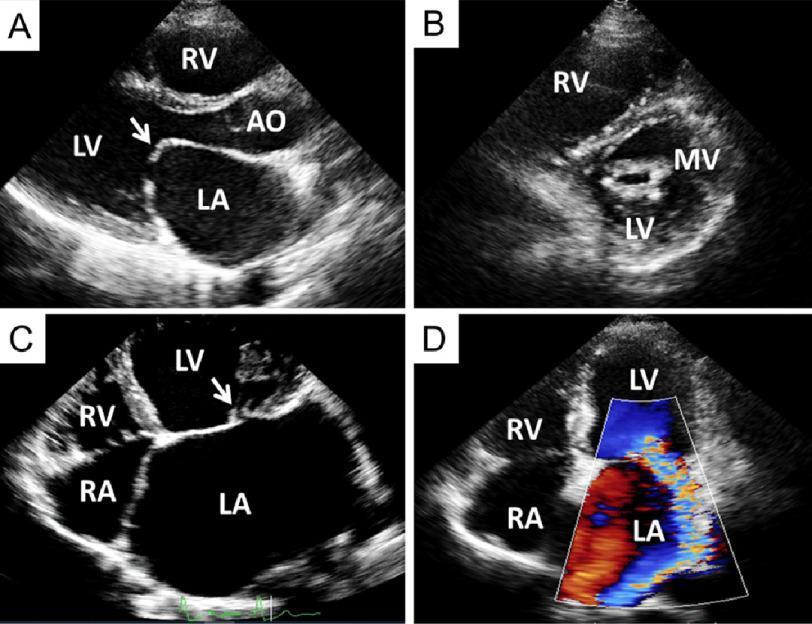
This composite diagnostic image displays four transthoracic echocardiography (TTE) views demonstrating manifestations of rheumatic heart disease on the mitral valve. Panel A (Parasternal Long-Axis View) shows severe mitral stenosis characterized by thickened leaflets and the classic 'hockey stick' deformity of the pliable anterior mitral valve leaflet during diastole (white arrow). Panel B (Parasternal Short-Axis View) highlights the 'fish-mouth' appearance of the mitral valve orifice caused by commissural fusion. Panel C (Apical Four-Chamber View) demonstrates chronic mitral regurgitation with a notable coaptation defect (arrow) and a severely dilated left atrium (LA) relative to the left ventricle (LV). Panel D applies color flow Doppler mapping to the apical four-chamber view, showing a prominent, turbulent regurgitant jet (mosaic color pattern) flowing from the LV back into the LA, confirming severe mitral regurgitation. Anatomical labels include RA (right atrium), RV (right ventricle), and Ao (aorta). This sequence is used for clinical education on valvular assessment, specifically for identifying morphology and hemodynamic severity in rheumatic heart disease.
cardiac murmur timing systolic diastolic auscultation areas diagram
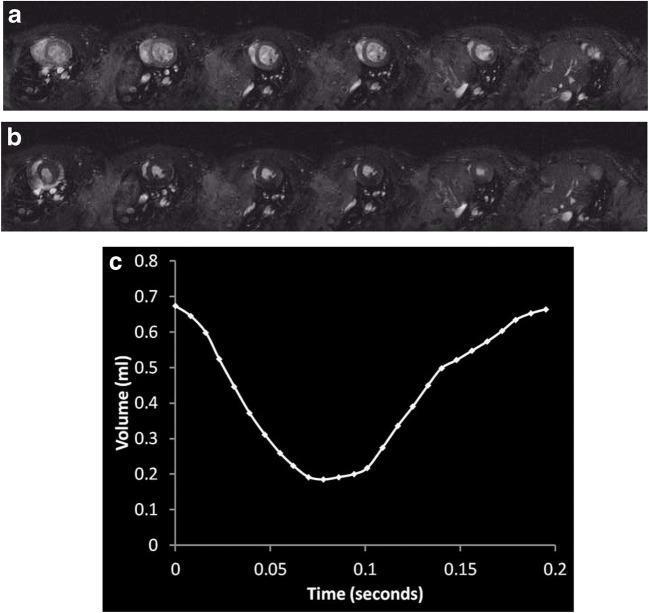
This composite figure illustrates cardiac systolic function assessment using cardiac cine MRI. Panels (a) and (b) present a series of short-axis diagnostic images of the left ventricle (LV) across consecutive anatomical slices. Panel (a) shows the LV at end-diastole, characterized by maximal chamber expansion, bright blood-pool signal, and rounded morphology. Panel (b) shows the same slices at end-systole, demonstrating significant myocardial wall thickening and chamber contraction. Panel (c) is a pathophysiology diagram featuring an LV volume-time curve derived from endocardial segmentation. The Y-axis represents volume in milliliters (ml) and the X-axis represents time in seconds. The curve displays a classic cyclical pattern: starting at peak end-diastolic volume (~0.7 ml), sharply descending during ventricular ejection to a minimum end-systolic volume (~0.2 ml), followed by a progressive rise indicating diastolic filling. This visualization is essential for calculating clinical indices such as stroke volume and ejection fraction in preclinical or clinical cardiovascular research.

This medical schematic illustrates the workflow for dual-phase, 3D Whole-Heart (WH) balanced Steady-State Free Precession (bSSFP) cardiac magnetic resonance imaging (MRI) using image navigator (iNAV) respiratory motion correction. The diagram displays two parallel pathways synchronized with an electrocardiogram (ECG) trace for the systolic and diastolic phases. In the systolic branch (left), the sequence initiates with a systolic image navigator (iNAV_s) and subsequent 3D WH bSSFP acquisition. The initial iNAV serves as a reference (Image A). Subsequent systolic iNAVs (Image E) are registered to the reference using normalized cross-correlation (nCC). This data informs the 'Correction & gating' block, which processes the raw bSSFP data to produce a motion-corrected systolic reconstruction (Image C). The diastolic branch (right) follows a mirrored protocol starting with iNAV_d and 3D WH bSSFP diastole data. Diastolic reference iNAVs (Image B) and subsequent frames (Image F) undergo nCC registration and respiratory gating to generate the final diastolic reconstruction (Image D). The process demonstrates real-time translational motion correction and respiratory gating for high-resolution cardiac morphology imaging.
mkdir -p /tmp/workspace/hkmle-module1d && echo "ready"
Give in simple text form pdf don’t give in python code
~/hkmle-module1d/content.txt
HKMLE COMPLETE STUDY NOTE
MODULE 1D: VALVULAR HEART DISEASE
Papers 1 & 2 — High-Yield, Ace-Level Reference
Date: August 2026

================================================================================
TABLE OF CONTENTS
================================================================================
1. Aortic Stenosis (AS)
2. Aortic Regurgitation (AR)
3. Mitral Stenosis (MS)
4. Mitral Regurgitation (MR)
5. Rheumatic Heart Disease (RHD)
6. Drug Traps Table
7. Notable Trials Table
8. Master Mnemonics Table
9. Cross-Module Links

================================================================================
SECTION 1: AORTIC STENOSIS (AS)
================================================================================

DEFINITION
Aortic stenosis is narrowing of the aortic valve orifice causing obstruction to
left ventricular outflow. Severe AS is defined as: valve area < 1.0 cm2,
mean gradient > 40 mmHg, or peak jet velocity > 4 m/s.

CLASSIFICATION TABLE
-----------------------------------------------------------------------
Type            | Cause                   | Age group
-----------------------------------------------------------------------
Congenital      | Bicuspid aortic valve   | < 60 years (most common
                |                         | cause in younger adults)
Calcific/       | Age-related calcification| > 65 years (most common
Degenerative    | (atherosclerotic process)| overall in HK + West)
Rheumatic       | Commissural fusion      | Any age (developing world)
-----------------------------------------------------------------------

AETIOLOGY — MNEMONIC: "BAD Valves"
B — Bicuspid aortic valve (congenital, 1–2% of population)
A — Age-related calcification (degenerative; most common cause >65 yrs)
D — Disease: Rheumatic heart disease (causes commissural fusion)

PATHOPHYSIOLOGY (Step-by-Step)
Step 1: Valve leaflets narrow → increased resistance to LV outflow
Step 2: LV pressure rises to maintain cardiac output
Step 3: LV responds with CONCENTRIC HYPERTROPHY (wall thickens,
        cavity size stays normal) — this is pressure overload
Step 4: Hypertrophy increases oxygen demand → subendocardial ischaemia
Step 5: Diastolic dysfunction develops (stiff LV)
Step 6: Eventually cardiac output falls → symptoms develop
Step 7: End-stage: LV dilates → systolic dysfunction → heart failure

BEGINNER TIP: AS = PRESSURE overload → THICK (concentric hypertrophy)
             AR/MR = VOLUME overload → BIG (eccentric hypertrophy)

RISK FACTORS — MNEMONIC: "CHARM"
C — Congenital bicuspid valve
H — Hypertension, Hyperlipidaemia
A — Age (>65)
R — Rheumatic fever
M — Male sex

SYMPTOMS — MNEMONIC: "SAD" (classic triad — KNOW THIS!)
S — Syncope (on exertion — late sign, poor prognosis)
A — Angina (subendocardial ischaemia; can occur with normal coronaries)
D — Dyspnoea (exertional → rest → orthopnoea → PND)

PROGNOSIS ONCE SYMPTOMS DEVELOP:
Angina:    mean survival 5 years
Syncope:   mean survival 3 years
Dyspnoea:  mean survival 2 years
(Mnemonic: "ASD 5-3-2")

SIGNS — MNEMONIC: "SPINE of the exam"
S — Slow-rising, plateau pulse (pulsus parvus et tardus)
P — Pulse pressure NARROW (low SBP, normal/high DBP)
I — Impulse: heaving, sustained, non-displaced apex beat
N — Narrow A2 (soft/absent second heart sound)
E — Ejection systolic murmur (ESM): crescendo-decrescendo,
    radiates to carotids, best heard at right 2nd intercostal space
    with patient sitting forward

ADDITIONAL SIGNS:
- Ejection click (in bicuspid valve — disappears as valve calcifies)
- Systolic thrill at aortic area
- S4 gallop (due to stiff LV)
- Signs of heart failure (late)

MURMUR DESCRIPTION: "HERO"
H — Harsh quality
E — Ejection systolic (mid-systolic, crescendo-decrescendo)
R — Radiates to carotids ("jet stream" to neck)
O — Obliterates/softens A2

INVESTIGATIONS — MNEMONIC: "BECAM"
B — Bedside: ECG, BP both arms (rule out coarctation/dissection)
E — Echo (TTE — FIRST-LINE investigation of choice)
C — Catheterisation (gold standard if echo inconclusive or pre-op)
A — AXR/CXR (calcification in valve, post-stenotic aortic dilatation)
M — MRI cardiac (if echo windows poor)

DIAGNOSTIC ALGORITHM:
Bedside: ECG (LVH — voltage criteria, strain pattern in lateral leads)
         CXR (normal heart size in early AS; aortic knuckle prominent)
Labs:    BNP/NT-proBNP (elevated = worse prognosis/haemodynamic stress)
         FBC, U&E, LFTs pre-op
Imaging: TTE — FIRST line. Assess: valve area (AVA), gradient, LVEF
         TOE — if TTE poor quality
         Coronary angiogram — pre-operatively if age >40 or angina
         CT calcium scoring — assess aortic valve calcification burden

INVESTIGATION INTERPRETATION BOX:
Classic Echo report: "AVA 0.7 cm2, peak gradient 72 mmHg,
mean gradient 45 mmHg, LVEF 55%"
Interpretation: Severe aortic stenosis with preserved ejection fraction
(most common presentation requiring valve replacement)

ECG Findings:
- LVH: Sokolow-Lyon criteria (SV1 + RV5/V6 > 35 mm)
- Left axis deviation
- Lateral ST depression + T-wave inversion ("strain pattern")
- LBBB (late sign)

MANAGEMENT

ACUTE DECOMPENSATION (Severe AS + pulmonary oedema):
Step 1: Sit up, O2 15L via non-rebreather mask, IV access x2
Step 2: IV GTN ONLY if SBP > 110 (use with extreme caution — AS
        patients are PRELOAD dependent; vasodilators cause collapse)
Step 3: IV frusemide 40-80 mg for pulmonary oedema
Step 4: Avoid tachycardia (worsens filling) — rate control if AF
Step 5: URGENT referral to cardiology — likely valve intervention needed
Step 6: Balloon aortic valvuloplasty as BRIDGE to definitive therapy

CHRONIC MANAGEMENT:
Medical: No drug slows AS progression. Manage risk factors.
         Statins: NO proven benefit in halting calcification (SALTIRE
         and SEAS trials showed no benefit — EXAM TRAP!)
         ACEi/ARBs: Use with caution; avoid if severe AS + symptoms
         Diuretics: For symptom control only
         Beta-blockers: Avoid in severe symptomatic AS (drop HR,
         reduce CO)

Definitive Treatment — VALVE REPLACEMENT:

SURGICAL AORTIC VALVE REPLACEMENT (SAVR):
- Gold standard for low–intermediate surgical risk patients
- Preferred if age < 65 years (longevity of mechanical valve)
- Mechanical valve: needs lifelong warfarin (INR 2.5–3.5)
- Bioprosthetic valve: no anticoagulation needed, but lasts 10–15 yrs

TRANSCATHETER AORTIC VALVE IMPLANTATION (TAVI/TAVR):
- Preferred for high/prohibitive surgical risk or age > 75–80
- Via femoral artery (transfemoral — first choice) or transapical route
- Post-TAVI: dual antiplatelet (aspirin + clopidogrel) x 3–6 months,
  then aspirin alone
- Complications: stroke, vascular access complications, paravalvular
  leak, need for pacemaker (LBBB/complete heart block common)

INDICATIONS FOR INTERVENTION (ACC/AHA 2020 + ESC/EACTS 2021):
Class I (recommended):
- Symptomatic severe AS (any of SAD triad)
- Severe AS + LVEF < 50% (even if asymptomatic)
- Severe AS undergoing other cardiac surgery

Class IIa (reasonable):
- Asymptomatic severe AS + abnormal exercise test
- Asymptomatic very severe AS (Vmax > 5 m/s) at low surgical risk
- Asymptomatic severe AS + rapidly progressive disease
- BNP > 3x upper limit of normal

HA CLINICAL PATHWAY BOX:
In Hong Kong HA hospitals:
- TTE is first-line imaging for all suspected AS
- Heart team (cardiologist + cardiac surgeon) review ALL cases of
  severe AS before intervention
- TAVI programme available at QMH, PWH, and PYNEH
- Patients > 75 with high STS score referred for TAVI assessment
- Post-TAVI patients followed up at 30 days, 3 months, 1 year

HKMLE TRAP BOX 1:
Statins do NOT slow AS progression. If a question asks "which drug
slows the progression of aortic stenosis?" — the answer is NONE.
SALTIRE and SEAS trials both showed no benefit of statins.

HKMLE TRAP BOX 2:
Balloon aortic valvuloplasty is NOT a definitive treatment for
calcific AS in adults. It is only a bridge to definitive therapy or
palliation. In children with congenital AS, valvuloplasty IS
appropriate as first-line — do NOT confuse.

HKMLE TRAP BOX 3:
Nitrates and vasodilators are DANGEROUS in AS (reduced preload
causes catastrophic fall in BP). The question stem may describe a
patient with AS given sublingual GTN for "chest pain" — recognise
the trap.

COMPLICATIONS — MNEMONIC: "SAFE"
S — Syncope, Sudden cardiac death
A — Angina
F — Failure (heart failure, pulmonary oedema)
E — Endocarditis (bicuspid valves are especially at risk)
     Emboli (calcific emboli → stroke/TIA)

RED FLAGS:
- Syncope on exertion → surgery within weeks, not months
- LVEF < 50% → urgent surgery
- Rapid symptom onset in known AS → emergency review
- New LBBB in AS patient → possible complete heart block

COMMON EXAM QUESTION BOX:
Q: A 72-year-old man has exertional chest pain, dyspnoea and
syncopal episodes. Examination reveals a slow-rising pulse,
narrow pulse pressure, and an ejection systolic murmur radiating
to the carotids. What is the single most useful investigation?
A: Transthoracic echocardiography (TTE)

Q: What is the murmur of aortic stenosis?
A: Ejection systolic (crescendo-decrescendo), loudest at right
second intercostal space, radiates to carotids.

BASIC SCIENCE INTEGRATION BOX:
The Frank-Starling mechanism maintains CO initially in AS.
Concentric LVH reduces wall stress (by Laplace's Law: stress =
pressure x radius / 2 x wall thickness). As wall thickness
increases, the denominator rises and wall stress is normalised.
However, the hypertrophied myocardium has impaired diastolic
relaxation and is more susceptible to subendocardial ischaemia
due to increased oxygen demand + reduced coronary perfusion
in diastole (high LVEDP compresses subendocardial vessels).

================================================================================
SECTION 2: AORTIC REGURGITATION (AR)
================================================================================

DEFINITION
Aortic regurgitation (incompetence) is the backflow of blood from the
aorta into the LV during diastole, due to failure of aortic valve leaflets
to coapt completely.

CLASSIFICATION:
-----------------------------------------------------------------------
Acute AR                    | Chronic AR
-----------------------------------------------------------------------
Sudden valve failure        | Gradual volume overload
LV cannot compensate        | LV dilates and hypertrophies
Pulmonary oedema common     | Long asymptomatic period
Emergency surgery needed    | Surgery when LV decompensates
-----------------------------------------------------------------------

AETIOLOGY — MNEMONIC: "MARBLE"
M — Marfan syndrome (aortic root dilatation)
A — Aortic dissection (Type A — acute AR emergency)
R — Rheumatic heart disease (leaflet fusion/scarring)
B — Bicuspid aortic valve
L — Lues (syphilis — aortitis, old but classic exam answer)
E — Endocarditis (leaflet destruction)

Also: Ankylosing spondylitis, reactive arthritis (HLA-B27 diseases)

PATHOPHYSIOLOGY (Step-by-Step)

CHRONIC AR:
Step 1: Blood regurgitates back into LV in diastole
Step 2: LV receives extra volume load (regurgitant + normal filling)
Step 3: LV responds with ECCENTRIC HYPERTROPHY (cavity dilates,
        walls also thicken) — VOLUME overload
Step 4: LV compensates: increased total stroke volume maintains
        forward cardiac output
Step 5: Aortic diastolic pressure falls → wide pulse pressure
Step 6: Eventually LV cannot compensate → LVEF falls → HF symptoms

ACUTE AR:
Step 1: Sudden regurgitation into a NORMAL-SIZED LV
Step 2: LV cannot acutely dilate → LVEDP rises dramatically
Step 3: Mitral valve closes early (high LVEDP)
Step 4: Pulmonary oedema and cardiogenic shock develop rapidly
Step 5: EMERGENCY — immediate surgery required

SYMPTOMS:
Chronic (often asymptomatic for years):
- Exertional dyspnoea (most common presenting symptom)
- Orthopnoea, PND
- Palpitations (bounding, forceful heartbeat)
- Exertional angina (despite usually normal coronaries)

Acute:
- Sudden-onset severe dyspnoea/pulmonary oedema
- Hypotension, shock
- Fever (if endocarditis is cause)

SIGNS — MNEMONIC: "WWW CEDRA" (for the eponymous signs)
Pulse Signs:
W — Water-hammer (Corrigan's) pulse: bounding, collapsing
W — Wide pulse pressure (e.g. 160/40 — SBP high, DBP very low)
W — Wandering — visible carotid pulsations (Corrigan's neck sign)

Eponymous Signs (high-yield for MCQ):
C — Corrigan's: visible pulsation in neck/carotid
E — de Musset's: head nodding with each heartbeat
D — Duroziez's: systolic + diastolic murmurs over femoral artery
    with compression
R — Rosenbach's: liver pulsation
A — Austin Flint murmur: mid-diastolic murmur at apex (regurgitant
    jet pushes against anterior mitral leaflet, simulating MS)
    Quincke's: capillary pulsation in nail beds

Cardiac Examination:
- Apex beat: displaced laterally and inferiorly (dilated LV)
- Apex character: THRUSTING/HYPERDYNAMIC (volume overload)
- Murmur: EARLY DIASTOLIC, high-pitched, blowing, decrescendo,
  best heard at left sternal edge (3rd-4th ICS), with patient
  sitting forward and breath held in expiration
- Soft S1 (early mitral valve closure)
- S3 gallop (volume overload, dilated LV)

INVESTIGATIONS — MNEMONIC: "CLUE"
C — CXR (cardiomegaly, aortic root dilatation, pulmonary oedema)
L — LV function on Echo (most important investigation)
U — Ultrasound (TTE/TOE) — grade severity, assess root
E — ECG (LVH, left axis deviation)

Specific Echo findings:
- Dilated LV (LVIDd > 70 mm = severe dilatation)
- Fluttering of anterior mitral leaflet (Austin Flint mechanism)
- Holodiastolic flow reversal in descending aorta
- Colour Doppler: regurgitant jet width/LVOT ratio grades severity

MANAGEMENT

ACUTE AR (Emergency):
Step 1: Resuscitate — O2, IV access, monitor
Step 2: IV vasodilators (sodium nitroprusside) + inotropes if shocked
Step 3: Do NOT use intra-aortic balloon pump (IABP inflates in
        diastole — CONTRAINDICATED in AR as it WORSENS regurgitation)
Step 4: URGENT cardiac surgery (emergency AVR)
Step 5: If infective endocarditis: start antibiotics first, then surgery

CHRONIC AR (Medical):
- Vasodilators (ACEi, amlodipine) if LVEF impaired or hypertension
- Beta-blockers for Marfan syndrome (reduce aortic root expansion)
- Serial Echo monitoring: every 1–2 years (mild-moderate),
  6–12 months (severe asymptomatic)

INDICATIONS FOR SURGERY (ACC/AHA 2020):
Class I:
- Symptomatic severe AR
- Severe AR + LVEF < 55%
- Severe AR undergoing other cardiac surgery

Class IIa:
- Asymptomatic severe AR + LVEF 55–60% (progressive LV dilatation)
- Asymptomatic + LVIDd > 65 mm (or > 50 mm/m2 BSA)
- Aortic root > 55 mm (Marfan: > 50 mm; bicuspid: > 55 mm)

Type of surgery:
- Valve repair (if anatomy suitable) or replacement
- Bentall procedure: composite valve + root replacement (if root disease)

HKMLE TRAP BOX:
IABP is CONTRAINDICATED in AR. It is also contraindicated in
aortic dissection and severe aortic regurgitation. Do not confuse
with cardiogenic shock from other causes where IABP may help.

HKMLE TRAP BOX 2:
The Austin Flint murmur of AR mimics mitral stenosis (both are
mid-diastolic murmurs at the apex). Differentiating features:
- Austin Flint: NO opening snap, WIDE pulse pressure, collapsing
  pulse, early diastolic murmur also present
- True MS: opening snap present, narrow pulse pressure,
  slow-rising pulse (not collapsing)

COMPLICATIONS — MNEMONIC: "FHE"
F — Failure (LV systolic dysfunction, heart failure)
H — Heart block, infective endocarditis
E — Emboli, aortic root complications (Marfan aneurysm rupture)

COMMON EXAM QUESTION BOX:
Q: A young man with tall stature, long arms, pectus excavatum and
arachnodactyly presents with an early diastolic murmur. What is
the diagnosis and most appropriate next investigation?
A: Marfan syndrome with aortic regurgitation.
Investigation: TTE (Echo) to assess aortic root diameter and AR severity.

Q: Which peripheral sign of AR involves head nodding?
A: de Musset's sign

================================================================================
SECTION 3: MITRAL STENOSIS (MS)
================================================================================

DEFINITION
Mitral stenosis is narrowing of the mitral valve orifice, obstructing
diastolic flow from the left atrium to the left ventricle.
Normal mitral valve area (MVA): 4–6 cm2
Mild MS: MVA > 1.5 cm2
Moderate MS: MVA 1.0–1.5 cm2
Severe MS: MVA < 1.0 cm2 (or mean gradient > 10 mmHg)

CLASSIFICATION:
-----------------------------------------------------------------------
Severity    | MVA (cm2) | Mean Gradient | PHT (ms)
-----------------------------------------------------------------------
Mild        | > 1.5     | < 5 mmHg      | < 100
Moderate    | 1.0–1.5   | 5–10 mmHg     | 100–150
Severe      | < 1.0     | > 10 mmHg     | > 150
-----------------------------------------------------------------------

AETIOLOGY — MNEMONIC: "RACE"
R — Rheumatic heart disease (most common cause — 99% in HK/Asia)
A — Age-related calcification (rare, elderly)
C — Congenital (rare, parachute mitral valve)
E — Endocarditis (rare cause of MS)

LOCAL EPIDEMIOLOGY VARIANT BOX:
In Hong Kong, rheumatic heart disease remains the dominant cause
of mitral stenosis. While prevalence has declined with improved
living standards and antibiotic access, MS is STILL significantly
more common in Hong Kong and Asia compared to Western Europe/USA.
Many patients presenting with MS in HK are immigrants from mainland
China, South/Southeast Asia where rheumatic fever remains endemic.
This is a HIGH-YIELD HK-specific fact for your exam.

PATHOPHYSIOLOGY (Step-by-Step)
Step 1: Rheumatic fever → immune-mediated inflammation of mitral leaflets
Step 2: Leaflet thickening, commissural fusion, chordal shortening/fusion
Step 3: Mitral orifice narrows → obstruction to LV filling
Step 4: Left atrial pressure rises → left atrial dilatation
Step 5: Raised LA pressure → pulmonary venous hypertension →
        pulmonary oedema (dyspnoea, orthopnoea)
Step 6: Pulmonary arterial hypertension develops (reactive vasoconstriction)
Step 7: Right heart failure (RVH, tricuspid regurgitation)
Step 8: Left atrial dilatation → atrial fibrillation → thrombus → stroke
Step 9: LV is PROTECTED (MVA limits filling) — LV is actually SMALL
        and may have NORMAL or LOW function

SYMPTOMS — MNEMONIC: "DOHH"
D — Dyspnoea (exertional → rest; hallmark symptom)
O — Orthopnoea and PND (raised PAWP)
H — Haemoptysis (from pulmonary venous hypertension — pink frothy
    sputum or frank haemoptysis from bronchial vein rupture)
H — Hoarseness (Ortner's syndrome: enlarged LA compresses left
    recurrent laryngeal nerve)

Also: Palpitations (AF), systemic emboli/stroke (from LA thrombus),
right heart failure symptoms (oedema, ascites)

BEGINNER TIP on Ortner's Syndrome:
The LEFT recurrent laryngeal nerve hooks under the aortic arch.
An enlarged left atrium can compress this nerve causing hoarseness.
This is PATHOGNOMONIC of severe mitral stenosis in exams.

SIGNS — MNEMONIC: "MOST" + extras
M — Malar flush (mitral facies — bilateral bluish-red patches on cheeks
    due to low CO and peripheral vasoconstriction)
O — Opening snap (OS) — high-pitched early diastolic sound after S2;
    reflects valve opening; shorter S2-OS interval = more severe MS
S — Signs of AF (irregularly irregular pulse)
T — Tapping apex beat (non-displaced; palpable S1 due to stiff, loud MV)

Also:
- Mid-diastolic murmur at the apex: LOW-PITCHED, rumbling, best
  heard with patient in left lateral decubitus position, with the
  bell of the stethoscope; may have PRESYSTOLIC ACCENTUATION
  (if in sinus rhythm, due to atrial contraction)
- LOUD S1 (due to wide-open leaflets being shut forcefully)
- Parasternal heave (RV hypertrophy)
- Elevated JVP (pulmonary hypertension/RV failure)
- Signs of right heart failure

MURMUR DETAILS:
Position: Apex (left lateral decubitus)
Character: Low-pitched, rumbling
Timing: Mid-diastolic (after opening snap)
Accentuation: Presystolic accentuation (if sinus rhythm — lost in AF)
Bell > Diaphragm (low frequency)
Increases with: Exercise, left lateral position, expiration

INVESTIGATIONS — MNEMONIC: "ECCL"
E — ECG (P mitrale — bifid P waves; RVH if pulm HT; AF)
C — CXR (see below)
C — Colour Doppler TTE (diagnostic, grades severity by MVA and PHT)
L — Left heart catheterisation (if echo inconclusive or pre-procedure)

CXR Findings:
- Straightening of left heart border (enlarged LA appendage)
- Double density right heart border (enlarged LA behind RA)
- Splaying of carina (enlarged LA pushes up left main bronchus)
- Pulmonary oedema features (Kerley B lines, upper lobe diversion)
- Calcification of mitral valve (in chronic disease)

INVESTIGATION INTERPRETATION BOX:
Echo: "MVA 0.9 cm2 by PHT (220 ms), mean gradient 12 mmHg,
moderate-severe pulmonary hypertension with RVSP 55 mmHg,
LA diameter 55 mm"
Interpretation: Severe rheumatic mitral stenosis with pulmonary
hypertension and left atrial dilatation — indication for intervention.

MANAGEMENT

ACUTE DECOMPENSATION (MS + AF with fast ventricular rate):
Step 1: O2, monitoring, IV access
Step 2: Rate control FIRST: IV metoprolol 2.5–5 mg or IV digoxin
        (rate control slows heart → more time for LV filling)
Step 3: IV frusemide if pulmonary oedema
Step 4: Anticoagulate if AF (high stroke risk) — heparin then warfarin
Step 5: Consider electrical cardioversion if haemodynamically unstable

CHRONIC MANAGEMENT:

Rate control in AF:
- Beta-blockers (metoprolol) — first choice
- Rate-limiting calcium channel blockers (verapamil, diltiazem)
- Digoxin (third line or addition)

Anticoagulation:
- Warfarin (target INR 2–3) for AF or prior emboli
- NOACs (direct oral anticoagulants) are NOT recommended in
  rheumatic MS (valvular AF) — WARFARIN remains the standard
  (HKMLE TRAP: NOACs are for non-valvular AF only!)

Beta-blockers: Reduce exertional symptoms by reducing heart rate

Intervention (definitive):
PERCUTANEOUS MITRAL BALLOON COMMISSUROTOMY (PMBC/PBMV):
- Preferred if:
  * Pliable, non-calcified valve (Wilkins score < 8)
  * No significant MR
  * No LA thrombus (TOE to exclude)
  * No severe subvalvular disease
- Technique: Balloon inflated across stenotic mitral valve via
  transseptal approach
- Excellent results: MVA doubles, symptoms improve dramatically

MITRAL VALVE REPLACEMENT:
- If valve unsuitable for PBMV (calcified, heavily fused, MR present)
- Mechanical valve preferred in young patients with AF
  (already need anticoagulation)
- Bioprosthetic if anticoagulation contraindicated

HA CLINICAL PATHWAY BOX:
In HK HA hospitals:
- All new MS referred to cardiologist for TTE assessment
- TOE mandatory before PBMV to exclude LA thrombus
- Wilkins echocardiographic score used to select PBMV candidates
- Anti-rheumatic prophylaxis (penicillin) continued per guidelines
- Warfarin (NOT NOACs) for AF + MS

HKMLE TRAP BOX 1:
NOACs (rivaroxaban, apixaban, dabigatran) are CONTRAINDICATED
in rheumatic (valvular) AF with mitral stenosis. This has been
specifically studied — ENGAGE AF-TIMI 48, RE-LY, ROCKET-AF all
excluded valvular AF. Use WARFARIN for rheumatic MS with AF.

HKMLE TRAP BOX 2:
The presystolic accentuation of the MS murmur DISAPPEARS when
AF develops (because there is no atrial contraction in AF).
This is a classic exam distinction.

HKMLE TRAP BOX 3:
The opening snap (OS) of MS: shorter S2-OS interval = MORE severe
(higher LA pressure closes valve more rapidly, OS comes earlier).
Do NOT confuse: "closer = more severe."

COMPLICATIONS — MNEMONIC: "SAFE PAH"
S — Stroke (LA thrombus → embolism, most common in AF)
A — AF (most common arrhythmia)
F — Failure (pulmonary oedema, right heart failure)
E — Embolism (systemic)
P — Pulmonary Arterial Hypertension
A — Aortic/laryngeal compression (Ortner's)
H — Haemoptysis

================================================================================
SECTION 4: MITRAL REGURGITATION (MR)
================================================================================

DEFINITION
Mitral regurgitation is backward flow of blood from the LV into the LA
during systole due to failure of mitral valve leaflet coaptation.

CLASSIFICATION TABLE:
-----------------------------------------------------------------------
Type        | Mechanism       | Causes
-----------------------------------------------------------------------
Primary (   | Leaflet/chordal | Myxomatous degeneration (MVP),
organic)    | abnormality     | rheumatic, endocarditis, radiation
Secondary   | Annular/LV      | Ischaemic MR, dilated CMP, HFrEF
(functional)| remodelling     | (any cause of LV dilatation)
Acute MR    | Sudden rupture  | Papillary muscle rupture (post-MI),
            |                 | chordal rupture, endocarditis
-----------------------------------------------------------------------

AETIOLOGY — MNEMONIC: "PRIME"
P — Prolapse (mitral valve prolapse/myxomatous — most common in West)
R — Rheumatic heart disease (most common in HK/Asia)
I — Ischaemic (papillary muscle dysfunction or rupture post-MI)
M — Myxomatous degeneration (Marfan, connective tissue disease)
E — Endocarditis (leaflet destruction)

LOCAL EPIDEMIOLOGY VARIANT BOX:
In HK, rheumatic MR remains more prevalent than in the West, where
myxomatous/mitral valve prolapse is the predominant cause. When the
exam scenario involves a young Asian patient — rheumatic is more likely.
When scenario involves older Western patient — MVP more likely.

PATHOPHYSIOLOGY

CHRONIC MR (Step-by-Step):
Step 1: Mitral valve incompetent → blood regurgitates into LA in systole
Step 2: LA receives extra volume → LA pressure rises → LA dilates
Step 3: LV empties into low-resistance LA → initially LV feels "unloaded"
Step 4: Total LV stroke volume increases (forward + regurgitant)
Step 5: LV undergoes ECCENTRIC HYPERTROPHY (volume overload → dilates)
Step 6: LVEF may appear falsely normal (ejecting into low-resistance LA)
Step 7: When LV finally decompensates, LVEF falls to "abnormal" levels
        (TRAP: LVEF < 60% in MR is already significant dysfunction!)
Step 8: Pulmonary hypertension → right heart failure

ACUTE MR (Step-by-Step):
Step 1: Sudden large regurgitation into NORMAL-SIZED LA
Step 2: LA cannot dilate acutely → LA pressure spikes dramatically
Step 3: Pulmonary venous pressure rises → flash pulmonary oedema
Step 4: Forward CO falls → cardiogenic shock
Step 5: Loud murmur may be SOFT or absent in severe acute MR
        (pressure equalises between LV and LA quickly)
Step 6: EMERGENCY — urgent surgery required

SYMPTOMS:
Chronic (asymptomatic for years):
- Exertional dyspnoea (most common)
- Fatigue (reduced forward CO)
- Palpitations (AF from LA dilatation)
- Orthopnoea, PND (when LA pressure rises)

Acute:
- Sudden severe dyspnoea, orthopnoea
- Signs of cardiogenic shock (post-MI papillary muscle rupture —
  typically day 2–7 post inferior MI)

SIGNS — MNEMONIC: "PALM"
P — Pansystolic murmur at apex, radiates to axilla
    (harsh, blowing; in MVP — mid-late systolic click + murmur)
A — Apex: displaced inferolaterally, HYPERDYNAMIC (thrusting)
L — Loud P2 (pulmonary hypertension sign)
M — Mitral click (in MVP — mid-systolic click)

Cardiac Examination Details:
- Pulse: normal or fast (AF)
- JVP elevated if RV failure
- Pansystolic murmur:
  * Best at apex with diaphragm
  * Radiates to axilla (and sometimes to back)
  * Increases with squatting (increases preload/afterload)
  * Decreases with Valsalva or standing (reduces preload)
  * Grade 3–6/6 in significant MR
- S3 (volume overload — very important sign of severity)
- Soft S1 (leaflets don't close properly)

INVESTIGATIONS — MNEMONIC: "FEEL"
F — Function (LV): LVEF on Echo — critical (< 60% = already severe)
E — Echo (TTE + colour Doppler — definitive investigation)
E — ECG (P mitrale, LVH, AF)
L — Left heart cath + coronary angiogram (pre-op, rule out ischaemia)

Echo Parameters for Severe MR:
- Vena contracta > 7 mm
- Regurgitant volume > 60 mL
- ERO (effective regurgitant orifice) > 0.40 cm2
- LA dilatation, LV dilatation

MANAGEMENT

ACUTE MR (Emergency — e.g. papillary muscle rupture post-MI):
Step 1: O2, IV access, monitoring, call cardiac team
Step 2: IV vasodilators (sodium nitroprusside) — reduce afterload,
        increase forward CO
Step 3: Intra-aortic balloon pump (IABP) — INDICATED in acute MR
        (unlike in AR — reduces afterload, improves forward CO)
Step 4: Urgent echo to confirm diagnosis
Step 5: Emergency mitral valve surgery (repair or replacement)
Step 6: Treat underlying MI with PCI/thrombolysis first if possible

CHRONIC MR (Medical — for secondary/functional MR):
- ACEi/ARBs: reduce afterload, helpful in functional MR
- Beta-blockers, diuretics: for HF symptoms
- Aldosterone antagonist if HFrEF features
- Anticoagulation: if AF develops (warfarin if rheumatic)
- GDMT (guideline-directed medical therapy): for functional MR

Transcatheter MitraClip:
- Percutaneous edge-to-edge mitral valve repair
- For patients with severe primary MR who are high surgical risk
- COAPT trial (2018): in functional MR, MitraClip significantly
  reduced hospitalisations and mortality

INDICATIONS FOR SURGERY (ACC/AHA 2020):
Class I:
- Symptomatic severe primary MR (LVEF > 30%)
- Asymptomatic severe primary MR + LVEF < 60% or LVESD > 40 mm

Class IIa:
- Asymptomatic severe MR + AF or pulmonary hypertension
- Rheumatic MR amenable to repair (highly durable in expert centres)

Type of Surgery:
- Mitral valve REPAIR preferred over replacement when possible
  (preserves LV function, no anticoagulation needed for repair)
- If repair not feasible: valve replacement
- Mechanical valve: younger patients, already in AF needing warfarin
- Bioprosthetic: older patients or anticoagulation contraindicated

HKMLE TRAP BOX 1:
LVEF of 55–60% in MR is already ABNORMAL. In MR, the LV ejects
into the low-resistance LA, so LVEF appears artificially elevated.
A "normal" LVEF of 55% in someone with severe MR is actually a sign
of LV dysfunction. Surgery should be considered at LVEF < 60%.

HKMLE TRAP BOX 2:
IABP is INDICATED in acute MR (reduces afterload) but CONTRAINDICATED
in acute AR. Know both — this distinction is a frequent MCQ trap.

HKMLE TRAP BOX 3:
Acute MR post-MI classically presents on day 2–7 with SUDDEN onset
severe dyspnoea and a NEW pansystolic murmur. It is due to posterior
papillary muscle rupture (supplied only by posterior descending artery —
less collateral supply than anterior papillary muscle).

COMPLICATIONS — MNEMONIC: "AFSHE"
A — Atrial fibrillation (LA dilatation)
F — Failure (pulmonary oedema, right heart failure)
S — Stroke (AF + LA thrombus)
H — Heart failure (LV decompensation)
E — Endocarditis

COMMON EXAM QUESTION BOX:
Q: A 58-year-old man presents on day 4 after an inferior MI with sudden
severe dyspnoea and a loud pansystolic murmur. What is the diagnosis
and immediate management?
A: Acute MR due to posterior papillary muscle rupture.
Immediate: O2, IV nitroprusside, IABP, urgent echo, emergency MVR.

Q: What is the murmur of MR?
A: Pansystolic, blowing, best at apex, radiates to axilla,
louder with squatting, softer with Valsalva.

================================================================================
SECTION 5: RHEUMATIC HEART DISEASE (RHD)
================================================================================

DEFINITION
Rheumatic heart disease is the chronic cardiac sequela of acute rheumatic
fever (ARF), an inflammatory condition triggered by Group A Streptococcal
(GAS) pharyngitis. It results in progressive valve damage, most commonly
affecting the mitral valve.

AETIOLOGY — MNEMONIC: "SGAS"
S — Streptococcus pyogenes (Group A beta-haemolytic Strep)
G — Group A: throat infection (NOT skin infection — important!)
A — Antibody cross-reactivity (molecular mimicry)
S — Susceptible host + repeated infections = cumulative valve damage

Pathogenesis:
GAS pharyngitis → host produces anti-streptococcal antibodies →
antibodies cross-react with cardiac myosin, valvular collagen,
neuronal antigens → inflammation of heart, joints, brain, skin

VALVE INVOLVEMENT IN RHEUMATIC HEART DISEASE (in order of frequency):
1. Mitral valve (most common — 65–70% of cases)
2. Aortic valve (30–40%)
3. Tricuspid valve (rarely significant)
4. Pulmonary valve (extremely rare — "relatively immune")
Mnemonic: "Mitral Most, Aortic And, Tricuspid Trickle, Pulmonary
Practically Protected" = MATP

ACUTE RHEUMATIC FEVER — JONES CRITERIA (2015 Revised)

DIAGNOSIS: 2 Major + 1 Minor OR 1 Major + 2 Minor criteria
(plus evidence of preceding GAS infection)

MAJOR CRITERIA — MNEMONIC: "JONES"
J — (no J — mnemonic only)
O — (Oedema of joints) — Arthritis (migratory polyarthritis —
    most common manifestation)
N — Nodules (subcutaneous — firm, painless, over bony prominences)
E — Erythema marginatum (skin: pink rings with clear centres,
    trunk + proximal limbs)
S — Sydenham's chorea (involuntary movements, emotional lability)
+ Carditis (pancarditis affecting pericardium, myocardium, endocardium)

ACTUAL MAJOR CRITERIA (5):
1. Carditis (clinical or subclinical — subclinical = echo only)
2. Arthritis — migratory polyarthritis (large joints)
   In high-prevalence settings (like HK/Asia): monoarthritis also counts
3. Chorea (Sydenham's) — delayed manifestation, after strep has cleared
4. Erythema marginatum (rare)
5. Subcutaneous nodules (rare)

MINOR CRITERIA:
1. Fever (> 38.5°C)
2. Elevated ESR or CRP
3. Prolonged PR interval on ECG
4. Arthralgia (ONLY if arthritis is NOT already a major criterion)

EVIDENCE OF PRIOR GAS INFECTION REQUIRED:
- Elevated ASO titre (anti-streptolysin O) > 200 IU/mL
- Elevated anti-DNase B
- Positive throat culture for GAS
- Rapid streptococcal antigen test

LOCAL EPIDEMIOLOGY VARIANT BOX:
In Hong Kong:
- ARF incidence has declined dramatically since the 1970s with
  improved housing, antibiotics and living standards
- However, RHD remains present in elderly HK residents and recent
  immigrants from high-prevalence areas
- Carditis with subclinical valvular disease (echocardiographic only)
  is increasingly recognised and is a major criterion in 2015 guidelines
- The 2015 AHA/WHF revised Jones criteria recommend echo for ALL
  suspected ARF cases — a change from older guidelines

INVESTIGATIONS IN ARF:
- Throat swab + culture
- ASO titre (repeat at 2 weeks if initially normal)
- Anti-DNase B
- ESR, CRP, WBC, FBC
- ECG (PR interval, arrhythmias)
- CXR (cardiac size)
- ECHOCARDIOGRAM — now recommended in ALL cases (2015 revision)

MANAGEMENT OF ACUTE RHEUMATIC FEVER:

Step 1: Eradicate GAS — Benzylpenicillin 1.2 million units IM
        single dose OR amoxicillin 500 mg TDS x 10 days
        (If penicillin allergic: azithromycin or cephalexin)
Step 2: Anti-inflammatory:
        - Arthritis: aspirin 80–100 mg/kg/day (children)
          OR naproxen (better tolerated)
        - Carditis (mild-moderate): NSAIDs
        - Carditis (severe — cardiac failure): oral prednisolone
          2 mg/kg/day x 2 weeks then taper
Step 3: Heart failure management: diuretics, ACEi, bed rest
Step 4: Chorea: haloperidol or valproate if severe
Step 5: Secondary prophylaxis: START IMMEDIATELY after acute episode

SECONDARY PROPHYLAXIS (PREVENTION OF RECURRENT ARF):
Goal: Prevent recurrent GAS pharyngitis → prevent further valve damage

DRUG OF CHOICE: Benzathine penicillin G (BPG)
- Dose: 1.2 million units IM every 4 weeks (every 3 weeks if high risk)
- Duration depends on risk (see below)

DURATION TABLE:
-----------------------------------------------------------------------
Category                              | Duration
-----------------------------------------------------------------------
ARF without carditis                  | 5 years or until age 21
                                      | (whichever is longer)
ARF with carditis, no residual VHD   | 10 years or until age 21
ARF with carditis + residual VHD     | Minimum 10 years or until
                                      | age 40 (whichever longer)
Severe VHD or post-valve surgery     | Lifelong prophylaxis
-----------------------------------------------------------------------

HA CLINICAL PATHWAY BOX:
HK HA protocol for secondary prophylaxis:
- Benzathine penicillin G 1.2 million units IM 4-weekly
- Patients enrolled in a dedicated rheumatic fever registry
  (primarily paediatric cardiology service)
- Oral penicillin V 250 mg BD is an alternative but less reliable
- Duration as per WHO/AHA guidelines above
- Annual echocardiography to monitor valve disease progression

CHP STATUTORY NOTIFICATION BOX:
Acute Rheumatic Fever (ARF) is NOT a statutory notifiable disease
in Hong Kong under Cap. 599B Infectious Disease Regulations.
However, it is a condition of public health significance and is
monitored by HA surveillance systems.
Group A Streptococcal invasive disease (iGAS) IS notifiable.

HKMLE TRAP BOX 1:
Secondary prophylaxis is benzathine penicillin IM — NOT daily oral
penicillin (oral has poor compliance and lower efficacy). The exam
will test the CORRECT drug and route.

HKMLE TRAP BOX 2:
Steroids in ARF: Only used for SEVERE carditis with heart failure.
They do NOT prevent the development of RHD (multiple trials showed
this). NSAIDs are first choice for arthritis. This is a classic trap.

HKMLE TRAP BOX 3:
ARF follows THROAT infection with GAS — NOT skin infection.
Streptococcal skin infections (impetigo) can cause glomerulonephritis
but NOT rheumatic fever. Know the distinction.

HKMLE TRAP BOX 4:
Chorea (Sydenham's) can appear MONTHS after the initial strep
infection — it is a DELAYED manifestation. The ASO titre may have
returned to normal by the time chorea develops. Do NOT dismiss the
diagnosis because ASO is normal if chorea is present.

Jones CRITERIA REVISION NOTE (2015):
The 2015 revision introduced SUBCLINICAL CARDITIS (echo only, no
auscultatory findings) as a major criterion. This was NOT in older
versions of Jones criteria. The HK exam may test the updated criteria.

CROSS-REFERENCE: For prophylaxis — see also Module Infections

================================================================================
SECTION 6: DRUG TRAPS TABLE
================================================================================

Drug / Class        | Trap / Pitfall                    | Correct Answer
--------------------+-----------------------------------+--------------------
Statins (all)       | Do NOT slow AS progression        | No drug slows AS
                    | (SALTIRE/SEAS trials)             |
Nitrates/GTN        | DANGEROUS in severe AS —          | Avoid in severe
                    | causes collapse (preload drop)    | symptomatic AS
ACEi/ARBs           | Can be used in AR (vasodilate)   | CONTRAINDICATED
                    | but CAUTION in severe AS          | in severe AS
NOACs               | NOT for rheumatic (valvular) AF   | Use WARFARIN
(rivaroxaban etc)   | with MS — excluded from trials   |
IABP                | CONTRAINDICATED in AR            | USE in acute MR
                    | (worsens regurgitation)           | (reduces afterload)
Beta-blockers       | AVOID in severe symptomatic AS    | Use in HCM, AR
                    | (reduce CO further)               | post-MI, HF
Verapamil/Diltiazem | AVOID in heart failure/LVEF <40  | Can use for rate
                    | Can use for rate control in AF+MS | control in MS/AF
Digoxin             | NOT first-line rate control in    | Use BB or RLCCBs
                    | MS with sinus rhythm              | first
Benzathine pen G    | Route = IM (NOT oral)            | 1.2 MU IM q4 weeks
Steroids in ARF     | Do NOT prevent RHD development   | Only for severe
                    |                                   | carditis + HF

================================================================================
SECTION 7: NOTABLE TRIALS TABLE
================================================================================

Trial Name      | Year | Topic           | Key Finding
----------------+------+-----------------+-----------------------------
PARTNER 1       | 2010 | TAVI vs medical | TAVI reduced mortality in
                |      | therapy (insurg) | inoperable severe AS (20%
                |      |                 | absolute risk reduction at
                |      |                 | 1 year)
PARTNER 2       | 2016 | TAVI vs SAVR    | TAVI non-inferior to SAVR
                |      | (intermed risk) | in intermediate-risk AS
PARTNER 3       | 2019 | TAVI vs SAVR    | TAVI superior at 1 year
                |      | (low risk)      | (lower death/stroke/rehospital)
EVOLUT Low Risk | 2019 | TAVI vs SAVR    | TAVI non-inferior to SAVR
                |      | (low risk)      | in low surgical risk pts
SALTIRE         | 2005 | Statins in AS   | Atorvastatin did NOT slow
                |      |                 | progression of calcific AS
SEAS            | 2008 | Ezetimibe +     | Combined statin/ezetimibe
                |      | simvastatin AS  | did NOT slow AS progression
AVATAR          | 2022 | Early vs delayed| Early AVR superior to
                |      | surgery in      | watchful waiting in
                |      | asymptomatic AS | asymptomatic very severe AS
COAPT           | 2018 | MitraClip vs    | MitraClip reduced HF
                |      | medical in fxn  | hospitalisations and
                |      | MR (HFrEF)      | all-cause mortality
MITRA-FR        | 2018 | MitraClip vs    | MitraClip did NOT improve
                |      | medical (fxn MR)| outcomes — conflicting
                |      |                 | with COAPT
EXPLORER-HCM    | 2020 | Mavacamten in   | Mavacamten improved LVOT
                |      | obstructive HCM | gradient and symptoms (new
                |      |                 | cardiac myosin inhibitor)
CORP-2          | 2014 | Colchicine      | Colchicine halved rate of
                |      | recurrent       | recurrent pericarditis
                |      | pericarditis    |

================================================================================
SECTION 8: MASTER MNEMONICS TABLE
================================================================================

Mnemonic     | Stands For                        | Topic
-------------+-----------------------------------+---------------------------
SAD          | Syncope, Angina, Dyspnoea         | AS symptoms
ASD 5-3-2   | Angina 5yr, Syncope 3yr,          | AS prognosis after
             | Dyspnoea 2yr survival             | symptoms develop
HERO         | Harsh, Ejection systolic,          | AS murmur character
             | Radiates to carotids,             |
             | Obliterates A2                    |
BECAM        | Bedside ECG, Echo, Cath,          | AS investigations
             | AXR, MRI                          |
MARBLE       | Marfan, Aortic dissection,        | AR causes
             | Rheumatic, Bicuspid,              |
             | Lues, Endocarditis                |
WWW CEDRA   | Water-hammer, Wide PP,            | AR peripheral signs
             | Wandering carotids; Corrigan,     |
             | de Musset, Duroziez,             |
             | Rosenbach, Austin Flint           |
RACE         | Rheumatic, Age-related,           | MS causes
             | Congenital, Endocarditis          |
DOHH         | Dyspnoea, Orthopnoea,            | MS symptoms
             | Haemoptysis, Hoarseness          |
MOST         | Malar flush, Opening snap,        | MS signs
             | Sinus AF, Tapping apex            |
ECCL         | ECG, CXR, Colour echo, L-cath     | MS investigations
SAFE PAH     | Stroke, AF, Failure, Emboli,      | MS complications
             | PAH, Airway/Ortner, Haemoptysis   |
PRIME        | Prolapse, Rheumatic,              | MR causes
             | Ischaemic, Myxomatous,            |
             | Endocarditis                      |
PALM         | Pansystolic murmur, Apex          | MR signs
             | displaced, Loud P2, Mitral click  |
FEEL         | Function, Echo, ECG, L-cath       | MR investigations
AFSHE        | AF, Failure, Stroke, HF, Endo     | MR complications
MATP         | Mitral, Aortic, Tricuspid,        | RHD valve involvement
             | Pulmonary (in decreasing freq)    | order
JONES        | Joints, Oh (subcutaneous          | Major Jones criteria
             | nOdules), Nodules, Erythema,      | mnemonic aid
             | Sydenham, Carditis                |
SGAS         | Streptococcus Group A, Antibody,  | RHD aetiology
             | Susceptible host                  |
FHE          | Failure, Heart block/IE, Emboli   | AR complications
CHARM        | Congenital bicuspid, HTN,         | AS risk factors
             | Age, Rheumatic, Male             |

================================================================================
SECTION 9: CROSS-MODULE LINKS
================================================================================

This Module Links To...

MODULE 1A (Heart Failure):
- All valvular disease can cause HF (pressure and volume overload)
- AS causes HFpEF (stiff LV) then HFrEF (dilated failing LV)
- AR and MR cause HFrEF (volume overload, LV dilatation)
- GDMT for HF applies to secondary (functional) MR

MODULE 1B (Arrhythmias):
- MS is the classic cause of AF — enlarged LA is the substrate
- AF in MS: always anticoagulate with WARFARIN (not NOACs)
- Prolonged PR interval = minor Jones criterion
- AF with fast ventricular rate worsens MS (less time for LV filling)

MODULE 1C (Ischaemic Heart Disease):
- Acute papillary muscle rupture post-MI → acute MR
  (inferior MI → posterior papillary muscle → posterior leaflet MR)
- Ischaemic functional MR from LV remodelling post-MI
- Pre-operative coronary angiogram required before valve surgery

MODULE 1D (This module):
- RHD causes MS, MR, AR, TR (in decreasing frequency)
- Endocarditis complicates all valvular disease

MODULE 1E (Infective Endocarditis — same module):
- Bicuspid aortic valve + MVP = highest risk structural lesions for IE
- Endocarditis causes: AR (leaflet destruction), MR (perforation),
  MS (rare), TR (IVDU)
- IE prophylaxis indicated before dental procedures in HIGH-risk
  structural heart disease

MODULE 2 (Respiratory):
- Severe MS with pulmonary venous hypertension mimics LVF
- Haemoptysis in MS can mimic pulmonary TB or bronchiectasis
  (important differential in HK where TB remains endemic)

MODULE 3 (Rheumatology):
- Rheumatic fever (GAS) — see ARF and Jones criteria above
- Ankylosing spondylitis, reactive arthritis → AR (HLA-B27 diseases)
- Marfan syndrome → AR + aortic root dilatation
- SLE → Libman-Sacks endocarditis (sterile vegetations on both
  surfaces of mitral valve — distinct from infective endocarditis)

MODULE 4 (Pharmacology):
- Warfarin monitoring: INR 2–3 for AF in valvular disease;
  INR 2.5–3.5 for mechanical mitral valve
- Penicillin allergy for prophylaxis → use azithromycin or doxycycline

LEGAL/ETHICAL ORDINANCE BOX:
Rheumatic fever prophylaxis for CHILDREN in HK:
- Under Cap. 382 Public Health and Medical Services Ordinance,
  the HA has an obligation to provide preventive healthcare services
- Consent for ongoing IM penicillin injections in minors:
  parental consent required; Gillick competence applies for
  adolescents with capacity
- Cap. 136 Mental Health Ordinance: relevant if patient with RHD
  lacks capacity to consent to valve surgery

================================================================================
KEY TAKEAWAYS FOR THE EXAM
================================================================================

1. AS: SAD symptoms, ESM radiating to carotids, slow-rising pulse,
   narrow PP. TAVI for high risk/elderly. SAVR for young/low risk.
   No drug slows progression.

2. AR: MARBLE causes. Wide PP, collapsing pulse, early diastolic murmur
   at LSE. IABP CONTRAINDICATED. Acute AR = emergency surgery.

3. MS: Rheumatic. "MOST" signs + mid-diastolic murmur. Warfarin (NOT
   NOACs) for AF. PBMV if pliable valve. Short S2-OS = more severe.

4. MR: PRIME causes. Pansystolic murmur at apex to axilla. LVEF < 60%
   already abnormal in MR. Acute (papillary rupture) = emergency. IABP
   INDICATED in acute MR.

5. RHD: Jones criteria 2015. GAS throat infection (not skin). Secondary
   prophylaxis = benzathine penicillin G IM q4 weeks. Duration depends
   on valve damage. Steroids do NOT prevent RHD.

================================================================================
SOURCES
================================================================================
- Braunwald's Heart Disease, 12th/13th Edition
- Fuster and Hurst's The Heart, 15th Edition
- Bailey and Love's Short Practice of Surgery, 28th Edition
- ACC/AHA 2020 Guideline for Management of Valvular Heart Disease
- ESC/EACTS 2021 Guidelines on Valvular Heart Disease
- 2025 ESC/EACTS Guidelines on VHD (Lancellotti et al, Rev Med Liege)
- 2024 AHA/ACC Guideline for Hypertrophic Cardiomyopathy
- AHA 2015 Revised Jones Criteria for ARF
- PubMed: PARTNER 3, COAPT, EXPLORER-HCM, AVATAR trials
- Hong Kong Hospital Authority Clinical Guidelines
- WHO/WHF Guidelines on Rheumatic Fever Prophylaxis

================================================================================
END OF MODULE 1D: VALVULAR HEART DISEASE
HKMLE High-Yield Study Note | August 2026
================================================================================