
Write MD Anaesthesiology exam notes on Loops and Scalers of ventilator graphs
Reading File
Finding Sources
Finding Sources
Finding Sources
Finding Sources
Finding Sources
I have the key file paths. Let me now read the most relevant sections in parallel.
Reading File
Reading File
Reading File
Searching Images
ventilator pressure-volume loop flow-volume loop waveform scalar
Reading File
Reading File
Searching Images
pressure-volume loop ventilator ARDS lower upper inflection point overdistension
Reading File
Searching Images
flow-time scalar ventilator waveform expiratory flow obstruction auto-PEEP
Reading File
Searching Images
flow-volume loop ventilator patient dyssynchrony double triggering reverse trigger
Now I have all the material needed. Here are the comprehensive MD Anaesthesiology exam notes:
Ventilator Graphs: Loops & Scalars
MD Anaesthesiology Exam Notes
SECTION 1 — FOUNDATIONAL CONCEPTS
The Equation of Motion
The fundamental principle governing all ventilator waveforms:
P_aw = (V_T / C) + (R × Flow) + PEEP
Where:
- P_aw = airway pressure
- V_T = tidal volume
- C = compliance
- R = resistance
- PEEP = positive end-expiratory pressure
All ventilator graphics are derived from the three variables in this equation: pressure (P), volume (V), and flow (V̇). These can be displayed as:
- Scalars — variable plotted against time (waveforms)
- Loops — one variable plotted against another variable
SECTION 2 — SCALARS (Time-Based Waveforms)
Scalars display a single variable on the Y-axis against time on the X-axis. There are three scalars:
2.1 Pressure–Time Scalar (P–t)
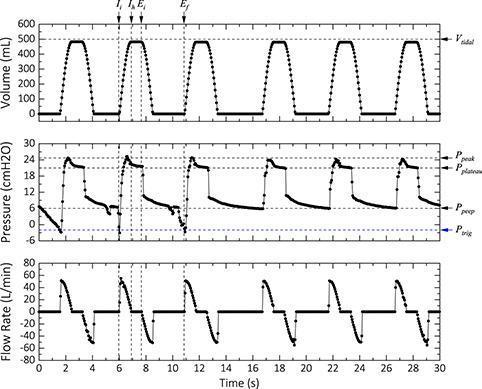
Normal morphology
| Feature | Normal Value | Significance |
|---|---|---|
| Peak Inspiratory Pressure (PIP) | < 35–40 cmH₂O | Sum of resistive + elastic loads |
| Plateau Pressure (P_plat) | < 30 cmH₂O | Reflects alveolar/elastic pressure only |
| PEEP | Set by clinician | End-expiratory alveolar pressure |
| Trigger deflection | −1 to −2 cmH₂O | Patient effort to initiate breath |
PIP – P_plat = Resistive pressure (reflects airway resistance)
P_plat – PEEP = Driving Pressure (reflects respiratory system compliance)
Volume-Controlled Ventilation (VCV) — Pressure Scalar
- Pressure rises to a peak then drops to a plateau during end-inspiratory hold
- Square flow → higher PIP but measurable P_plat
- PIP ↑ with ↑ resistance or ↓ compliance; P_plat ↑ only with ↓ compliance
Pressure-Controlled Ventilation (PCV) — Pressure Scalar
- Pressure rises rapidly to a set level and is maintained as a plateau throughout inspiration
- Flow is decelerating; PIP = P_plat (no resistive peak separation)
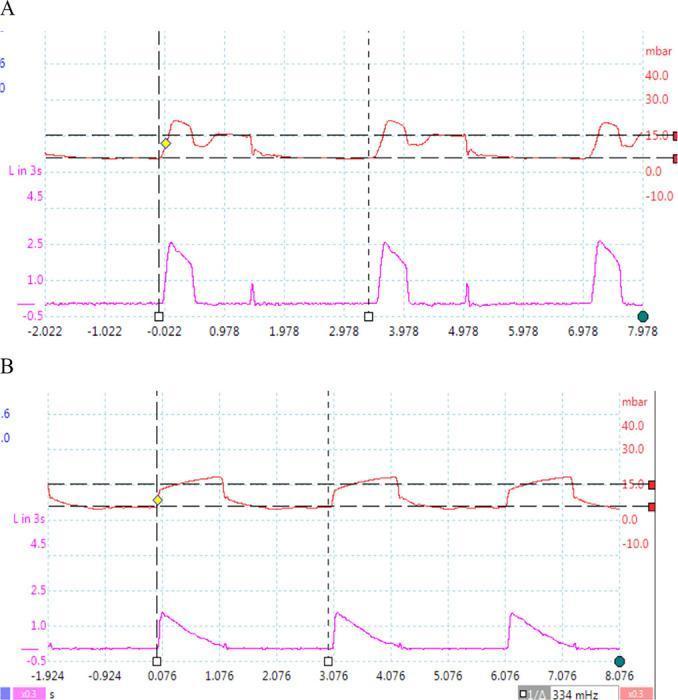
Clinically Important Abnormalities on P–t Scalar
| Finding | Interpretation | Action |
|---|---|---|
| ↑ PIP, normal P_plat | ↑ Airway resistance (bronchospasm, secretions, kinked ETT) | Suction, bronchodilators, check circuit |
| ↑ PIP + ↑ P_plat | ↓ Compliance (ARDS, pneumothorax, pulmonary oedema, tension pneumo) | ↓ VT, investigate cause |
| Large negative trigger deflection | High work of breathing; ventilator sensitivity too low | Increase trigger sensitivity; rule out auto-PEEP |
| Pressure fails to reach plateau (PCV) | Circuit leak | Check circuit, ETT cuff |
| Notching/scalloping of plateau | Active patient effort — patient–ventilator dyssynchrony | Adjust settings, sedation |
2.2 Flow–Time Scalar (V̇–t)
Normal morphology
- Inspiration: positive deflection upward
- VCV (square): instantaneous rise to set IFR, maintained constant
- PCV (decelerating ramp): high peak then decelerates to zero by end of inspiration
- Expiration: passive, negative deflection; exponential return to zero
Key Measurements
- Inspiratory Flow Rate (IFR): set in VCV; determines inspiratory time
- Expiratory flow: should return to zero baseline before next breath
- Peak expiratory flow: normally slightly higher than peak inspiratory flow
Clinically Important Abnormalities on Flow–t Scalar
| Finding | Interpretation |
|---|---|
| Expiratory flow fails to reach zero before next breath | Auto-PEEP (intrinsic PEEP) — air trapping; seen in obstructive disease |
| Decelerating inspiratory flow in PCV reaching zero early (flow starvation) | Patient demand > delivered flow in VCV → dyssynchrony |
| Scooped-out expiratory limb | Obstructive disease (asthma, COPD) |
| Double hump or biphasic expiratory flow | Secretions in airway; circuit water |
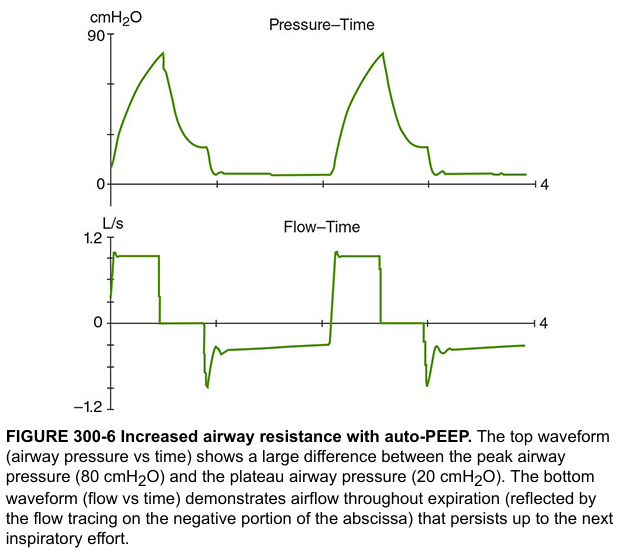
Auto-PEEP detection: In VCV, observe the flow–time waveform. If expiratory flow does not return to zero before the next inspiratory cycle begins, intrinsic PEEP is present. Confirm with an end-expiratory hold manoeuvre.
2.3 Volume–Time Scalar (V–t)
Normal morphology
- Rises linearly during inspiration (VCV) or curvilinearly (PCV)
- Returns to baseline by end of expiration
- Peak = delivered tidal volume
Clinically Important Abnormalities on V–t Scalar
| Finding | Interpretation |
|---|---|
| Volume does not return to zero | ETT or circuit leak; air trapping |
| Lower than set VT | Leak in circuit; high compliance; volume lost in tubing |
| Staircase pattern (volumes not returning to baseline) | Auto-PEEP / gas trapping |
SECTION 3 — LOOPS
Loops plot two variables against each other over a complete respiratory cycle, revealing lung mechanics more comprehensively than scalars.
3.1 Pressure–Volume (P–V) Loop
One of the most clinically valuable ventilator graphics.
X-axis: Pressure (cmH₂O) | Y-axis: Volume (mL)
Normal P–V Loop Morphology
- Shaped like a tilted ellipse or banana
- Inspiratory limb (lower curve): rises from PEEP level to peak pressure/tidal volume
- Expiratory limb (upper curve): returns to baseline, always above inspiratory limb
- The area enclosed by the loop = work of breathing / hysteresis
- The loop is traced counter-clockwise
Landmarks on the P–V Loop
| Landmark | Description | Clinical Use |
|---|---|---|
| Lower Inflection Point (LIP) | Point of upward concavity on inspiratory limb; pressure ~8–15 cmH₂O | PEEP should be set above this to prevent cyclical alveolar collapse/derecruitment |
| Upper Inflection Point (UIP) | Point of downward concavity (curve flattens); pressure ~25–35 cmH₂O | PIP should be kept below this to avoid overdistension |
| Safe zone | Between LIP and UIP | Optimal ventilation window — maximises recruitment, minimises VILI |
| "Beaking" | Sudden flattening/hook at top of inspiratory limb | Overdistension — ventilator-induced lung injury |
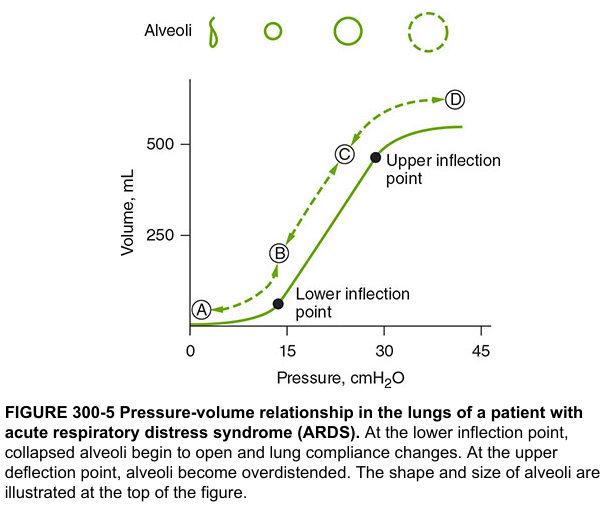
The P-V loops obtained on the ventilator can be used to increase PEEP to keep lung tissue recruited above an area of potential atelectasis. This is seen graphically as the lower inflection point on the inspiratory limb of the P-V loop. — Miller's Anesthesia, 10e
Compliance from the P–V Loop
- Static compliance = ΔV / ΔP (slope of the P–V loop)
- Steeper slope = better compliance
- Flatter slope = stiff lungs (ARDS, pulmonary fibrosis)
Pathological P–V Loop Patterns
| Pattern | Appearance | Cause |
|---|---|---|
| Shift right (rightward displacement) | Loop displaced toward higher pressures for same volume | ↓ Compliance (ARDS, oedema, atelectasis) |
| Narrowed/tall loop | Volume change large, small pressure change | ↑ Compliance (emphysema) |
| Wide loop / increased area | Increased hysteresis | ↑ Work of breathing; obstructive disease |
| "Beaking" or flattening at top | UIP exceeded | Overdistension — reduce VT or PIP |
| Loop does not begin at origin | Auto-PEEP present | Reduce RR, increase expiratory time |
| Air trapping / figure-of-8 loop | Expiratory limb does not close at origin | Auto-PEEP; obstructive disease |
P–V Loop in VCV vs PCV
- VCV: rectangular path — pressure rises rapidly on inspiration (sharp vertical limb), then horizontal return
- PCV: more triangular/elliptical — gradual pressure rise
3.2 Flow–Volume (F–V) Loop
X-axis: Volume (mL) | Y-axis: Flow (L/s or L/min)
Displays the dynamic relationship between flow and volume during a complete breath. Trace is clockwise conventionally on ventilators (some display inspiration above x-axis, some below — know your ventilator).
Normal F–V Loop Morphology
- Inspiratory limb: rapid rise to peak inspiratory flow (PIF), then decelerates
- Expiratory limb: rapid rise to peak expiratory flow (PEF), then decelerates back to zero
- PEF > PIF normally
- The loop closes — expiratory flow returns to zero before the next breath
Pathological F–V Loop Patterns
| Pattern | Appearance | Interpretation |
|---|---|---|
| Scooped expiratory limb | Concave expiratory limb (bowing toward volume axis) | Obstructive disease (asthma, COPD, bronchospasm) — expiratory flow limitation |
| Loop does not close | Expiratory limb does not return to zero | Air trapping / Auto-PEEP |
| Serrated/oscillating pattern | Sawtooth waves on loop | Secretions in airway; water in circuit |
| Reduced volume for same flow | Loop compressed along volume axis | ↓ Tidal volume; leak |
| Variable inspiratory limb | Inconsistent shape each breath | Patient effort / dyssynchrony |
SECTION 4 — COMPARISON OF LOOPS AND SCALARS
| Feature | Scalars | Loops |
|---|---|---|
| X-axis | Time | Another variable (P or V) |
| Shows trends over time | Yes | No |
| Shows lung mechanics | Partially | Better — compliance, resistance visually apparent |
| PEEP detection | Flow-time (auto-PEEP) | P-V loop (loop doesn't close at origin) |
| Compliance assessment | P-t (P_plat − PEEP) | P-V loop slope |
| Resistance assessment | P-t (PIP − P_plat) | Area of P-V loop |
| Optimal PEEP setting | — | LIP on P-V loop |
| Overdistension detection | P-t (↑ P_plat) | UIP/"beaking" on P-V loop |
| Obstructive disease | Flow-t (scooped expiry, auto-PEEP) | F-V loop (scooped expiratory limb) |
SECTION 5 — PATIENT–VENTILATOR DYSSYNCHRONY
Ventilator graphics are the primary tool for identifying dyssynchrony.
5.1 Types of Dyssynchrony and Graphic Signatures
| Type | Definition | Graphic Finding |
|---|---|---|
| Trigger dyssynchrony | Patient effort fails to trigger ventilator | Large negative P deflection before breath; ineffective efforts visible as small notches in P-t or F-t without a full breath |
| Auto-triggering | Ventilator triggers without patient effort | Rapid, regular breaths; no negative trigger deflection; caused by water in circuit, cardiac oscillations |
| Flow starvation (demand > delivery) | Patient demands higher flow than set IFR in VCV | Scooped/concave pressure scalar during inspiration; patient "straining over" the ventilator |
| Double cycling | Two mechanical breaths during one patient effort | Two successive breaths with no expiratory pause; increased delivered VT |
| Reverse triggering | Diaphragmatic contraction entrained to mechanical breath | Breath delivered, followed by delayed drop in Pes (esophageal pressure) |
| Premature cycling | Ventilator ends inspiration before patient effort ends | Notch at end of inspiratory flow on F-t |
| Delayed cycling | Ventilator delivers inspiratory flow beyond patient effort | Active expiratory effort during mechanical inspiration — spike on P-t at end of breath |
A large negative deflection at the beginning of inhalation on the pressure–time curve suggests that ventilator sensitivity needs to be increased. More commonly, high auto-PEEP is the cause. — Roberts & Hedges' Clinical Procedures in Emergency Medicine
SECTION 6 — CLINICAL APPLICATIONS IN ANAESTHESIA
6.1 ARDS / Lung-Protective Ventilation
- Target VT 6 mL/kg IBW → visible as reduced loop width on P-V loop
- P_plat < 30 cmH₂O → P-t scalar
- Driving pressure (P_plat − PEEP) < 15 cmH₂O — prognostically important
- Set PEEP above LIP on P-V loop to prevent derecruitment
- Avoid UIP (beak sign on P-V loop) to prevent overdistension/VILI
6.2 Obstructive Airway Disease (Asthma/COPD)
- Flow–time scalar: expiratory flow does not reach zero → auto-PEEP
- F–V loop: scooped/concave expiratory limb
- Management: ↓ RR, ↓ VT, ↑ I:E ratio (1:3 or 1:4), permissive hypercapnia
- PEEP_applied = 50–80% of measured auto-PEEP (controversial; reduces trigger effort)
- If acute decompensation: disconnect from ventilator, manual chest compression to expel trapped gas; rule out tension pneumothorax
6.3 Calculating Compliance and Resistance from Graphics
| Parameter | Formula | Normal |
|---|---|---|
| Static compliance (C_st) | VT / (P_plat − PEEP) | 60–100 mL/cmH₂O |
| Dynamic compliance (C_dyn) | VT / (PIP − PEEP) | 50–80 mL/cmH₂O |
| Airway resistance (R_aw) | (PIP − P_plat) / Flow | 5–15 cmH₂O/L/s |
Note: C_st > C_dyn always; the difference reflects resistive component.
6.4 Ventilator Types and Waveform Shapes
| Ventilator Type | Pressure Scalar | Flow Scalar | Notes |
|---|---|---|---|
| Constant-pressure (pressure generator) | Square/flat plateau | Decelerating ramp | PCV, PSV |
| Constant-flow (volume generator) | Peak + plateau shape | Square | VCV standard |
| Nonconstant-flow (sinusoidal) | Bell-shaped | Sine wave | Rotary piston; OR ventilators |
Ventilators generate gas flow by creating a pressure gradient between the proximal airway and the alveoli. The machine generates either a constant pressure or a constant gas flow rate during inspiration, regardless of changes in lung mechanics. — Morgan & Mikhail's Clinical Anesthesiology, 7e
SECTION 7 — HIGH-YIELD EXAM POINTS
- P-V loop — counter-clockwise tracing; F-V loop — clockwise (on most ventilators)
- Beaking on P-V loop = overdistension = reduce VT/PIP immediately
- Expiratory flow not returning to zero on Flow-t scalar = Auto-PEEP
- Loop not closing at origin on P-V loop = Auto-PEEP
- Scooped expiratory limb on F-V loop = Bronchospasm/obstruction
- Scooped pressure scalar during inspiration (VCV) = Flow starvation/dyssynchrony
- Sawtooth pattern on any waveform = Secretions or water in circuit
- Width of P-V loop = Hysteresis = Work of breathing (wider = more work)
- Slope of P-V loop = Compliance (steeper = better compliance)
- PEEP optimisation: set above LIP; avoid exceeding UIP
- Driving pressure = P_plat − PEEP; best predictor of VILI mortality in ARDS
- PIP – P_plat = resistive pressure; elevated in bronchospasm, secretions, kinked ETT
- P_plat elevated alone (with normal PIP-P_plat difference) = pure compliance problem
- In PCV, PIP = P_plat — cannot separate resistance from compliance using pressure alone; use inspiratory hold
SECTION 8 — MEMORY AIDS
"SCALARS show TIME, LOOPS show MECHANICS"
P-V Loop landmarks — "LUSH":
- L = LIP (Lower inflection point) → set PEEP above here
- U = UIP (Upper inflection point) → keep PIP below here
- S = Slope = Compliance
- H = Hysteresis (area) = Work of breathing
Causes of ↑ PIP with normal P_plat (obstructive):
- Bronchospasm
- Secretions / mucus plug
- Kinked / migrated ETT
- Water in circuit / breathing system
Causes of ↑ PIP + ↑ P_plat (restrictive/compliance):
- ARDS / ALI
- Pneumothorax
- Pulmonary oedema
- Endobronchial intubation (one-lung ventilation)
- Abdominal distension (laparoscopy, pregnancy)
- Pulmonary fibrosis
Sources: Miller's Anesthesia 10e; Morgan & Mikhail's Clinical Anesthesiology 7e; Roberts & Hedges' Clinical Procedures in Emergency Medicine; Harrison's Principles of Internal Medicine 22eThese are comprehensive MD Anaesthesiology exam notes covering all aspects of ventilator loops and scalars. Here's a quick orientation:
What's covered:
- Foundational concept — Equation of motion unifying all waveforms
- Three Scalars (P–t, Flow–t, Volume–t) — normal morphology, VCV vs PCV differences, and pathological patterns with clinical interpretation and management
- Two Loops (P–V and F–V) — landmarks (LIP, UIP, beaking), how to read compliance and resistance, and all pathological patterns
- Direct comparison table — when to use scalars vs loops
- Patient–ventilator dyssynchrony — 7 types with specific graphic signatures
- Clinical applications — ARDS (lung-protective targets, PEEP optimisation), obstructive disease (auto-PEEP recognition and management), compliance/resistance calculations
- High-yield exam points — 14 one-liner facts
- Memory aids — "LUSH" mnemonic, causes of ↑PIP patterns
Key exam differentiators: PIP vs P_plat distinction, LIP/UIP on P-V loop, auto-PEEP identification, and dyssynchrony patterns are the most frequently tested areas in MD Anaesthesiology written and clinical exams.
This is a shared conversation. Sign in to Orris to start your own chat.