

answer all questiona in detail
ascending tracts spinal cord pathway diagram
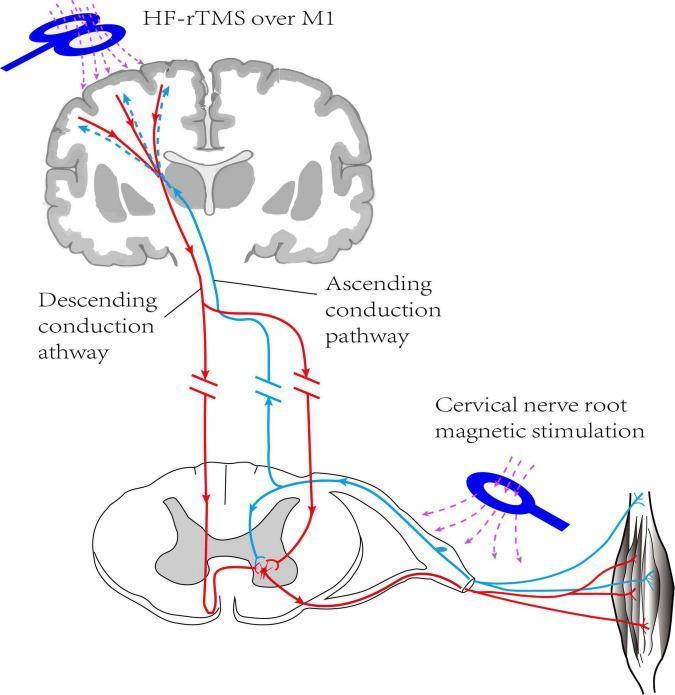
This medical schematic diagram illustrates a neuromodulation intervention combining central and peripheral magnetic stimulation. The visual depicts a coronal section of the human brain and a transverse cross-section of the cervical spinal cord. A high-frequency repetitive transcranial magnetic stimulation (HF-rTMS) coil is positioned over the primary motor cortex (M1), targeting the descending conduction pathway (indicated by red solid lines). Concurrently, a magnetic stimulation coil is applied to the cervical nerve root, targeting the ascending conduction pathway (indicated by light blue lines). The diagram highlights the neural circuit between the motor cortex, spinal interneurons, and effector muscles, demonstrating the dual-target approach for neurorehabilitation, likely in the context of post-stroke hemiplegia. Key anatomical landmarks include the cortical grey matter, subcortical white matter tracts, spinal dorsal and ventral horns, and a peripheral skeletal muscle. Arrows indicate the directional flow of neural signaling within the corticospinal and spinothalamic tracts, emphasizing the integration of central motor output and peripheral sensory input.
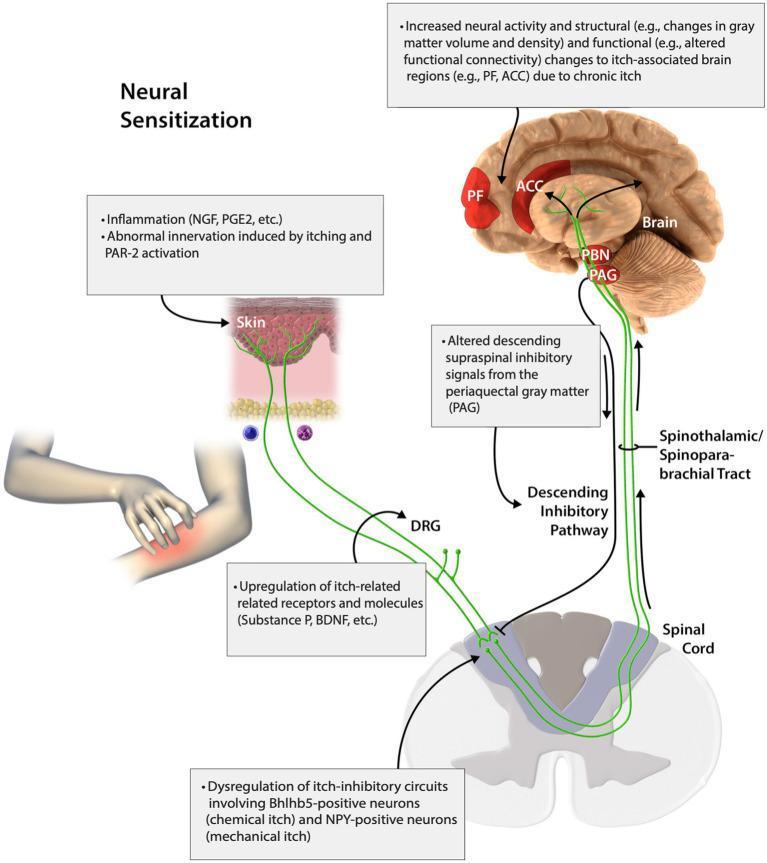
An educational pathophysiology diagram illustrating the pathways of peripheral and central neural sensitization in chronic itch. The diagram traces signals from the skin, through the spinal cord, to the brain. Primary cutaneous stimuli include inflammation (NGF, PGE2) and abnormal innervation via PAR-2 activation. Pruritic signals travel through the dorsal root ganglion (DRG), where upregulation of Substance P and BDNF occurs, and enter the spinal cord. The spinal level highlights dysregulation of itch-inhibitory circuits involving Bhlhb5-positive (chemical itch) and NPY-positive (mechanical itch) neurons. Ascending transmission via the spinothalamic and spinoparabrachial tracts carries signals to the brain, specifically the periaqueductal gray (PAG) and parabrachial nucleus (PBN). The diagram depicts increased neural activity and structural/functional changes (gray matter volume, connectivity) in cortical regions including the prefrontal cortex (PF) and anterior cingulate cortex (ACC). A descending inhibitory pathway from the PAG to the spinal cord is also shown, noting altered supraspinal inhibitory signals that contribute to the chronic itch cycle.
neuromuscular junction transmission diagram
normal ECG lead 2 waves P QRS T
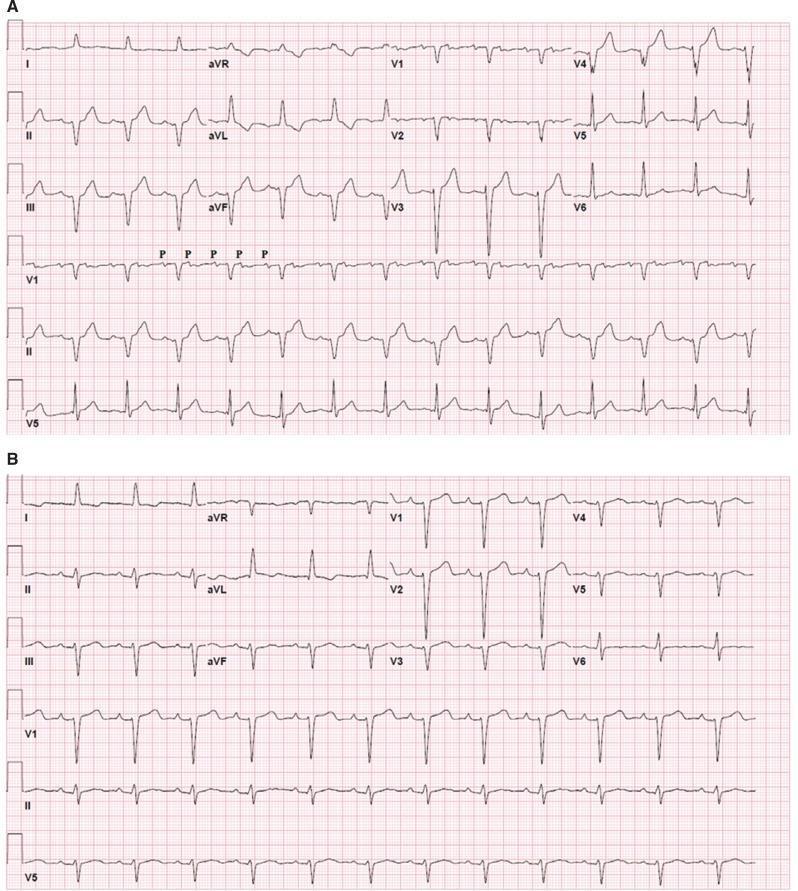
This diagnostic image displays a side-by-side comparison of two 12-lead electrocardiograms (ECGs) labeled A and B, demonstrating the results of a cardiac ablation procedure. ECG A (top) shows a pre-ablation state of atrial tachycardia with a cycle length of approximately 390 ms. It features 2:1 atrioventricular conduction, where low-amplitude P waves (labeled 'P' in lead V1) occur twice for every QRS complex. The QRS morphology is relatively narrow, with visible T waves. ECG B (bottom) illustrates the post-ablation state, showing a return to normal sinus rhythm with 1:1 atrioventricular conduction. In this tracing, distinct P waves are clearly visible preceding every QRS complex across all leads (I, II, III, aVR, aVL, aVF, and V1-V6). The comparison highlights the restoration of rhythmic synchrony between the atria and ventricles. This visual is intended for cardiology education, specifically focusing on electrophysiology, arrhythmia identification, and the therapeutic efficacy of catheter ablation for supraventricular tachycardias.
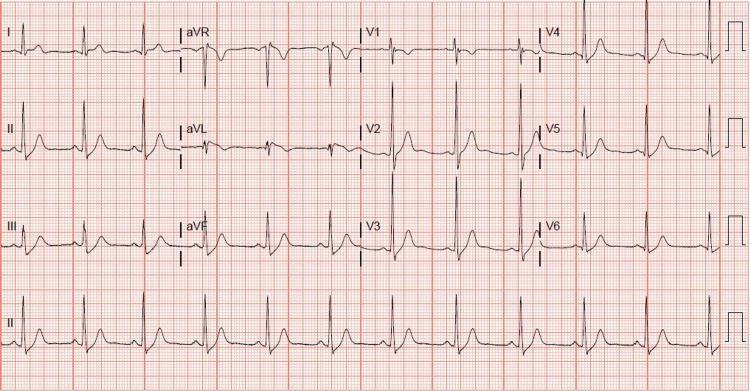
A standard 12-lead diagnostic electrocardiogram (ECG) showing a normal sinus rhythm with a heart rate of approximately 75 beats per minute. The image displays the limb leads (I, II, III, aVR, aVL, aVF) and precordial leads (V1-V6) on a standard grid. Key findings include: 1) Normal P-wave morphology preceding each QRS complex. 2) Narrow QRS complexes with normal axis and duration. 3) Isoelectric ST segments across all leads, notably lacking the coved or saddle-back ST-elevation characteristic of Brugada syndrome in leads V1 and V2. 4) Normal T-wave progression, with upright T waves in most leads and a typical inversion in lead aVR. This ECG represents a follow-up recording demonstrating the resolution of transient Brugada-pattern changes, returning to a normal baseline repolarization state.
synapse structure diagram chemical transmission
cardiac muscle action potential properties
ABO blood group transfusion reaction
middle ear ossicles anatomy tympanic membrane
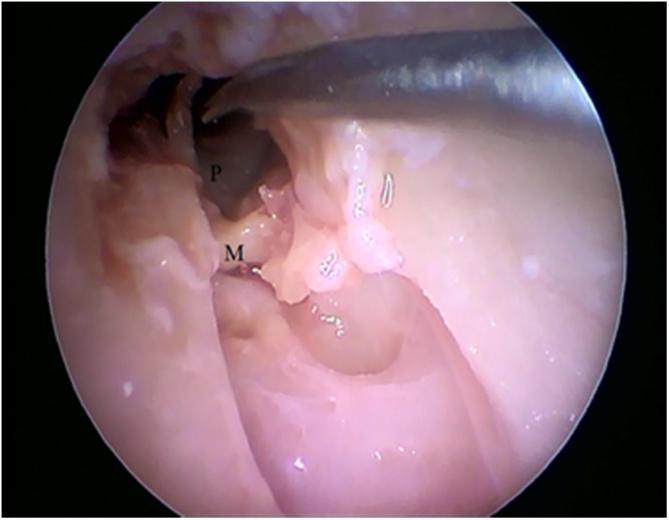
This clinical endoscopic photograph captures an intraoperative view of a middle ear dissection, specifically identifying the anatomical relationship between the ossicles and the medial wall. The promontory (labeled 'P'), which corresponds to the basal turn of the cochlea, is visible as a darker, rounded bony prominence on the medial wall of the tympanic cavity. The malleus (labeled 'M') is shown in a state of detachment, displaced from its normal anatomical position relative to the tympanic membrane and other ossicles. A surgical instrument is visible at the top of the frame, manipulating the tissue to expose the middle ear space. The surrounding mucosa appears moist and light pink, with some fibrous tissue remnants near the tympanic annulus. This image serves as an educational tool for understanding otologic surgical anatomy and the visual identification of middle ear landmarks during endoscopic procedures.
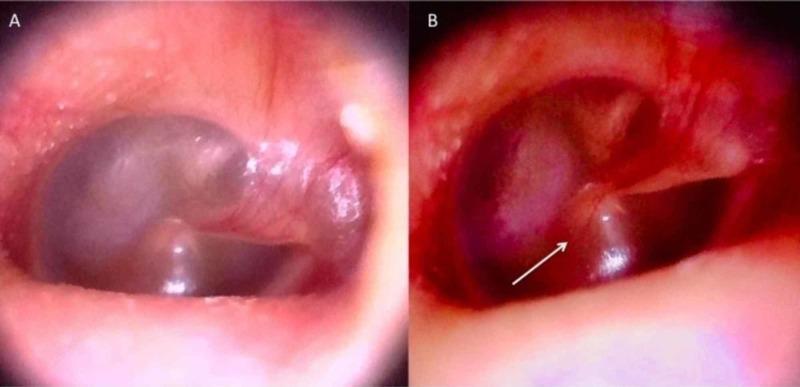
This side-by-side comparison chart presents two stills from a video otoscope demonstrating a normal versus a pathological tympanic membrane. Panel A displays a healthy tympanic membrane (TM), characterized by its translucent, pearly-gray appearance. Anatomical landmarks are clearly visible, including the lateral process and handle of the malleus (ossicles) through the intact, non-bulging membrane. Panel B serves as a clinical photograph of acute otitis media. The tympanic membrane exhibits significant pathological changes, including diffuse erythema (hyperemia) and a loss of translucency. There is distinct convex bulging of the membrane toward the examiner, indicative of middle ear effusion and pressure. A white arrow highlights a localized area of significant protrusion and inflammation. This comparison is an educational tool for medical professionals to distinguish between normal middle ear anatomy and common signs of inflammatory ear disease using modern diagnostic endoscopy.
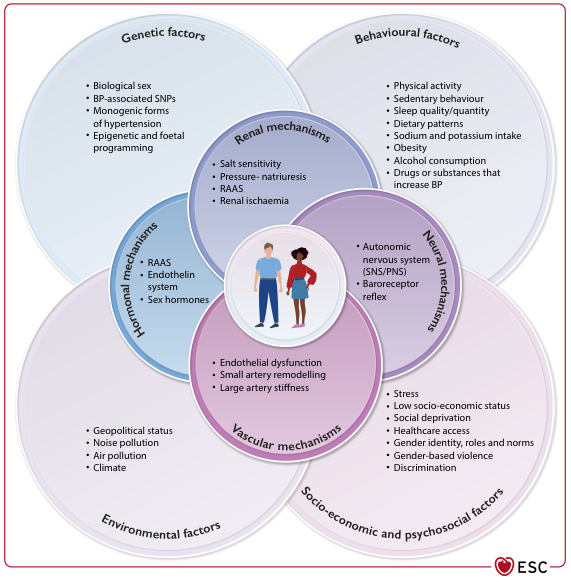
baroreceptor reflex blood pressure regulation
LONG ESSAYS - DETAILED ANSWERS
Q1. Name Four Ascending Tracts of the Spinal Cord. Trace the Pathway for Fine Touch
Four Main Ascending Tracts
| Tract | Location | Modality Carried |
|---|---|---|
| Posterior column (Dorsal column) | Posterior funiculus | Fine touch, proprioception, vibration, 2-point discrimination |
| Anterior spinothalamic tract | Anterior funiculus | Crude touch, pressure |
| Lateral spinothalamic tract | Lateral funiculus | Pain, temperature |
| Spinocerebellar tract (Dorsal + Ventral) | Lateral funiculus | Unconscious proprioception |
Pathway for Fine Touch (Posterior Column - Medial Lemniscal Pathway)
First-Order Neuron (Peripheral Receptor to Spinal Cord)
- Receptors: Meissner's corpuscles (fine touch), Pacinian corpuscles (vibration), muscle spindles (proprioception)
- Cell body: In the dorsal root ganglion
- Peripheral process goes to the skin/muscle
- Central process enters the spinal cord and ascends ipsilaterally in the posterior (dorsal) column WITHOUT synapsing
- Fibers from the lower limb travel in the fasciculus gracilis (medial)
- Fibers from the upper limb travel in the fasciculus cuneatus (lateral)
- These fibers ascend all the way to the medulla
Second-Order Neuron (Medulla to Thalamus)
- Synapse occurs in:
- Nucleus gracilis (for lower limb fibers)
- Nucleus cuneatus (for upper limb fibers)
- Both nuclei are in the lower medulla
- Axons from these nuclei cross the midline as internal arcuate fibers (decussation of the medial lemniscus)
- They ascend as the medial lemniscus through the brainstem (medulla, pons, midbrain)
- Synapse in the ventral posterolateral (VPL) nucleus of the thalamus
Third-Order Neuron (Thalamus to Cortex)
- From VPL nucleus, fibers travel via the posterior limb of the internal capsule
- Project to the primary somatosensory cortex (Areas 3, 1, 2 of postcentral gyrus)
- The body is represented in a somatotopic map (homunculus) - lower limb at the top/medial, face at the bottom/lateral
Summary of Decussation
- A lesion in the spinal cord on one side causes fine touch loss on the same side (ipsilateral)
- A lesion above the medulla causes fine touch loss on the opposite side (contralateral)
Q2. Describe in Detail the Properties of Cardiac Muscle
A. Electrical Properties
1. Rhythmicity (Automaticity)
- Cardiac muscle can generate its own impulses without any external nerve stimulation
- This is called autorhythmicity or automaticity
- The SA node (sinoatrial node) is the primary pacemaker with an intrinsic rate of 70-80 beats/min
- AV node fires at 40-60/min; His-Purkinje at 20-40/min
- This property is due to the funny current (If) - slow Na+ influx during diastole (phase 4 spontaneous depolarization)
2. Excitability
- Cardiac muscle responds to a stimulus by generating an action potential
- The threshold must be reached before an AP fires (all-or-nothing response)
- Unlike skeletal muscle, cardiac cells cannot be tetanized because of the long refractory period
3. Conductivity
- The impulse spreads from cell to cell via gap junctions (nexuses) present at intercalated discs
- This allows synchronized contraction of all cardiac cells - the heart acts as a functional syncytium
- Conduction velocity: SA node → Atria (1 m/s) → AV node (0.05 m/s - slowest, allows filling) → Bundle of His → Purkinje fibers (4 m/s - fastest) → Ventricular muscle (1 m/s)
4. Refractory Period
- Cardiac muscle has an unusually long refractory period (~250 ms for ventricles)
- Absolute refractory period (ARP): No stimulus, however strong, can re-excite the cell (corresponds to plateau phase of AP)
- Relative refractory period (RRP): A strong stimulus can elicit a new AP
- This long refractory period prevents tetanic contraction - essential for pumping function
- The effective refractory period = ARP + most of RRP
5. Cardiac Action Potential - 5 Phases
| Phase | Name | Ion Movement |
|---|---|---|
| Phase 0 | Rapid depolarization | Fast Na+ influx |
| Phase 1 | Initial repolarization | K+ efflux (Ito) |
| Phase 2 | Plateau | Ca2+ influx balances K+ efflux (unique to cardiac muscle) |
| Phase 3 | Rapid repolarization | K+ efflux |
| Phase 4 | Resting membrane potential | Background K+ leak |
B. Mechanical Properties
1. All-or-Nothing Law
- The entire heart contracts maximally or not at all
- Individual cells obey the all-or-nothing principle
2. Starling's Law (Frank-Starling Law)
- "The energy of contraction is proportional to the initial length of the cardiac muscle fiber"
- Increased ventricular filling (preload) → increased end-diastolic volume → increased fiber stretch → stronger contraction → increased stroke volume
- This allows the heart to automatically match output to venous return
3. Treppe Phenomenon (Bowditch Effect / Staircase)
- When the heart rate increases, successive contractions become progressively stronger
- Due to accumulation of intracellular Ca2+ with higher rates
4. Inability to Tetanize
- Due to the long refractory period, cardiac muscle cannot sustain tetanic contractions
- This is vital - a tetanized heart would stop pumping blood
5. Contractility
- The inotropic state - ability to develop force at a given fiber length
- Increased by: catecholamines, digitalis, increased heart rate (positive inotropy)
- Decreased by: acidosis, hypoxia, negative inotropes (beta-blockers, Ca2+ channel blockers)
6. Lusitropy
- The property of active relaxation of cardiac muscle
- Accelerated by sympathetic stimulation (positive lusitropic effect)
- Important for adequate ventricular filling in diastole
Q3. With a Labelled Diagram Explain the Neuromuscular Transmission
Definition
Structure of the NMJ
MOTOR NERVE TERMINAL
        |
   [Synaptic vesicles containing ACh]
   [Voltage-gated Ca2+ channels]
   [Active zones]
        |
   ~50-100 nm gap
   [Synaptic cleft - contains AChE]
        |
   [Junctional folds - nicotinic AChR clusters]
MUSCLE FIBER (End Plate Region)
- Presynaptic terminal (axon terminal): Contains synaptic vesicles packed with acetylcholine (ACh), mitochondria, voltage-gated Ca2+ channels
- Synaptic cleft: 50-100 nm gap filled with basement membrane containing acetylcholinesterase (AChE)
- Post-synaptic membrane (motor end plate): Has junctional folds to increase surface area; clusters of nicotinic ACh receptors (nAChR) at the crests of folds
Steps of Neuromuscular Transmission
Step 1 - Action Potential Arrives at Nerve Terminal
- A nerve AP travels down the motor axon and reaches the axon terminal
- The AP depolarizes the nerve terminal membrane
Step 2 - Ca2+ Influx into Nerve Terminal
- Depolarization opens voltage-gated Ca2+ channels (N-type) in the presynaptic membrane
- Ca2+ flows in along its electrochemical gradient
- Intracellular Ca2+ concentration rises from ~0.1 μM to ~100 μM
Step 3 - ACh Release (Exocytosis)
- Ca2+ binds to synaptotagmin (a calcium sensor protein) on synaptic vesicles
- This triggers vesicle fusion with the presynaptic membrane via SNARE proteins (synaptobrevin, syntaxin, SNAP-25)
- ACh is released by exocytosis into the synaptic cleft
- Each nerve impulse releases ~200-300 vesicles (quanta); each vesicle contains ~10,000 ACh molecules
Step 4 - ACh Binds to Nicotinic Receptors
- ACh diffuses across the synaptic cleft
- Binds to nicotinic AChRs (nAChR) on the post-junctional membrane
- nAChR is a ligand-gated ion channel (pentameric structure: 2α, β, γ/ε, δ)
- Binding of 2 ACh molecules to the α-subunits opens the channel
- Na+ flows in, K+ flows out - net inward current
Step 5 - End Plate Potential (EPP) Generation
- The inward current depolarizes the end plate region, generating an End Plate Potential (EPP)
- Normal EPP is ~50-70 mV (well above threshold of ~-55 mV)
- Safety factor for NMT: The EPP is ~3x larger than the threshold needed - ensures reliable transmission
Step 6 - Muscle Action Potential
- The EPP spreads electrotonically to adjacent sarcolemma
- Opens voltage-gated Na+ channels on the sarcolemma → muscle action potential
- AP propagates along the sarcolemma and into T-tubules
Step 7 - Termination of ACh Action
- ACh is rapidly hydrolyzed by acetylcholinesterase (AChE) in the synaptic cleft:
- ACh → Acetate + Choline
- Choline is actively taken back up into the nerve terminal (choline transporter)
- This terminates the EPP within milliseconds
Step 8 - Excitation-Contraction Coupling
- AP in T-tubules → activates dihydropyridine receptors (DHPR) voltage sensors
- DHPR mechanically activates ryanodine receptors (RyR) on the sarcoplasmic reticulum
- Ca2+ released from SR → binds troponin C → tropomyosin shift → actin-myosin cross-bridge cycling → muscle contraction
Drugs Acting at NMJ
| Drug | Mechanism | Effect |
|---|---|---|
| Succinylcholine | Persistent depolarization | Depolarizing block |
| Tubocurarine | Competitive ACh antagonist | Non-depolarizing block |
| Neostigmine | AChE inhibitor | Prolong ACh action |
| Botulinum toxin | Blocks SNARE, inhibits exocytosis | Paralysis |
| Organophosphates | Irreversible AChE inhibition | Cholinergic crisis |
Q4. Define Arterial Blood Pressure. Briefly Explain the Regulation of Arterial Blood Pressure
Definition
- Systolic BP (SBP): Maximum pressure during ventricular systole - normally ~120 mmHg
- Diastolic BP (DBP): Minimum pressure during ventricular diastole - normally ~80 mmHg
- Pulse pressure = SBP - DBP = 40 mmHg
- Mean arterial pressure (MAP) = DBP + 1/3 Pulse Pressure = ~93 mmHg
- Or MAP = CO × TPR (cardiac output × total peripheral resistance)
Regulation of Arterial Blood Pressure
A. Short-Term (Rapid) Regulation - Seconds to Minutes
1. Baroreceptor Reflex (Most Important Short-Term Mechanism)
- Baroreceptors (high-pressure mechanoreceptors) are located in:
- Carotid sinus (innervated by Hering's nerve → CN IX)
- Aortic arch (innervated by aortic nerve → CN X)
- When BP rises: Baroreceptors stretch → increased firing → signals to nucleus tractus solitarius (NTS) in medulla → inhibit sympathetic outflow, stimulate parasympathetic (vagal) outflow → HR decreases, vasodilation → BP falls back to normal
- When BP falls: Opposite occurs - decreased baroreceptor firing → sympathetic activation → vasoconstriction + increased HR → BP restored
- Responds within seconds - the most important acute regulator
- Resets with chronic hypertension (limitation for long-term control)
2. Chemoreceptor Reflex
- Peripheral chemoreceptors (carotid and aortic bodies): respond to hypoxia (pO2 < 80 mmHg), hypercapnia, and acidosis
- Central chemoreceptors (medulla): respond primarily to CO2/pH
- Hypoxia → chemoreceptor activation → sympathetic stimulation → vasoconstriction → increased BP
3. CNS Ischemic Response (Cushing Response)
- When cerebral blood flow falls severely (MAP < 60 mmHg) → profound sympathetic stimulation → massive vasoconstriction → BP rises dramatically to restore brain perfusion
- Most powerful vasopressor response; acts as a "last resort"
4. Other Rapid Mechanisms
- Veno-arteriolar reflex: Venous distension → local arteriolar constriction
- Atrial receptors (Bainbridge reflex): Atrial stretch → increased HR (positive chronotropy)
- Capillary fluid shift: With sudden BP rise, fluid moves out of capillaries → reduces blood volume
B. Intermediate-Term Regulation - Minutes to Hours
1. Renin-Angiotensin-Aldosterone System (RAAS)
- Low renal perfusion → Juxtaglomerular cells release renin
- Renin cleaves angiotensinogen → Angiotensin I
- ACE (in lungs) converts Ang I → Angiotensin II
- Ang II effects:
- Potent vasoconstriction (raises TPR)
- Stimulates aldosterone release from adrenal cortex → Na+ and water retention → increased blood volume
- Stimulates ADH (vasopressin) release → water retention
- Sympathetic potentiation
2. Capillary Fluid Shift Mechanism
- With sustained low BP: fluid shifts from interstitium into capillaries → increases plasma volume → raises BP
- Acts over 30-60 minutes
3. Vasopressin (ADH)
- Released from posterior pituitary in response to:
- Increased plasma osmolarity (primary stimulus)
- Low BP/volume (secondary stimulus)
- Acts on V1 receptors → vasoconstriction
- Acts on V2 receptors in kidney → water reabsorption
4. Stress-Relaxation Response of Blood Vessels
- Vessels adapt to sustained stretch - vessel wall gradually relaxes → reduces vascular resistance
C. Long-Term Regulation - Hours to Days (Most Important for Chronic BP Control)
Kidney and Renal-Body Fluid Mechanism (Most important long-term regulator - Guyton)
- Pressure natriuresis and diuresis: When BP rises → kidneys excrete more Na+ and water → blood volume decreases → CO decreases → BP falls back to normal
- When BP falls → kidneys retain Na+ and water → volume increases → BP rises
- This mechanism sets the "long-term operating point" for BP
- RAAS modulates this set point (aldosterone shifts the pressure-natriuresis curve)
Hypertension Pathways (Failure of Long-Term Regulation)
- Essential hypertension: Rightward shift of pressure-natriuresis curve → kidney retains Na+ at higher pressures
Summary Table: BP Regulation
| Mechanism | Time Course | Primary Effect |
|---|---|---|
| Baroreceptor reflex | Seconds | HR, CO, TPR |
| Chemoreceptor reflex | Seconds | TPR |
| CNS ischemic response | Seconds | Massive vasoconstriction |
| Intermediate RAAS | Minutes-hours | Volume, TPR |
| Aldosterone | Hours | Na+ retention, volume |
| ADH/Vasopressin | Minutes-hours | Volume, vasoconstriction |
| Renal fluid pressure | Days | Blood volume |
Q5. Define Synapse. Discuss the Properties of Synapse
Definition
- Presynaptic terminal (axon terminal/bouton) - contains synaptic vesicles with neurotransmitter
- Synaptic cleft - 20-40 nm gap
- Postsynaptic membrane - contains receptors for neurotransmitter
Properties of Synapse
1. One-Way (Unidirectional) Conduction
- Transmission occurs only from presynaptic → postsynaptic direction
- This is because neurotransmitter vesicles are only in the presynaptic terminal and receptors are only on the postsynaptic side
- Ensures orderly and directed flow of information in neural circuits
2. Synaptic Delay
- There is a delay of 0.5-1 ms (synaptic delay) at each synapse compared to impulse conduction along nerve fibers
- Due to time needed for: Ca2+ influx, vesicle docking, neurotransmitter release, diffusion across cleft, and receptor binding
- The number of synapses in a pathway can be estimated from the total synaptic delay
3. Summation
- A single EPSP is usually insufficient to fire a postsynaptic neuron
- Temporal summation: Repeated stimulation of the same presynaptic terminal in rapid succession - EPSPs add up over time
- Spatial summation: Simultaneous stimulation of multiple presynaptic terminals - EPSPs from different sources add together
- Both forms of summation allow sub-threshold inputs to summate and fire the postsynaptic neuron
4. Post-Tetanic Potentiation (PTP)
- After a burst of high-frequency stimulation (tetanus), subsequent stimuli produce a larger than normal EPSP for minutes to hours
- Due to residual intracellular Ca2+ in the presynaptic terminal → increased NT release
- A form of short-term synaptic plasticity
5. Synaptic Fatigue (Wedensky Inhibition)
- With rapid, sustained stimulation, synaptic transmission becomes progressively less effective and eventually fails
- Due to depletion of the readily releasable pool of synaptic vesicles
- Helps prevent excessive neural activity (e.g., seizure termination)
6. Occlusion
- When two presynaptic neurons share some common postsynaptic neurons, and both are stimulated simultaneously, the total response is less than the sum of individual responses
- Because some postsynaptic neurons are already activated by both inputs (overlapping fields)
7. Subliminal Fringe (Facilitation)
- Some postsynaptic neurons receive input that is sub-threshold (not enough to fire) but partially depolarized - they are in the subliminal fringe
- Adding another subthreshold input can push them over threshold
- Results in facilitation - a larger response when two inputs arrive together vs. separately
8. After-Discharge
- A single stimulus may produce prolonged postsynaptic activity lasting longer than the stimulus
- Due to reverberating circuits (closed-loop neuronal circuits) and reverberating activity
9. Effect of CO2 and Hypoxia
- Hypercapnia (increased CO2) and hypoxia increase synaptic excitability
- This is because CO2 increases extracellular H+ → K+ efflux → partial depolarization → closer to threshold
10. Effect of Drugs and Ions
- Acidosis: Decreases synaptic excitability
- Alkalosis: Increases synaptic excitability (tetany in hyperventilation)
- Ca2+ deficiency (hypocalcemia): Increases excitability → tetany
- Mg2+ excess: Decreases excitability - blocks Ca2+ channels at presynaptic terminal
- Strychnine: Blocks inhibitory glycine receptors → excessive excitability
- Anesthetics: Decrease synaptic transmission
11. Convergence and Divergence
- Convergence: Multiple presynaptic neurons synapse on one postsynaptic neuron - allows integration of signals from many sources
- Divergence: One presynaptic neuron synapses on many postsynaptic neurons - amplifies and distributes information
Q6. Classify Synapses and Describe Their Properties
Classification of Synapses
A. Based on Mechanism of Transmission
1. Chemical Synapses
- Most synapses in the CNS and PNS are chemical
- Transmission via release of neurotransmitter molecules
- Characteristics:
- Unidirectional transmission
- Synaptic delay (0.5-1 ms)
- Neurotransmitter released into synaptic cleft (20-40 nm wide)
- Can be excitatory or inhibitory
- Subject to modulation by drugs
- Susceptible to fatigue
- Show plasticity (LTP, LTD)
- Examples: All NMJ synapses, most CNS synapses
2. Electrical Synapses (Gap Junctions)
- Also called electrotonic synapses or nexuses
- Transmission via direct flow of ionic current through connexin protein channels (gap junctions)
- Characteristics:
- Bidirectional (can transmit in both directions)
- No synaptic delay (essentially instantaneous)
- No neurotransmitter needed
- Cleft width only 3.5 nm (much narrower than chemical)
- Not amenable to pharmacological modulation
- Highly reliable transmission
- Examples: Cardiac muscle (intercalated discs), smooth muscle, certain CNS interneurons, retinal horizontal cells
B. Based on Site of Contact (Morphological Classification)
| Type | Presynaptic contacts | Location |
|---|---|---|
| Axodendritic | Axon terminal → dendrite | Most common in CNS |
| Axosomatic | Axon terminal → cell body | Common - inhibitory synapses often here |
| Axoaxonic | Axon terminal → another axon | Presynaptic inhibition/facilitation |
| Dendrodendritic | Dendrite → dendrite | Lateral inhibition (retina, olfactory bulb) |
| Somatodendritic | Cell body → dendrite | Rare |
| Somatosomatic | Cell body → cell body | Rare |
C. Based on Functional Effect
1. Excitatory Synapses
- Neurotransmitter causes depolarization of postsynaptic membrane
- Produces Excitatory Post-Synaptic Potential (EPSP)
- Due to increased permeability to Na+ and K+ (net inward current)
- Brings membrane potential closer to threshold (-55 mV)
- Neurotransmitters: Glutamate (main CNS excitatory NT), ACh, aspartate
- Morphology: Often have round synaptic vesicles, asymmetric membrane thickening (Gray Type I)
2. Inhibitory Synapses
- Neurotransmitter causes hyperpolarization or stabilization of postsynaptic membrane
- Produces Inhibitory Post-Synaptic Potential (IPSP)
- Due to increased permeability to K+ (efflux) or Cl- (influx) - both make interior more negative
- Moves membrane potential away from threshold
- Neurotransmitters: GABA (main CNS inhibitory NT), glycine, dopamine (sometimes)
- Morphology: Often have flat/pleomorphic vesicles, symmetric thickening (Gray Type II)
- Types of inhibition:
- Post-synaptic inhibition: Direct IPSP on postsynaptic cell
- Pre-synaptic inhibition: Axoaxonic synapse reduces NT release from another axon terminal (GABA-A Cl- channel → partial depolarization → less AP → less NT release)
- Lateral inhibition: Inhibitory interneurons suppress adjacent neurons (sharpens contrast - important in sensory processing)
- Recurrent inhibition (Renshaw cell): Collateral of motor neuron activates Renshaw cell → feeds back to inhibit the same motor neuron → prevents excessive firing
D. Based on Neurotransmitter Type
| Category | Neurotransmitter | Receptor Types |
|---|---|---|
| Cholinergic | Acetylcholine | Nicotinic (ionotropic), Muscarinic (metabotropic) |
| Glutamatergic | Glutamate | AMPA, NMDA, Kainate (ionotropic); mGluR (metabotropic) |
| GABAergic | GABA | GABA-A (ionotropic Cl-), GABA-B (metabotropic K+) |
| Glycinergic | Glycine | Glycine receptor (Cl- channel) |
| Dopaminergic | Dopamine | D1-D5 (all metabotropic) |
| Noradrenergic | Norepinephrine | α, β adrenoceptors (metabotropic) |
| Serotonergic | Serotonin | 5-HT1-7 (mostly metabotropic; 5-HT3 ionotropic) |
E. En Passant Synapses
- Some synaptic boutons are located along the length of the axon (varicosities), not just at the terminal
- Common in autonomic nervous system
- Allow one axon to contact multiple postsynaptic targets
Q7. What Are the Physiological Actions of Cortisol? How Is Its Secretion Regulated?
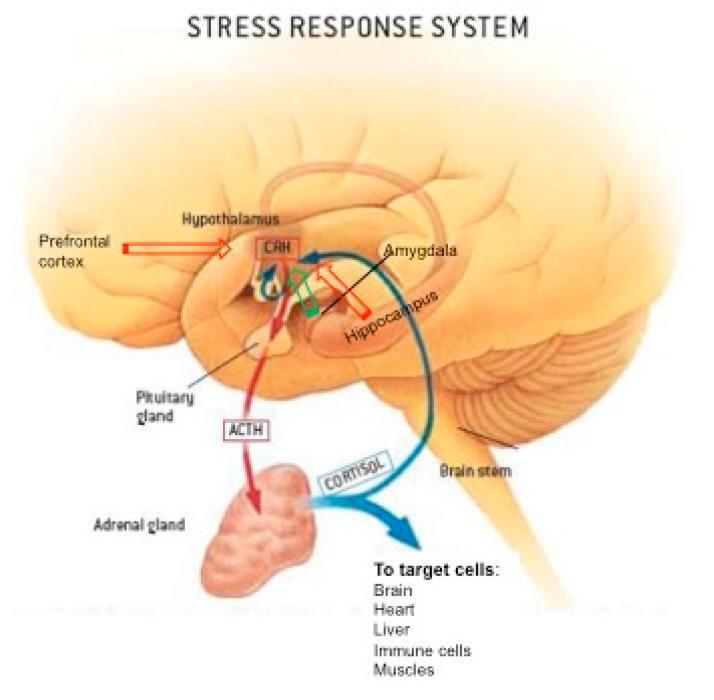
Introduction
Physiological Actions of Cortisol
1. Carbohydrate Metabolism (Hyperglycemic Effect)
- Stimulates gluconeogenesis in liver (major effect) - induces enzymes like PEPCK, glucose-6-phosphatase
- Inhibits glucose uptake by peripheral tissues (muscle, fat) - anti-insulin effect (insulin resistance)
- Stimulates glycogen synthesis in liver (glycogen deposition)
- Net effect: Raises blood glucose - hence termed "glucocorticoid"
- Opposes insulin action → can cause steroid-induced diabetes with excess
2. Protein Metabolism (Catabolic Effect)
- Increases protein catabolism in muscle, skin, bone, lymphoid tissue
- Amino acids mobilized → liver → used for gluconeogenesis
- Inhibits protein synthesis peripherally
- Clinical effects of excess: muscle wasting, thin skin, poor wound healing, osteoporosis (bone matrix protein breakdown)
3. Fat Metabolism (Lipolytic Effect)
- Stimulates lipolysis - free fatty acids released from fat cells
- Fat redistributed in Cushing's syndrome:
- Central (truncal) obesity
- Buffalo hump (upper back)
- Moon face
- Loss of fat in limbs (thin limbs)
- Stimulates appetite
4. Anti-Inflammatory Actions (Major Clinical Significance)
- Inhibits phospholipase A2 (via lipocortin/annexin-1) → reduces synthesis of arachidonic acid → reduces prostaglandins, thromboxanes, leukotrienes
- Inhibits COX-2 expression
- Reduces capillary permeability → less edema
- Inhibits mast cell degranulation, reduces histamine release
- Suppresses the production of inflammatory cytokines (IL-1, IL-6, TNF-α)
- Stabilizes lysosomal membranes
5. Immunosuppressive Actions
- Reduces lymphocyte count (lymphocytopenia) - redistributes lymphocytes to lymphoid tissue
- Decreases eosinophils (eosinopenia)
- Increases neutrophil count (neutrophilia) and decreases neutrophil chemotaxis
- Inhibits T-cell activation and antibody production
- Promotes apoptosis of lymphocytes
6. Cardiovascular Effects
- Maintains vascular tone and blood pressure - "permissive effect" on catecholamines
- Upregulates α-adrenergic receptors on vessels → supports vascular reactivity
- Increases cardiac output
- Adrenal insufficiency → hypotension (due to loss of this permissive effect)
7. Renal (Mineralocorticoid-like) Effects
- At high concentrations, cortisol acts on mineralocorticoid receptors
- Promotes Na+ retention and K+ excretion (though much weaker than aldosterone)
- Increases GFR and renal blood flow
8. Effects on Bone
- Decreases osteoblast activity, increases osteoclast activity → osteoporosis with excess
- Inhibits intestinal Ca2+ absorption (anti-vitamin D effect)
- Increases urinary Ca2+ excretion
9. CNS Effects
- Affects mood, cognition, sleep
- Moderate levels: euphoria, increased cognition
- Excess: anxiety, depression, psychosis, insomnia
- Deficiency: depression, fatigue
10. Effects on Blood
- Neutrophilia (increased neutrophils, decreased chemotaxis)
- Lymphocytopenia (lymphopenia)
- Eosinopenia (one of the earliest signs of cortisol excess)
- Erythrocytosis (increases RBC production)
- Thrombocytosis
11. Stress Response
- Essential for survival during stress ("stress hormone")
- Mobilizes energy substrates (glucose, fatty acids, amino acids)
- Maintains BP during stress
- Permissive effect on catecholamines - without cortisol, epinephrine actions are blunted
12. Fetal Development
- Promotes maturation of fetal lung surfactant (given to premature infants as betamethasone)
- Promotes maturation of GI tract
Regulation of Cortisol Secretion - HPA Axis
Step 1: Hypothalamus
- Releases Corticotropin-Releasing Hormone (CRH) from the parvocellular neurons of the paraventricular nucleus (PVN)
- CRH travels via the hypophyseal portal system to the anterior pituitary
- Also stimulated by: AVP (ADH), which potentiates CRH action
Step 2: Anterior Pituitary
- CRH acts on corticotroph cells → release of ACTH (Adrenocorticotropic hormone)
- ACTH is derived from a large precursor protein POMC (proopiomelanocortin)
- POMC → ACTH + β-lipotropin (and β-endorphin, MSH from same precursor)
Step 3: Adrenal Cortex
- ACTH acts on MC2R (melanocortin-2 receptor) on zona fasciculata cells
- Activates adenylate cyclase → cAMP → PKA → phosphorylation of enzymes involved in steroidogenesis
- Acute effect: Mobilizes cholesterol from lipid droplets to mitochondria (via StAR protein)
- Chronic effect: Upregulates steroidogenic enzymes, causes adrenal hypertrophy
- Result: Cortisol secreted into circulation
Negative Feedback (Most Important Regulatory Mechanism)
- Cortisol feeds back negatively at:
- Hypothalamus (decreases CRH release)
- Anterior pituitary (decreases ACTH release - most sensitive site)
- Two types:
- Fast feedback (seconds to minutes): Membrane-mediated, non-genomic
- Slow feedback (hours to days): Genomic - decreases POMC gene transcription
Diurnal (Circadian) Rhythm
- Cortisol shows a diurnal rhythm:
- Highest in early morning (around 8 AM) - helps prepare body for the day
- Lowest in late evening/midnight
- Driven by the suprachiasmatic nucleus (SCN) → alters CRH/ACTH pattern
- Disrupted by: jet lag, shift work, chronic stress, Cushing's syndrome (loss of diurnal rhythm)
Stress Response Override
- Physical and psychological stress can override feedback inhibition
- Amygdala (fear/stress) → activates hypothalamic PVN → CRH release
- Hippocampus and prefrontal cortex provide inhibitory inputs
- This is why cortisol rises dramatically during infection, surgery, trauma, or psychological stress
Q8. Describe a Normal ECG in Lead 2
Introduction
Normal ECG Waves, Intervals, and Segments in Lead II
1. P Wave
- Represents atrial depolarization (mainly left atrial)
- Morphology in Lead II: Upright (positive), smooth, rounded
- Amplitude: < 0.25 mV (2.5 mm) in height
- Duration: 0.08-0.10 sec (≤ 2 small squares)
- Axis: +60° (upright in lead II confirms normal sinus origin)
- Followed by a P-R interval before the QRS
2. PR Interval
- Measured from the beginning of P wave to beginning of QRS
- Represents time for impulse to travel from SA node → AV node → Bundle of His → bundle branches
- Normal duration: 0.12-0.20 sec (3-5 small squares)
- Prolonged (>0.20 sec) = 1st degree AV block
- Shortened (<0.12 sec) = pre-excitation syndrome (WPW), junctional rhythm
3. QRS Complex
- Represents ventricular depolarization
- In Lead II, normally shows:
- Q wave: Small initial negative deflection (septal depolarization, left to right)
- R wave: Tall positive deflection (main ventricular activation)
- S wave: Terminal negative deflection (activation of basal portions of ventricle)
- Duration: 0.06-0.10 sec (< 3 small squares)
- Amplitude: R wave typically 5-15 mm in lead II
- Wide QRS (>0.12 sec) = bundle branch block or ventricular ectopy
4. ST Segment
- From end of QRS (J-point) to beginning of T wave
- Represents the period of uniform ventricular depolarization (corresponds to plateau of AP)
- Normally isoelectric (flat, at baseline)
- Normal range: ± 1 mm from baseline
- ST elevation (>1 mm): STEMI, pericarditis, Prinzmetal angina
- ST depression: NSTEMI, unstable angina, LVH, digoxin effect
5. T Wave
- Represents ventricular repolarization
- In Lead II: Upright (positive), asymmetric (gradual upstroke, faster downstroke)
- Amplitude: 0.1-0.5 mV; should be > 1/8 and < 2/3 of preceding R wave
- Duration: Varies; roughly 0.1-0.25 sec
- Inverted T in lead II = abnormal (ischemia, RV strain, etc.)
6. QT Interval
- From beginning of Q wave to end of T wave
- Represents total ventricular activity (depolarization + repolarization)
- Normal QTc (corrected for heart rate by Bazett's formula): ≤ 440 ms in men, ≤ 450 ms in women
- Prolonged QTc = risk of Torsades de Pointes (drugs, hypocalcemia, hypothyroidism, congenital LQTS)
7. U Wave (sometimes visible in Lead II)
- Small positive deflection after T wave
- Represents repolarization of Purkinje fibers (or mid-myocardial M cells)
- Prominent U waves = hypokalemia, bradycardia
- Inverted U = ischemia
8. TP Segment
- From end of T wave to beginning of next P wave
- Represents electrical diastole - the baseline reference
Summary Table - Normal ECG Values (Lead II)
| Component | Normal Value |
|---|---|
| P wave amplitude | < 2.5 mm (0.25 mV) |
| P wave duration | 0.08-0.10 sec |
| PR interval | 0.12-0.20 sec |
| QRS duration | 0.06-0.10 sec |
| ST segment | Isoelectric ± 1 mm |
| T wave | Upright, <5 mm |
| QTc | ≤ 440 ms (men), ≤ 450 ms (women) |
| Heart rate (normal) | 60-100 bpm |
ECG Paper and Calibration
- Standard paper speed: 25 mm/sec
- Small square: 1 mm = 0.04 sec (horizontally), 0.1 mV (vertically)
- Large square (5 small): 5 mm = 0.20 sec; 0.5 mV
- Normal HR calculation: 300 ÷ (number of large squares between R-R intervals)
Q9. Enumerate Antigens and Antibodies of ABO System. What Will Be the Sequence of Events in a Mismatched Blood Transfusion
ABO Blood Group System
ABO Antigens and Antibodies
| Blood Group | Antigen on RBC | Antibody in Plasma | Can Receive From | Can Donate To |
|---|---|---|---|---|
| A | A antigen | Anti-B (IgM) | A, O | A, AB |
| B | B antigen | Anti-A (IgM) | B, O | B, AB |
| AB | A and B antigens | Neither anti-A nor anti-B | A, B, AB, O (universal recipient) | AB only |
| O | Neither A nor B (has H antigen) | Anti-A and Anti-B (IgM) | O only | A, B, AB, O (universal donor) |
H Antigen
- All ABO groups carry the H antigen (formed by fucosyltransferase enzyme adding fucose to a precursor)
- A and B genes modify H antigen:
- Group A: GalNAc added to H → A antigen
- Group B: Galactose added to H → B antigen
- Group O: No enzyme added → H antigen remains unchanged (highest H antigen)
- Bombay phenotype (Oh): Rare group lacking H antigen → anti-H antibody (incompatible with all ABO groups)
Nature of ABO Antibodies
- Anti-A and Anti-B: Primarily IgM (naturally occurring, complement-fixing)
- IgM antibodies are very efficient at activating the classical complement pathway
- This is why ABO incompatibility causes the most severe (and often fatal) transfusion reactions
Sequence of Events in a Mismatched (ABO Incompatible) Blood Transfusion
Example: Group A blood transfused to Group B recipient
Phase 1: Antibody-Antigen Interaction (Immediate - Seconds to Minutes)
- Donor Group A RBCs enter the recipient's circulation
- Recipient's preformed anti-A IgM antibodies bind to A antigens on donor RBCs
- Each IgM molecule can bind multiple RBCs → agglutination (clumping) of donor RBCs occurs
- Agglutinated RBC clusters can block small blood vessels → microvascular obstruction
Phase 2: Complement Activation (Minutes)
- IgM bound to RBC surfaces activates the classical complement pathway:
- C1q binds to Fc regions of IgM → activates C1r, C1s
- C4, C2 cleaved → form C3 convertase
- C3 cleaved → C3b (opsonin) deposits on RBC surface
- C5 cleaved → C5b → initiates Membrane Attack Complex (MAC) formation
- MAC (C5b-9) inserts into RBC membrane → pores form → intravascular hemolysis
- Free hemoglobin is released into plasma (hemoglobinemia)
Phase 3: Intravascular Hemolysis (Minutes to Hours)
- Hemoglobinemia: Free Hgb in plasma → turns plasma pink/red
- Haptoglobin binds free Hgb → becomes saturated → free Hgb spills into urine
- Hemoglobinuria: Red/dark ("port wine" colored) urine - characteristic sign
- Hemolytic anemia: Rapid fall in hemoglobin levels
Phase 4: Inflammatory Mediator Release (Concurrent)
- Complement fragments (C3a, C4a, C5a - anaphylatoxins) are released
- C5a is a potent neutrophil chemoattractant → neutrophil activation → cytokine storm
- Mast cell degranulation (due to C3a, C5a) → histamine, serotonin release → vasodilation, increased vascular permeability
- IL-1, TNF-α, IL-6 released → systemic inflammatory response
Phase 5: Clinical Manifestations
| System | Features |
|---|---|
| General | Fever, chills, rigors (often FIRST signs) |
| Cardiovascular | Hypotension, tachycardia (due to vasodilation + hemolysis) |
| Renal | Acute renal failure (most serious complication) |
| Hematologic | Hemoglobinemia, hemoglobinuria ("cola-colored" urine), jaundice (rising bilirubin) |
| Coagulation | DIC (Disseminated Intravascular Coagulation) |
| Respiratory | Dyspnea |
| Local | Burning/pain at transfusion site |
| In anesthetized patients | Unexplained hypotension, hemoglobinuria, bleeding from wounds (DIC) |
Mechanism of Acute Renal Failure
- Free Hgb in plasma → oxidized to methemoglobin → ferrihemate (toxic to renal tubules)
- Direct tubular toxicity → acute tubular necrosis (ATN)
- Vasoconstrictive effect of free Hgb (scavenges nitric oxide) → renal ischemia
- Complement-mediated and cytokine-induced renal vasoconstriction
- Hemoglobin casts obstruct tubules
Phase 6: DIC (Disseminated Intravascular Coagulation)
- Activation of coagulation cascade by:
- RBC stroma (cell membrane contents) released → activate tissue factor
- Cytokines (TNF-α, IL-1) upregulate tissue factor on endothelium
- Widespread microvascular thrombosis → organ ischemia
- Consumption of clotting factors → secondary bleeding
- Result: Paradoxically both clotting and bleeding simultaneously
Management
- STOP the transfusion immediately (most important first step)
- Maintain IV access, supportive care
- IV fluids to maintain urine output > 1 mL/kg/hr (protect kidneys)
- Monitor for DIC - give FFP, platelets if needed
- Send blood for repeat cross-matching, Coombs test, cultures
- Treat anaphylaxis if present (epinephrine, antihistamines, steroids)
- Dialysis if renal failure develops
Q10. Functions of Middle Ear
Anatomy Overview
Functions of the Middle Ear
1. Impedance Matching (Most Important Function)
- Sound waves travel through air to reach the tympanic membrane
- The cochlea (inner ear) is filled with fluid (perilymph)
- Sound going from air (low impedance) to fluid (high impedance) would normally lose 99.9% of energy (a 30 dB loss) due to impedance mismatch - most sound energy would be reflected back
- The tympanic membrane area ≈ 55 mm²
- The stapes footplate area ≈ 3.2 mm²
- Area ratio = 55/3.2 ≈ 17:1
- Same force applied over a smaller area = much greater pressure
- This amplifies pressure by 17-fold
- The malleus handle is longer than the long process of incus
- Lever ratio ≈ 1.3:1
- This provides an additional mechanical advantage
- Total pressure amplification = 17 × 1.3 = 22-fold (≈ 25-30 dB)
- This overcomes the air-fluid impedance mismatch almost completely
2. Sound Conduction (Ossicular Chain)
- Pathway of sound conduction: Sound waves → Tympanic membrane (vibration) → Malleus handle → Incus (long process) → Stapes footplate → Oval window → Perilymph of scala vestibuli → Cochlea
- The three ossicles (malleus, incus, stapes) are articulated at the incudomalleolar joint and incudostapedial joint (synovial joints)
- The ossicular chain transmits vibrations with minimal energy loss across a wide frequency range (20-20,000 Hz)
3. Acoustic Reflex (Stapedius and Tensor Tympani Muscles)
- Smallest skeletal muscle in the body
- Innervated by the facial nerve (CN VII)
- Contracts in response to loud sounds (>75 dB)
- Pulls stapes posteriorly → stiffens ossicular chain → reduces sound transmission by 10-15 dB
- Protects cochlea from loud sounds (though it has a 25-50 ms delay, so it cannot protect against sudden loud sounds like gunshots)
- Innervated by the trigeminal nerve (CN V3 - medial pterygoid nerve)
- Pulls the malleus inward → tenses tympanic membrane
- Primarily contracts during swallowing and speaking (self-vocalization)
- Also slightly protective against low-frequency sounds
4. Equalization of Pressure (Eustachian Tube Function)
- Connects the middle ear to the nasopharynx
- Opens during swallowing and yawning → equalizes air pressure in the middle ear with atmospheric pressure
- Maintains normal middle ear pressure essential for proper tympanic membrane and ossicular vibration
- Dysfunction (e.g., in colds, allergies) → negative pressure in middle ear → retracted tympanic membrane → conductive hearing loss
5. Protection and Drainage
- The middle ear mucosa secretes small amounts of mucus
- Eustachian tube drains secretions to the nasopharynx
- Mastoid air cells act as an air reservoir to buffer middle ear pressure changes
6. Bone Conduction Enhancement
- The ossicles also play a role in bone conduction by transmitting vibrations that come through the skull to the cochlea
Summary: Middle Ear Function at a Glance
| Function | Mechanism | Clinical Significance |
|---|---|---|
| Impedance matching | Area ratio + lever action | Core hearing function |
| Sound conduction | Ossicular chain | Conductive hearing (damage → conductive hearing loss) |
| Protection (acoustic reflex) | Stapedius, tensor tympani | Noise-induced hearing protection |
| Pressure equalization | Eustachian tube | Ensures normal tympanic membrane position |
| Drainage | Eustachian tube | Prevents effusion and infection |
Clinical Correlations
- Otosclerosis: Fixation of stapes footplate at oval window → impairs ossicular movement → conductive hearing loss (treated with stapedectomy)
- Otitis media: Inflammation/effusion in middle ear → impedes ossicular movement → conductive hearing loss
- Ossicular discontinuity (trauma, chronic ear disease): Loss of impedance-matching function → severe conductive hearing loss (>50 dB)
- Patulous Eustachian tube: Stays open persistently → patient hears own breathing and voice (autophony)