Ecg learning
Reading File
Finding Sources
Searching the Web
ECG electrocardiogram learning guide basics interpretation 2025
Searching Images
ECG electrocardiogram normal sinus rhythm waveform labeled diagram
Reading File
Finding Sources
Loading Image
Loading Image
Reading File
Reading File
Loading Image
Searching Images
12-lead ECG placement chest leads limb leads anatomy diagram
Loading Image
Finding Sources
Searching Images
ST elevation myocardial infarction STEMI ECG 12 lead
Loading Image
Searching Images
heart block first degree second degree third degree AV block ECG rhythm strip
Loading Image
I now have comprehensive material from Harrison's, Medical Physiology, and Miller's Anesthesia, plus excellent images. Here is a complete ECG learning guide:
📟 ECG Learning Guide
Sources: Harrison's Principles of Internal Medicine 22e, Medical Physiology (Boron & Boulpaep), Miller's Anesthesia 10e
1. What is an ECG?
An electrocardiogram (ECG) is a surface recording of the electrical potential differences generated by the heart. It reflects every step of the cardiac conduction cycle — from the sinoatrial (SA) node firing to ventricular repolarization.
2. The ECG Paper & Calibration
ECG paper has two grids:
| Box size | Time | Voltage |
|---|---|---|
| Small box (1 mm) | 0.04 s | 0.1 mV |
| Large box (5 mm) | 0.20 s | 0.5 mV |
5 large boxes = 1 second.
Quick heart rate formula: Rate = 300 ÷ (number of large boxes in R-R interval)
- 1 box → 300 bpm | 2 → 150 | 3 → 100 | 4 → 75 | 5 → 60 | 6 → 50
3. The Normal ECG Waveform
The Wiggers diagram below shows exactly how the ECG waveform relates to mechanical events of the cardiac cycle:
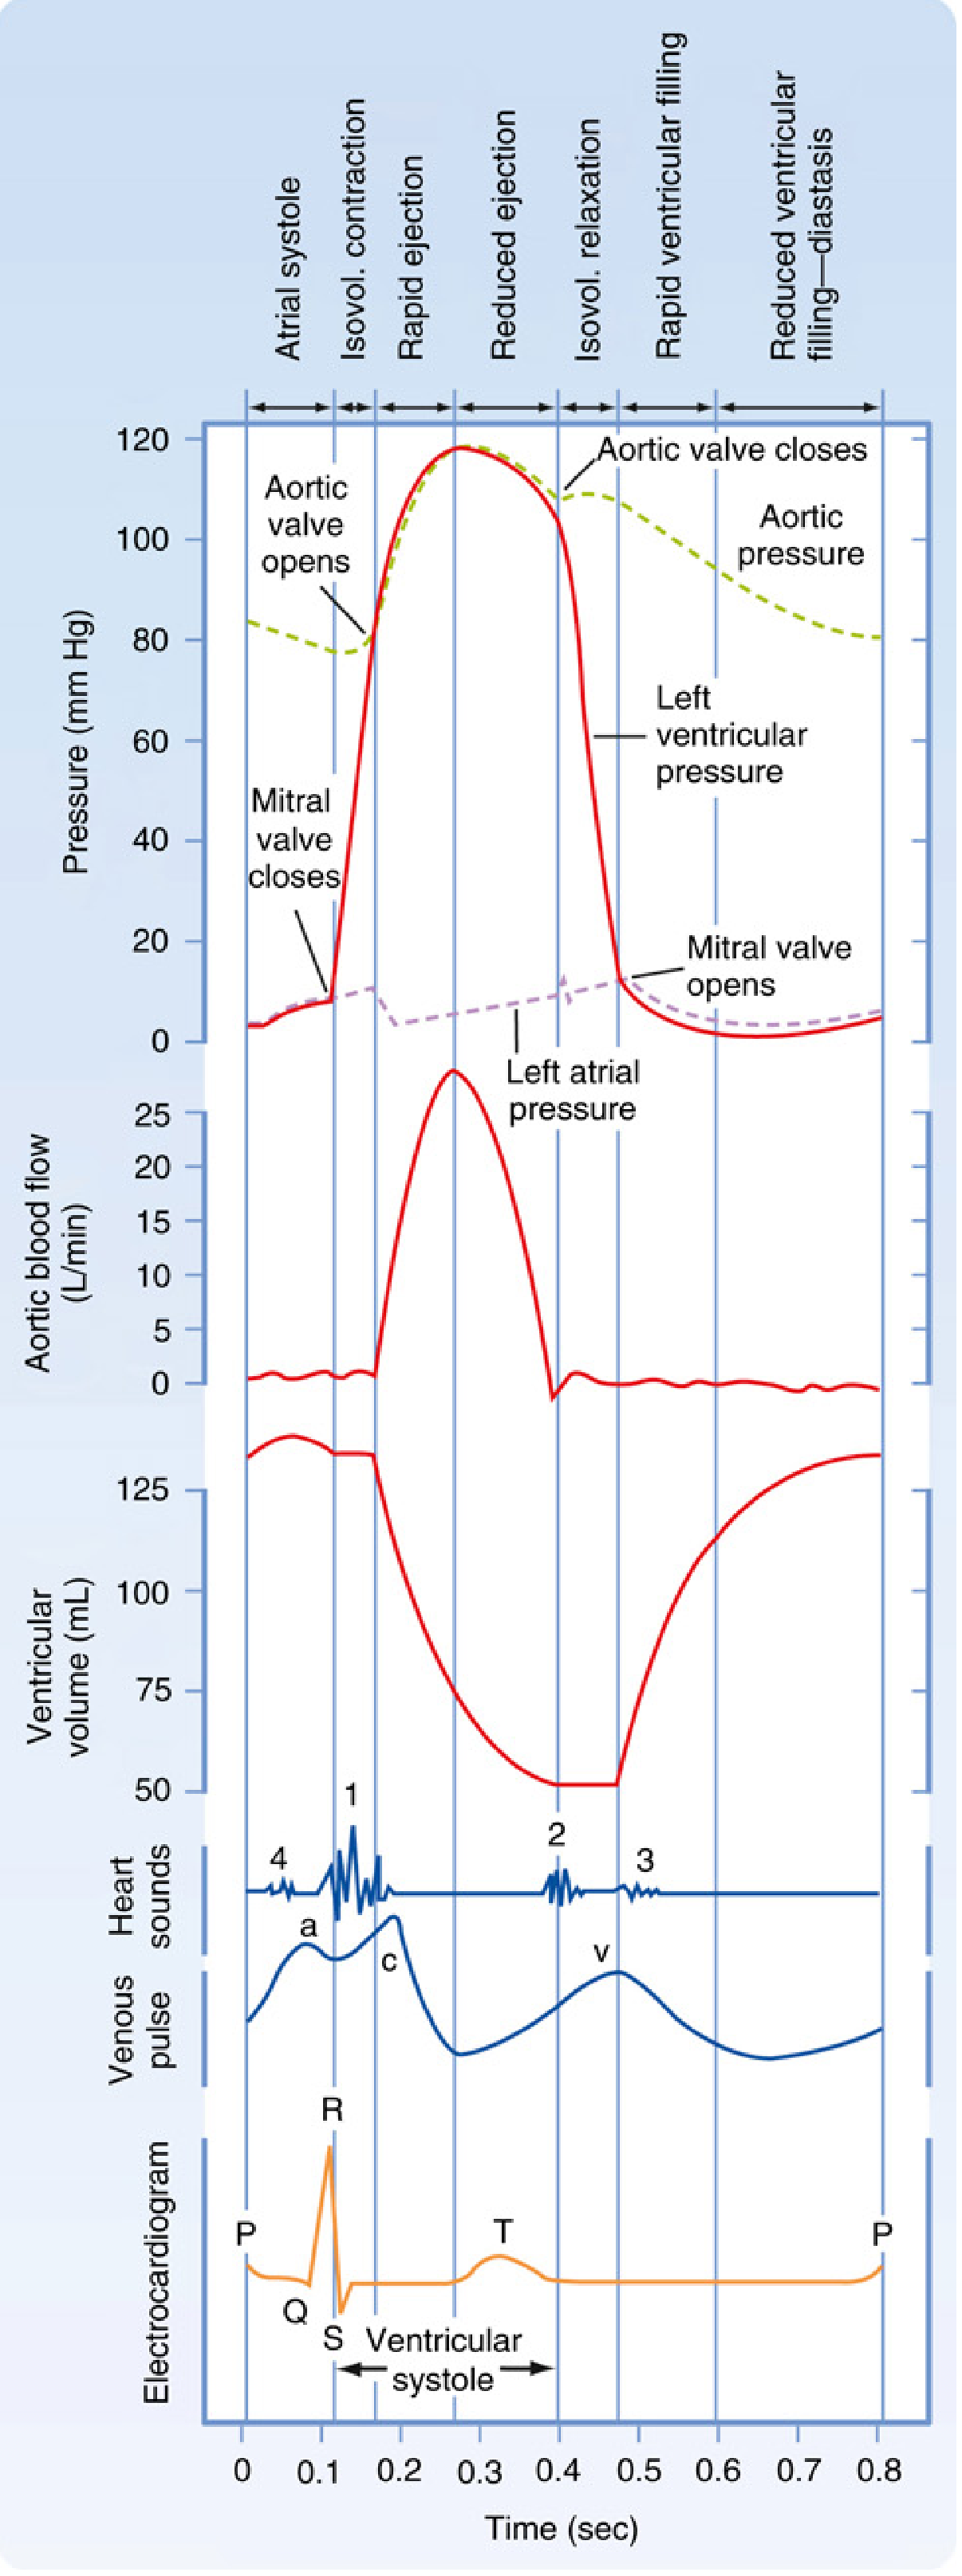
The Waves Explained
| Wave/Interval | Represents | Normal Duration |
|---|---|---|
| P wave | Atrial depolarization (SA node → atria) | < 0.12 s (3 small boxes) |
| PR interval | AV node conduction delay | 0.12–0.20 s (3–5 small boxes) |
| QRS complex | Ventricular depolarization | < 0.12 s (3 small boxes) |
| ST segment | Ventricular plateau (early repolarization) | Isoelectric (flat) |
| T wave | Ventricular repolarization | Upright in I, II, V2–V6 |
| QT interval | Total ventricular action potential | Varies with rate (QTc < 0.44 s) |
| U wave | Papillary muscle / slow repolarization | Small, same direction as T |
Key physiology:
- The P wave = SA node fires → impulse travels through atria via internodal tracts
- The PR interval = deliberate AV node delay (gives ventricles time to fill)
- The QRS = depolarization down the His bundle → left and right bundle branches → Purkinje fibers → ventricular myocardium
- The T wave = ventricular repolarization (note: depolarization is Q→S; repolarization is T)
(Medical Physiology, Box 21-2)
4. The 12-Lead System
A standard ECG uses 10 electrodes to create 12 views of the heart.
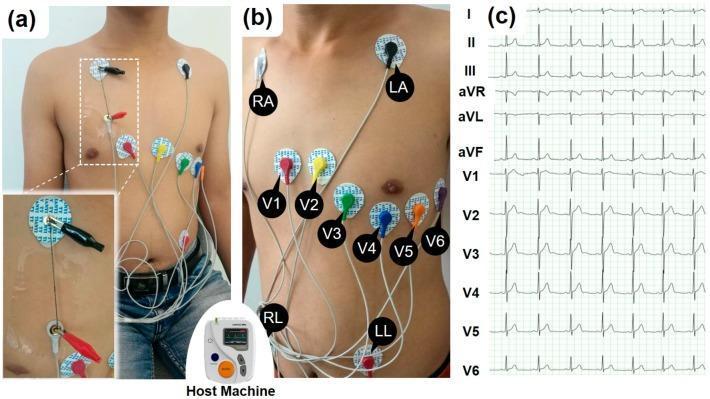
Precordial (Chest) Lead Positions
| Lead | Position |
|---|---|
| V1 | 4th intercostal space, right sternal border |
| V2 | 4th intercostal space, left sternal border |
| V3 | Between V2 and V4 |
| V4 | 5th intercostal space, midclavicular line |
| V5 | Anterior axillary line (same level as V4) |
| V6 | Midaxillary line (same level as V4) |
Limb Leads & What They "See"
| Lead Group | Leads | Wall of Heart |
|---|---|---|
| Inferior | II, III, aVF | Inferior wall (RCA territory) |
| Lateral | I, aVL, V5, V6 | Lateral wall (LCx territory) |
| Anterior | V1–V4 | Anterior wall (LAD territory) |
| Reciprocal | aVR | Global — expected to be negative |
5. Systematic Interpretation — The 14-Step Approach
(Harrison's Principles of Internal Medicine 22e)
Always analyze in this order to avoid errors of omission:
- Standardization / calibration (1 mV = 10 mm? Any artifacts or lead misplacement?)
- Rhythm (regular/irregular? P before every QRS?)
- Heart rate (use the 300-rule above)
- PR interval (AV conduction — normal 0.12–0.20 s)
- QRS interval (< 0.12 s = narrow = normal; ≥ 0.12 s = wide = bundle branch block)
- QT / QTc interval (prolonged QT → torsades risk)
- Mean QRS electrical axis (normal −30° to +90°)
- P waves (size, shape, duration)
- QRS voltages (high = LVH; low = pericardial effusion/obesity)
- Precordial R-wave progression (should grow from V1→V5)
- Abnormal Q waves (> 1 small box wide or > ¼ R height = pathological)
- ST segments (elevation or depression)
- T waves (inversion, hyperacute changes)
- U waves (prominent in hypokalemia)
Always compare with previous ECGs — this is invaluable.
6. Heart Rate & Rhythm
Normal Sinus Rhythm vs Atrial Fibrillation
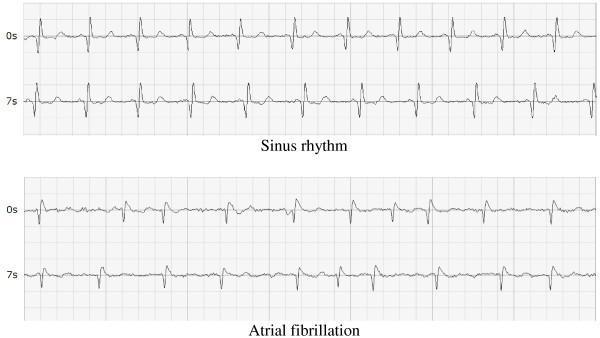
Normal Sinus Rhythm: Regular R-R intervals, P wave before every QRS, rate 60–100 bpm.
Atrial Fibrillation: Irregularly irregular rhythm, no discernible P waves, fibrillatory baseline, variable R-R intervals.
7. AV Blocks (Heart Blocks)
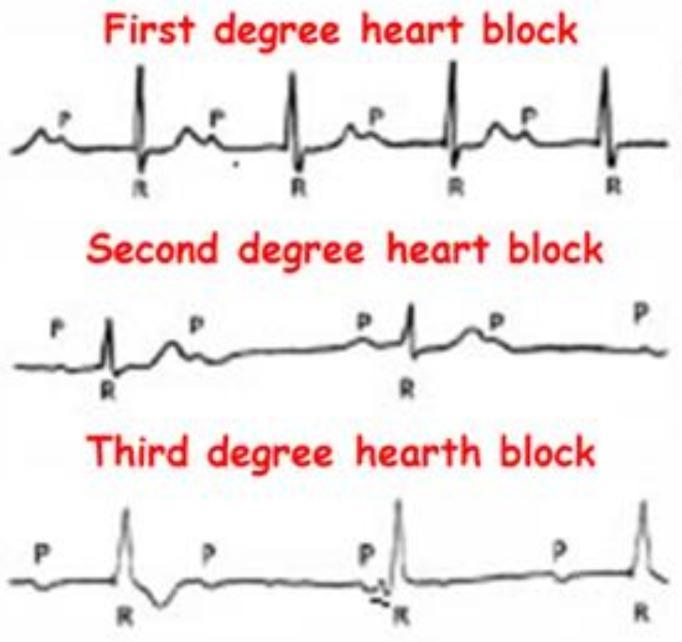
| Block | ECG Finding | Clinical Significance |
|---|---|---|
| 1st degree | PR interval > 0.20 s (5 small boxes), every P conducts | Usually benign |
| 2nd degree Mobitz I (Wenckebach) | PR progressively lengthens until a QRS is dropped | AV node disease; often reversible |
| 2nd degree Mobitz II | Constant PR, then sudden dropped QRS | His-Purkinje disease; needs pacing |
| 3rd degree (complete) | P waves and QRS complexes completely dissociated; separate independent rates | Medical emergency; pacemaker required |
8. ST Changes — Ischemia & Infarction
STEMI (ST-Elevation MI)
STEMI criteria (from Tintinalli's Emergency Medicine):
- ≥ 1 mm ST elevation in ≥ 2 contiguous limb leads, OR
- ≥ 2 mm ST elevation in ≥ 2 contiguous precordial leads
Localization by leads:
| Leads with STE | Infarct Location | Culprit Artery |
|---|---|---|
| V1–V4 | Anterior | LAD |
| V1–V6 + I, aVL | Anterolateral | Proximal LAD |
| II, III, aVF | Inferior | RCA (or LCx) |
| I, aVL, V5–V6 | Lateral | LCx |
| Posterior (tall R in V1–V2, ST depression) | Posterior | RCA/LCx |
Reciprocal changes (ST depression in opposite leads) strongly support true STEMI.
9. Key Intervals at a Glance
Normal ECG Intervals
┌────────────────────────────────────────────────────┐
│  PR interval:    0.12 – 0.20 s                     │
│  QRS duration:   < 0.12 s                          │
│  QT interval:    0.35 – 0.44 s (rate-dependent)    │
│  QTc (Bazett):   < 0.44 s (men) / < 0.46 s (women)│
│  Normal axis:    −30° to +90°                      │
│  Heart rate:     60 – 100 bpm                      │
└────────────────────────────────────────────────────┘
10. Common Patterns Summary
| Pattern | Key ECG Feature |
|---|---|
| Normal sinus rhythm | Regular, P→QRS→T, rate 60–100 |
| Sinus bradycardia | Same as above, rate < 60 |
| Sinus tachycardia | Same as above, rate > 100 |
| Atrial fibrillation | Irregularly irregular, no P waves |
| Atrial flutter | Regular sawtooth P waves at ~300/min, 2:1 or 4:1 block |
| SVT (AVNRT) | Narrow QRS tachycardia, P waves hidden in/after QRS |
| VT | Wide QRS tachycardia (≥ 0.12 s), AV dissociation |
| VF | Chaotic, no identifiable complexes — cardiac arrest |
| LBBB | Wide QRS, dominant S in V1, broad notched R in V5–V6 |
| RBBB | Wide QRS, RSR' (rabbit ears) in V1 |
| LVH | Sokolow-Lyon: S(V1) + R(V5 or V6) > 35 mm |
| Hyperkalaemia | Peaked T waves → wide QRS → sine wave pattern |
| Long QT | QTc > 440 ms — risk of torsades de pointes |
| Pericarditis | Diffuse saddle-shaped ST elevation, PR depression |
Learning Resources
- Life in the Fast Lane ECG Library — free, case-based, comprehensive
- ECG Wave-Maven (Harvard BIDMC) — 1000+ practice ECGs with answers
- ACLS Medical Training ECG Basics — beginner-friendly overview
- Harrison's Principles of Internal Medicine 22e, Chapter 247 — The Electrocardiogram
- Medical Physiology (Boron & Boulpaep), Chapter 21 — Box 21-2
Start with rhythm and rate, then work through the 14 steps systematically. Pattern recognition comes with practice — aim to read at least 5–10 ECGs daily using a free online library like ECG Wave-Maven.
This is a shared conversation. Sign in to Orris to start your own chat.