I now have excellent, comprehensive content from authoritative textbooks. Let me compile the complete study guide.
Bile Metabolism and Its Clinical Significance
Sources: Sleisenger & Fordtran's Gastrointestinal and Liver Disease, Harper's Illustrated Biochemistry, Medical Physiology (Boron & Boulpaep), Tietz Textbook of Laboratory Medicine, Harrison's Principles of Internal Medicine 22E
1. Overview: What Is Bile?
Bile is a complex fluid secreted by the liver containing:
- Bile acids (primary drivers of bile flow)
- Bile pigments (mainly bilirubin)
- Cholesterol, phospholipids (especially phosphatidylcholine)
- Electrolytes, water, glutathione
- Conjugated metabolites and xenobiotics
Its two major functions are lipid digestion/absorption (via micellar solubilization) and hepatic excretion of waste products (bilirubin, drugs, heavy metals).
2. Bile Acid Synthesis
2.1 From Cholesterol to Primary Bile Acids
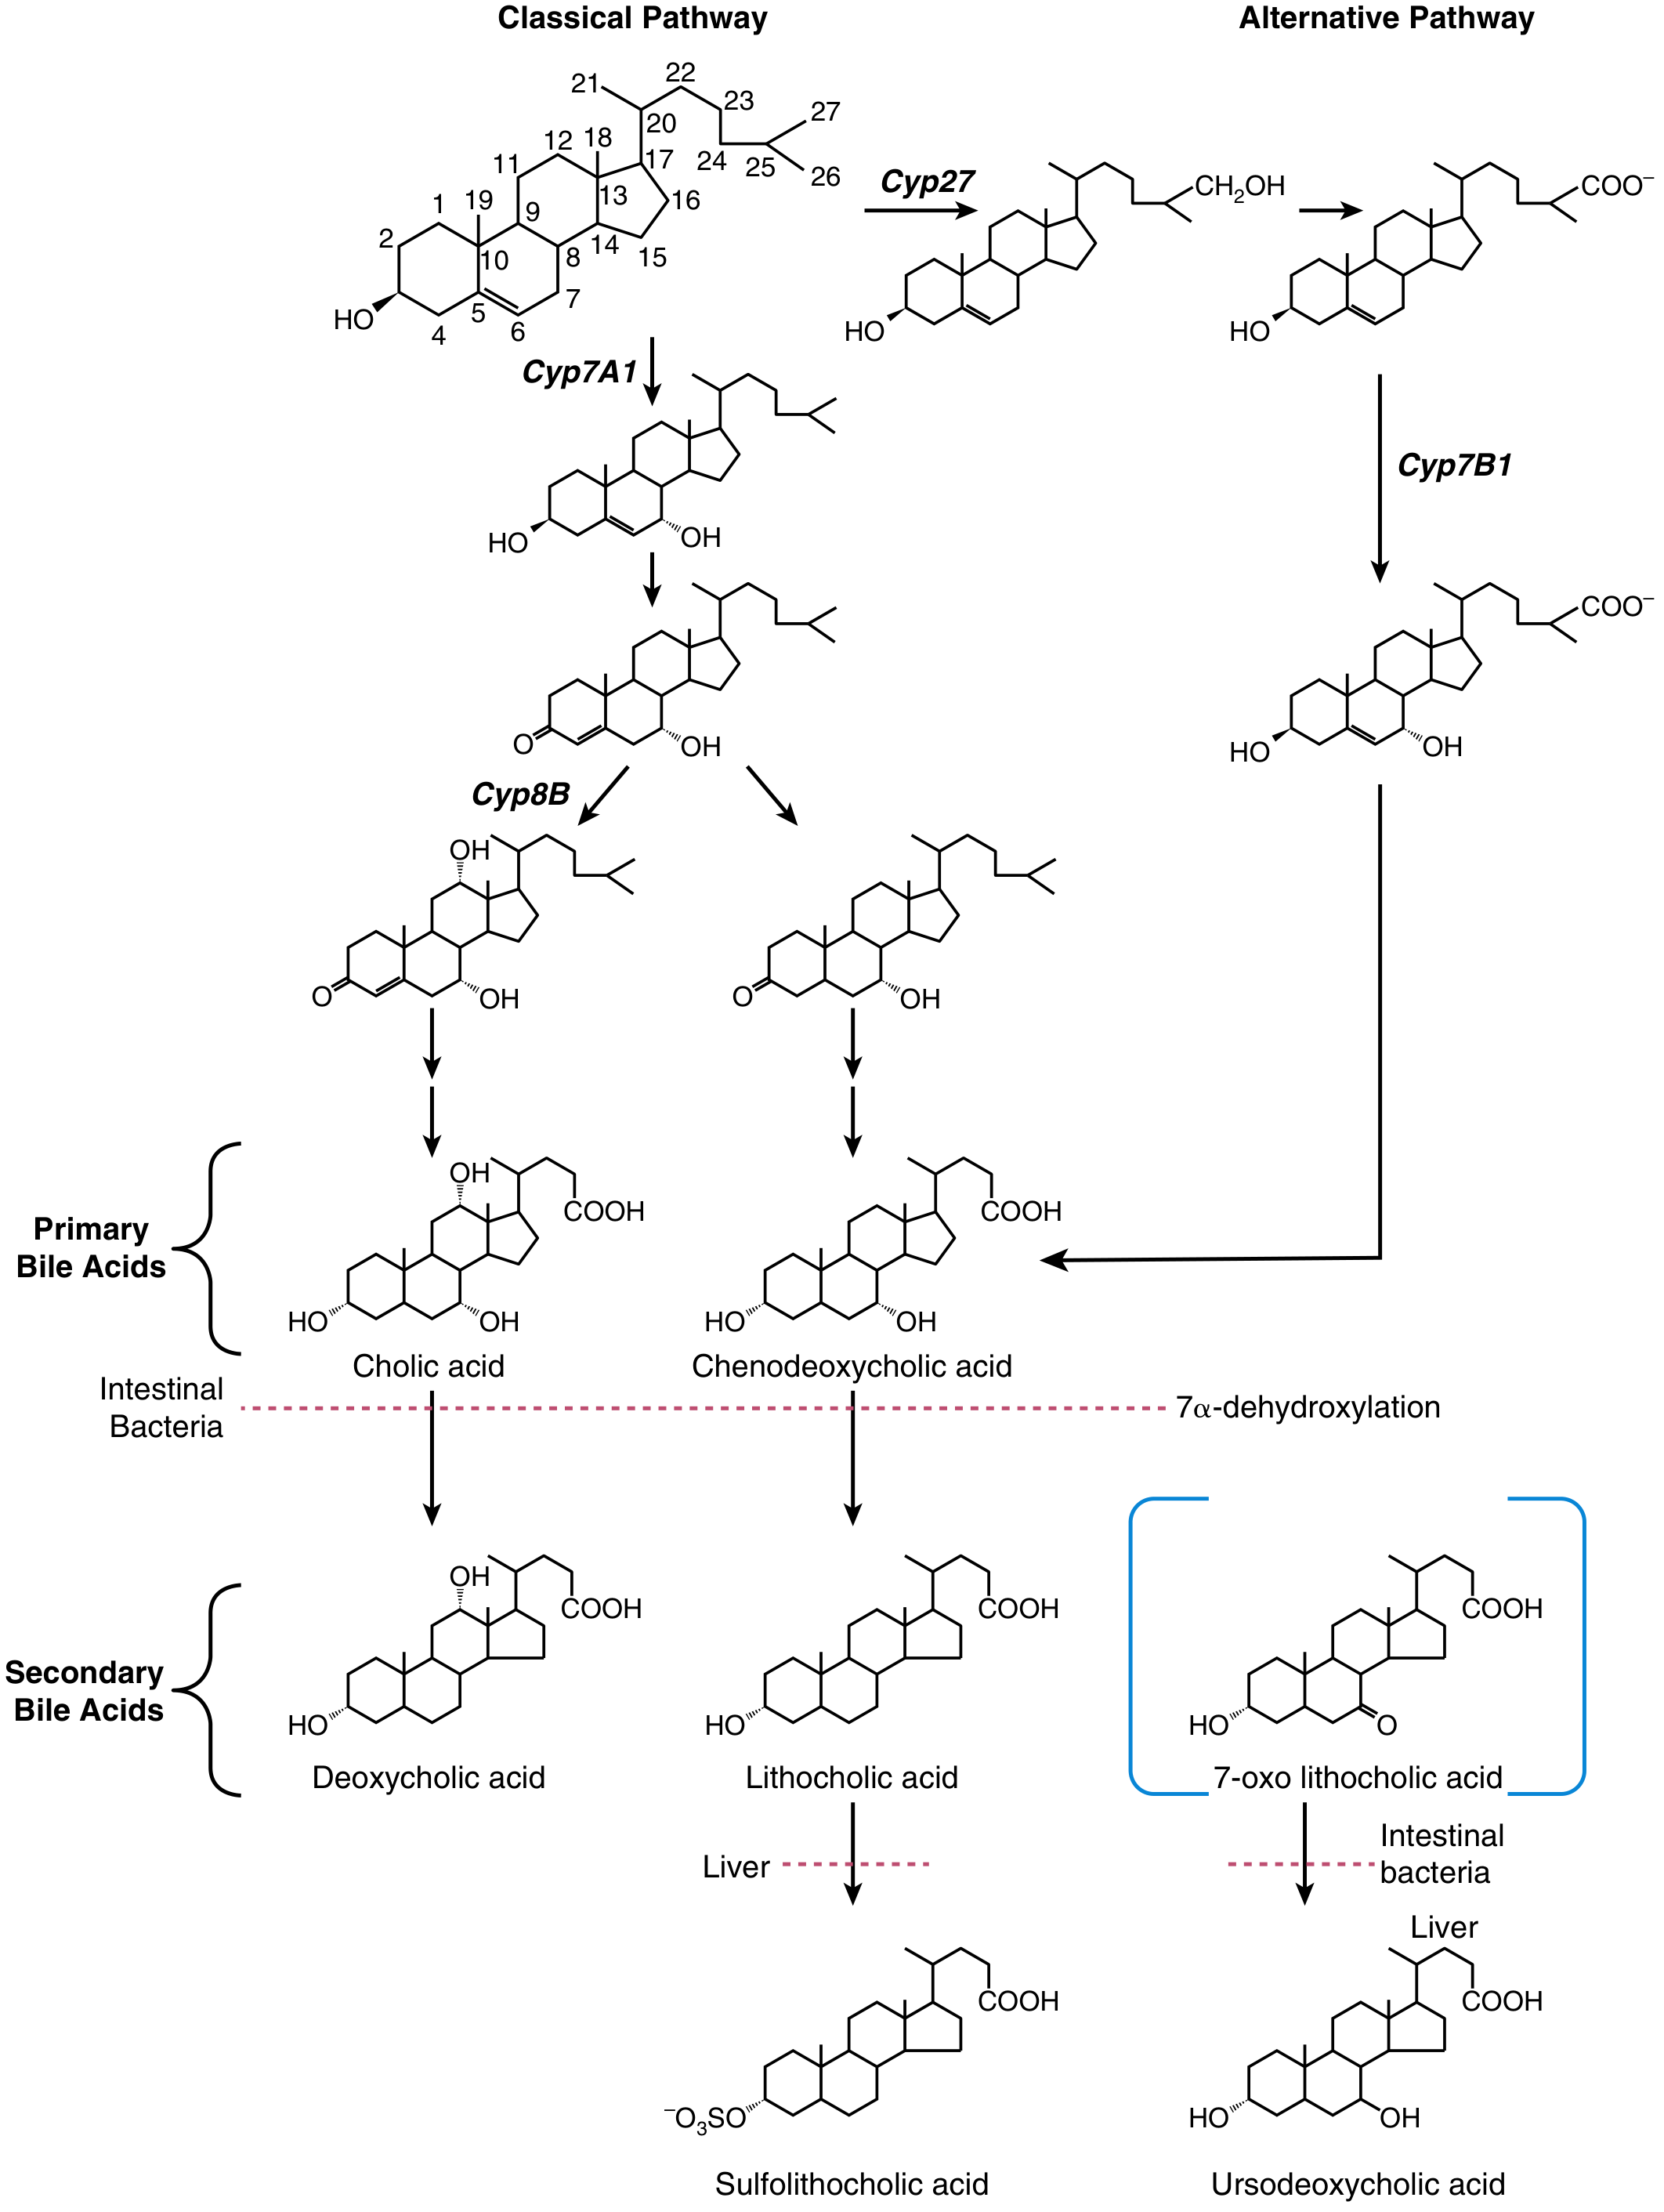
Bile acids are synthesized from cholesterol in pericentral hepatocytes. There are two major pathways:
Figure: Bile acid synthesis. Classical (CYP7A1/CYP8B1) and alternative (CYP27/CYP7B1) pathways; primary bile acids and their bacterial transformation to secondary forms. - Sleisenger & Fordtran, Fig. 64.2
| Pathway | Rate-limiting enzyme | Favors |
|---|
| Classical (neutral) | CYP7A1 (cholesterol 7α-hydroxylase) | Cholic acid (CA) - trihydroxy |
| Alternative (acidic) | CYP27A1 → CYP7B1 (oxysterol 7α-hydroxylase) | Chenodeoxycholic acid (CDCA) - dihydroxy |
- Cholic acid (CA): Hydroxyl groups at C-3, C-7, C-12 (trihydroxy)
- Chenodeoxycholic acid (CDCA): Hydroxyl groups at C-3, C-7 (dihydroxy)
- These are called primary bile acids
Normal synthesis: 0.2-0.6 g/day; can be induced to 4-6 g/day after small bowel resection. - Sleisenger & Fordtran, p. 1201
2.2 Pool Size and Kinetics
| Bile acid | Pool size (mg) | Hepatic synthesis (mg/day) |
|---|
| Cholic acid | 500-1500 | 120-400 |
| Chenodeoxycholic acid | 700-1200 | 100-200 |
| Deoxycholic acid (secondary) | 500-1000 | - |
2.3 Conjugation (Amidation)
Before secretion, both CA and CDCA are N-acyl amidated with glycine or taurine:
| Conjugate | pKa |
|---|
| Unconjugated bile acid | 5.0 |
| Glycine conjugate | 3.9 |
| Taurine conjugate | 2.0 |
Why this matters: Conjugation converts a weak acid to a strong acid, decreasing passive diffusion across membranes, ensuring bile acids stay in the intestinal lumen for effective fat digestion. Conjugated forms are more resistant to calcium precipitation and remain soluble at acidic pH. - Sleisenger & Fordtran, p. 1202
3. Secondary Bile Acid Formation (Gut Microbiota)
In the colon, intestinal bacteria perform 7α-dehydroxylation on primary bile acids:
- Cholic acid → Deoxycholic acid (DCA)
- Chenodeoxycholic acid → Lithocholic acid (LCA)
Additional bacterial transformations:
- Deconjugation (removal of glycine/taurine)
- Epimerization of 3α- and 7α-hydroxyl groups
- Hepatic reduction yields ursodeoxycholic acid (UDCA) from 7-oxo lithocholic acid
LCA is highly cytotoxic and is largely sulfated (by liver and kidney) to form sulfolithocholic acid for fecal excretion. - Tietz Textbook, p. 1973
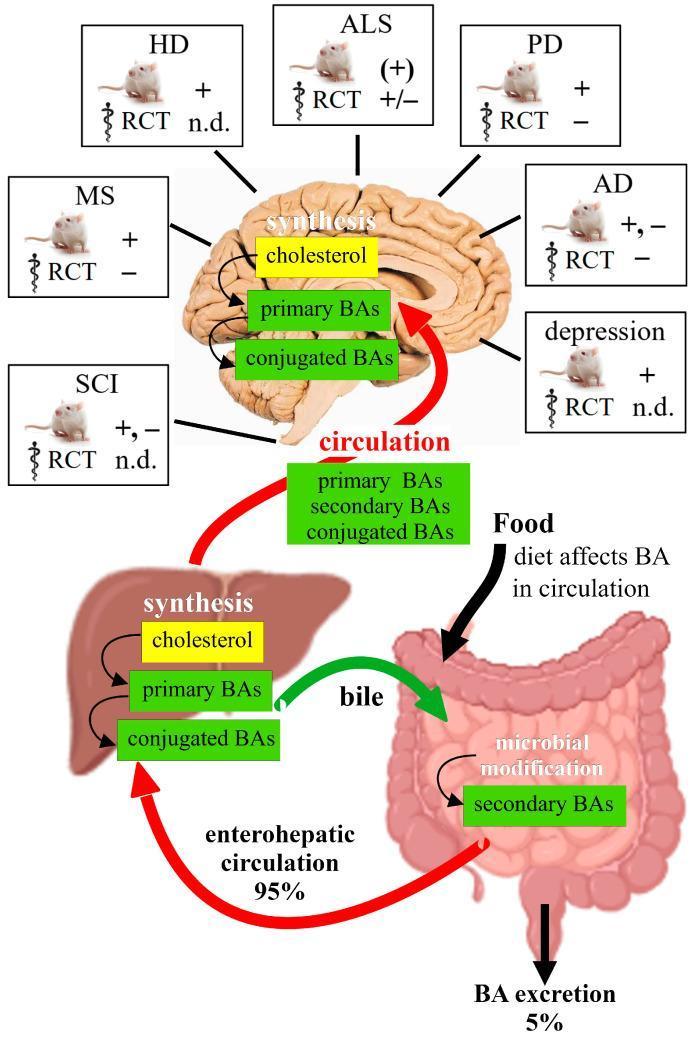
4. The Enterohepatic Circulation
This is the cyclical movement of bile acids between the liver and intestine - one of the most efficient recycling systems in the body.
Steps:
- Hepatic secretion - Conjugated bile acids are actively pumped into bile canaliculi via BSEP (ABCB11) - the bile salt export pump
- Gallbladder storage - Bile is concentrated ~5-20x
- Postprandial release - CCK triggers gallbladder emptying into duodenum
- Intestinal function - Bile acids form mixed micelles with cholesterol, phospholipids, free fatty acids, monoglycerides; critical micellar concentration ~2 mmol/L
- Ileal reabsorption - Active transport via ASBT (SLC10A2) in terminal ileum absorbs ~95% of bile acids
- Portal return - Via portal blood to liver
- Hepatic re-uptake - Via NTCP (SLC10A1) (Na+-dependent, >80% of conjugated) and OATP1B1/OATP1B3 (Na+-independent)
"The presence of an ileal active transport system and enterohepatic circulation dissociates hepatic bile acid secretion from bile acid synthesis, thereby improving the efficiency of intestinal nutrient digestion and absorption." - Sleisenger & Fordtran, p. 1205
Efficiency: ~95% of secreted bile acids are reabsorbed each cycle; only ~0.1-0.6 g/day lost in feces (replaced by new synthesis). The pool circulates 2-3 times per meal and up to 6-10 times per day.
5. Regulation of Bile Acid Synthesis
The FXR-FGF19 axis governs negative feedback:
| Signal | Mechanism |
|---|
| FXR activation in ileal enterocytes | Induces FGF19 secretion |
| FGF19 (portal circulation) | Acts on hepatic β-klotho/FGFR4 receptor to repress CYP7A1 |
| FXR in hepatocytes | Induces SHP → inhibits HNF4α and LRH-1 (transcription factors for CYP7A1) |
| FXR → ZFP36L1 | Promotes CYP7A1 mRNA turnover (post-transcriptional) |
| Bile acid sequestrants / ileal resection | Interrupt enterohepatic circulation → upregulate CYP7A1 → increase synthesis |
This dual intestinal-hepatic feedback precisely links bile acid synthesis to portal and intestinal bile acid levels. - Sleisenger & Fordtran, p. 1202
6. Hepatic Bile Formation and Transport Proteins
Bile formation is divided into:
- Bile acid-dependent bile flow (~60%): Driven by active secretion of bile acids via BSEP
- Bile acid-independent bile flow (~40%): Driven by glutathione, bicarbonate, and inorganic electrolyte secretion
Key transporters (Table 64.4 from Sleisenger & Fordtran):
| Transporter | Location | Function |
|---|
| NTCP (SLC10A1) | Hepatocyte basolateral | Na+-dependent bile acid uptake; also HBV/HDV receptor |
| OATP1B1 (SLCO1B1) | Hepatocyte basolateral | Na+-independent bile acid + xenobiotic uptake |
| OATP1B3 (SLCO1B3) | Hepatocyte basolateral | Na+-independent bile acid + xenobiotic uptake |
| BSEP (ABCB11) | Canalicular membrane | ATP-dependent bile acid export (primary driver) |
| MDR3 (ABCB4) | Canalicular membrane | Phosphatidylcholine export |
| ABCG5/ABCG8 | Canalicular membrane | Sterol (cholesterol) export |
| FIC1 (ATP8B1) | Canalicular membrane | Aminophospholipid flippase (membrane asymmetry) |
| MRP2 (ABCC2) | Canalicular membrane | Conjugated bilirubin, glutathione export |
| ASBT (SLC10A2) | Ileal apical membrane | Active bile acid reabsorption from lumen |
| OSTα/OSTβ | Ileal basolateral | Bile acid export into portal blood |
7. Bilirubin Metabolism
Bilirubin is the end product of heme catabolism - critically important in clinical assessment.
7.1 Production
- ~80% from senescent RBC hemoglobin breakdown
- Remainder from myoglobin, cytochromes, and ineffective erythropoiesis
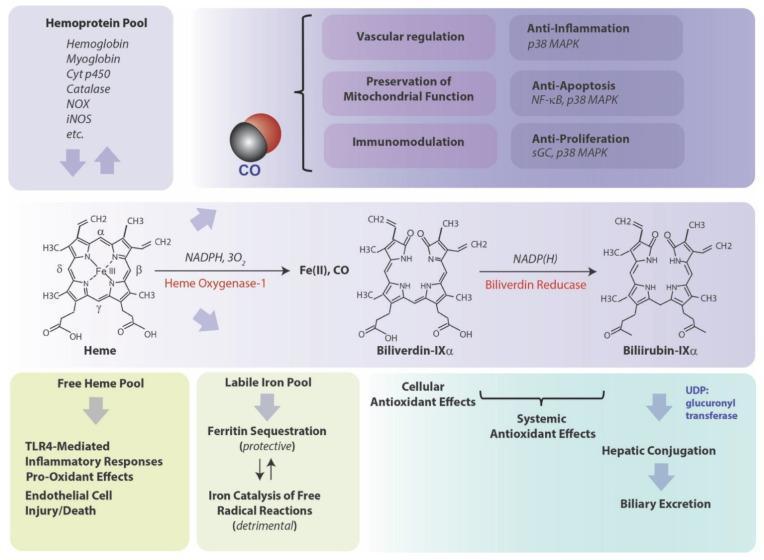
- Heme → biliverdin (by heme oxygenase-1, rate-limiting step)
- Biliverdin → bilirubin (by biliverdin reductase)
- Bilirubin is water-insoluble and circulates bound to albumin as unconjugated (indirect) bilirubin
7.2 Hepatic Uptake
- Bilirubin is removed from albumin at the sinusoidal surface by a saturable facilitated transport system (OATP1B1, OATP1B3)
- Once inside hepatocytes, bilirubin binds ligandin (glutathione S-transferase) to prevent re-entry into blood
7.3 Conjugation
- UDP-glucuronosyltransferase (UGT1A1) in the ER catalyzes conjugation with glucuronic acid:
- Bilirubin → bilirubin monoglucuronide → bilirubin diglucuronide (dominant form in bile)
- Diglucuronide = "direct-reacting" bilirubin (water-soluble)
- Phenobarbital induces UGT1A1 (used therapeutically in neonatal jaundice) - Harper's Biochemistry, p. 334
7.4 Secretion and Intestinal Fate
- Conjugated bilirubin secreted into bile via MRP2 (ABCC2) - the rate-limiting step
- Intestinal bacteria reduce conjugated bilirubin to colorless urobilinogen
- ~20% urobilinogen absorbed → portal blood → liver re-excretes most; kidneys excrete ~20% → gives urine its yellow color (urobilin upon oxidation)
- Remainder → stercobilin → colors feces brown
Normal plasma bilirubin: < 1.0 mg/dL (mostly unconjugated ~0.5 mg/dL)
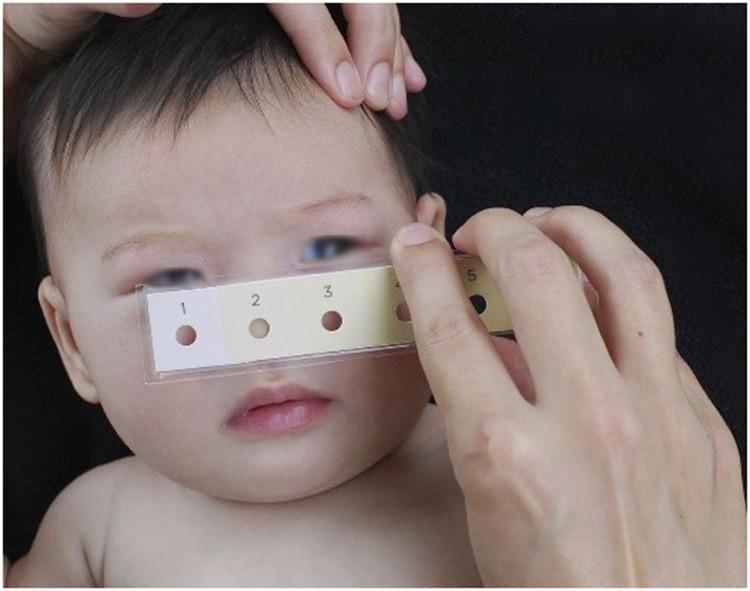
Jaundice visible at: 1.5-3.0 mg/dL - Medical Physiology, Box 46-1
8. Micelle Formation and Fat Absorption
- Bile acids are amphipathic - they align at water-lipid interfaces and reduce surface tension
- In aqueous solution they aggregate to form micelles (~5 nm diameter)
- Mixed micelles incorporate cholesterol, phospholipids, free fatty acids, monoglycerides, and fat-soluble vitamins (A, D, E, K)
- Critical micellar concentration: ~2 mmol/L
- Micelles ferry lipid digestion products to the mucosal brush border for absorption - Tietz Textbook, p. 1973
9. Clinical Significance
9.1 Jaundice - Classification
| Type | Mechanism | Bilirubin | Urine | Stool | Urobilinogen |
|---|
| Pre-hepatic (hemolytic) | Excess unconjugated production | Unconjugated ↑ | Normal | Normal | Urine ↑ |
| Hepatocellular | Uptake/conjugation/excretion defect | Both ↑ | Dark | Pale | Variable |
| Post-hepatic (obstructive) | Conjugated bilirubin can't reach gut | Conjugated ↑ | Dark (bilirubinuria) | Clay-colored | Absent in urine |
In obstructive jaundice: no bilirubin reaches the intestine → no urobilinogen → negative urine urobilinogen test; no stercobilin → clay-colored stools. - Medical Physiology, p. Box 46-1
9.2 Genetic Disorders of Bilirubin Conjugation
| Disorder | Defect | Bilirubin | Clinical |
|---|
| Gilbert syndrome | Mild UGT1A1 deficiency | Unconjugated ↑ (mild) | Benign, intermittent |
| Crigler-Najjar type I | Complete UGT1A1 absence | Severe unconjugated ↑ | Kernicterus; fatal without LT |
| Crigler-Najjar type II (Arias) | Partial UGT1A1 | Moderate unconjugated ↑ | Responds to phenobarbital |
| Dubin-Johnson syndrome | MRP2 (ABCC2) defect | Conjugated ↑ (benign) | Dark liver pigment on biopsy |
| Rotor syndrome | OATP1B1+OATP1B3 defect | Conjugated ↑ | No liver pigment |
9.3 Cholestasis
Definition: Interruption of normal bile formation, classically divided into:
- Intrahepatic cholestasis - functional defect at hepatocyte level
- Extrahepatic cholestasis - mechanical obstruction in biliary tract
Categories of enterohepatic circulation disorders:
- Defects in bile acid formation (synthesis and conjugation)
- Defects in membrane transport of bile acids
- Disturbances in bacterial transformation (SIBO - deconjugation, dehydroxylation)
- Disturbances in movement through or between organs - Sleisenger & Fordtran, p. 1207
9.4 Progressive Familial Intrahepatic Cholestasis (PFIC)
| Type | Gene defect | Protein | GGTP | Feature |
|---|
| PFIC1 (Byler disease) | ATP8B1 | FIC1 (phospholipid flippase) | Low/normal | Extra-hepatic: diarrhea, pancreatitis, hearing loss |
| PFIC2 | ABCB11 | BSEP | Low/normal | Early cirrhosis; giant cell hepatitis; high HCC risk |
| PFIC3 | ABCB4 | MDR3 (phosphatidylcholine) | High | Bile duct proliferation; responds to UDCA |
Treatment: UDCA, rifampin, fat-soluble vitamin supplementation; partial external biliary diversion; liver transplant for refractory cases. - Sleisenger & Fordtran, p. 1210-1212
9.5 Intrahepatic Cholestasis of Pregnancy (ICP)
- Proposed etiology: Interference with bile acid transport across canalicular membrane
- Presents in 2nd-3rd trimester with pruritus
- Serum bile acids > 40 μmol/L = severe ICP; strong association with fetal complications
- Reference range in pregnancy: 0.3-10 μmol/L
- Management: Delivery recommended at 36-37 weeks when bile acids ≥ 100 μmol/L to prevent stillbirth - Tietz Textbook, p. 1973-1974; Goldman-Cecil Medicine
9.6 Bile Acid Malabsorption (BAM)
Causes and consequences:
- Ileal resection or disease (e.g., Crohn's) → bile acid loss to colon → secretory diarrhea (type 3 BAM) if small loss; steatorrhea if large resection
- Congenital ASBT deficiency (SLC10A2 mutations) → primary bile acid malabsorption with congenital diarrhea
- SIBO → premature deconjugation → reduced micellar function → fat malabsorption
Treatment: Bile acid sequestrants (cholestyramine) for diarrhea-predominant BAM; MCT oil supplementation for steatorrhea
9.7 Bile Acid Synthesis Defects (Inherited)
Defects in 11 enzymes and 1 transporter have been reported (CYP7A1, CYP27A1, HSD3B7, AKR1D1, etc.). Clinical presentation:
- Steatorrhea + fat-soluble vitamin deficiency (A, D, E, K)
- Neonatal hepatitis / cholestasis
- Neurological defects (cerebrotendinous xanthomatosis if CYP27A1 defect)
- Normal or low serum GGTP (distinguishes from MDR3 deficiency)
- Treatment: Primary bile acid replacement (cholic acid or chenodeoxycholic acid) - Sleisenger & Fordtran, p. 1209
9.8 Hepatocyte Dysfunction (Liver Disease)
In liver disease (hepatitis, cirrhosis):
- ↓ Bile acid synthesis → low primary bile acid concentrations
- ↓ Portal extraction → ↑ serum bile acids (particularly postprandial)
- ↓ Ratio of primary:secondary bile acids
- ↑ Unconjugated and sulfated bile acid forms
In cholestatic disorders:
- ↓ Primary bile acid delivery to intestine → ↓ secondary bile acid production
- ↑ Ratio of primary:secondary bile acids in serum
Though serum bile acids are abnormal in many conditions, their measurement adds little over standard liver function tests - except in unexplained pruritus and ICP diagnosis. - Tietz Textbook, p. 1973
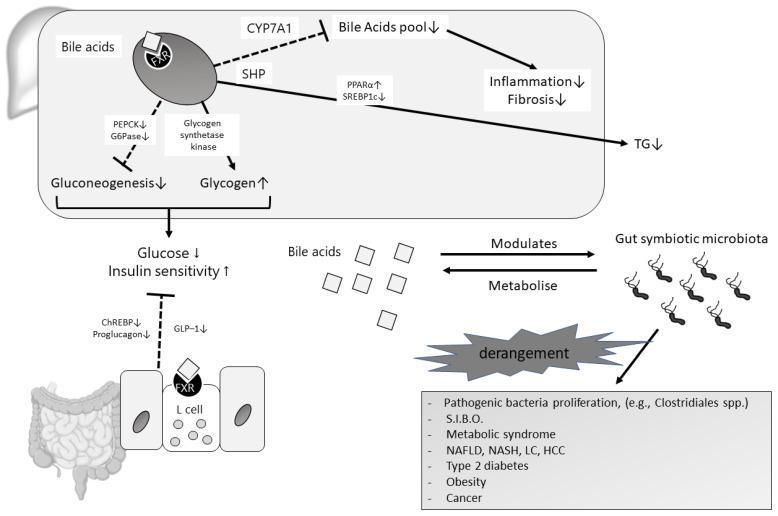
9.9 FXR as a Therapeutic Target
The gut-liver bile acid-FXR axis is implicated in:
- NAFLD/NASH - FXR agonists reduce hepatic lipogenesis (via SREBP1c) and inflammation
- Type 2 diabetes - FXR signaling improves insulin sensitivity (via PEPCK/G6Pase inhibition, glycogen synthesis)
- Metabolic syndrome - derangement of the gut-liver axis promotes SIBO and systemic inflammation
- Obeticholic acid (FXR agonist) - approved for primary biliary cholangitis; studied in NASH
9.10 Gallstone Disease
- Cholesterol gallstones (80%): Result from supersaturation of bile with cholesterol relative to bile acids + phospholipids; ABCG5/ABCG8 mutations increase cholesterol secretion; MDR3 mutations reduce phospholipid secretion
- Pigment gallstones: Excess unconjugated bilirubin precipitation (hemolytic anemias, ileal disease)
- Bile acid therapy (UDCA) can dissolve small cholesterol gallstones by expanding the bile acid pool and reducing cholesterol saturation
10. Bile Acid Measurement: Laboratory Perspective
| Clinical Use | Test |
|---|
| Liver disease screening | Serum bile acids (postprandial most sensitive) |
| ICP diagnosis | Fasting total serum bile acids (> 10 μmol/L abnormal; > 40 μmol/L = severe) |
| Bile acid synthesis defects | Urine/serum/bile profiling by FAB-MS or ESI-tandem MS |
| BAM | SeHCAT test (radiolabeled 75Se-HCAT retention); 7α-hydroxy-4-cholesten-3-one (C4) as marker of synthesis rate |
| Neonatal cholestasis | Bile acid intermediates in urine |
11. Key Pharmacological Applications
| Drug | Mechanism | Use |
|---|
| UDCA (ursodiol) | Hydrophilic bile acid; replaces toxic hydrophobic bile acids; stimulates bile secretion | Primary biliary cholangitis, cholesterol gallstones, ICP, PFIC3 |
| Cholestyramine | Bile acid sequestrant; blocks ileal reabsorption → ↑ synthesis → ↓ LDL cholesterol | Bile acid diarrhea, hypercholesterolemia, pruritus |
| Obeticholic acid | FXR agonist | Primary biliary cholangitis (2nd line) |
| Colesevelam | Bile acid sequestrant | Hypercholesterolemia, type 2 diabetes |
| Phenobarbital | Induces UGT1A1 | Crigler-Najjar type II, neonatal hyperbilirubinemia |
Summary Diagram of Bile Metabolism
Cholesterol
    ↓ CYP7A1 (classical) / CYP27A1+CYP7B1 (alternative)
PRIMARY BILE ACIDS: Cholic acid (CA) + Chenodeoxycholic acid (CDCA)
    ↓ + Glycine or Taurine (UGT conjugation)
Glyco-CA / Tauro-CA / Glyco-CDCA / Tauro-CDCA
    ↓ BSEP secretion into canaliculi
BILE DUCT → GALLBLADDER → DUODENUM
    ↓ Intestinal bacterial 7α-dehydroxylation
SECONDARY BILE ACIDS: Deoxycholic acid + Lithocholic acid
    ↓ ~95% absorbed via ASBT (terminal ileum)
PORTAL VEIN → LIVER (NTCP/OATP re-uptake)
    ↓ ~5% lost in feces (replaced by new synthesis)

BILIRUBIN METABOLISM:
Heme → (HO-1) → Biliverdin → (BVR) → Bilirubin (unconjugated, albumin-bound)
    ↓ Hepatic uptake (OATP) → Ligandin binding
    ↓ UGT1A1 conjugation
Bilirubin diglucuronide (direct) → MRP2 → Bile → Intestine
    ↓ Bacteria
Urobilinogen → Urobilin (urine, yellow) + Stercobilin (feces, brown)
Key Clinical Takeaways:
- The enterohepatic circulation is the master regulator of bile acid homeostasis - disruption at any step causes disease
- Bilirubin conjugation (UGT1A1) and secretion (MRP2) are sequential rate-limiting steps - genetic defects at each produce distinct syndromes
- NTCP on hepatocytes is also the HBV/HDV entry receptor - creating therapeutic opportunities
- FXR is a pleiotropic metabolic regulator linking bile acids to glucose homeostasis, lipid metabolism, and gut microbiota - a major drug target
- Serum bile acids > 40 μmol/L in pregnancy indicate severe ICP requiring early delivery