
Introduction to gait what is gate
introduction to gait definition gait cycle phases
gait cycle phases stance swing diagram
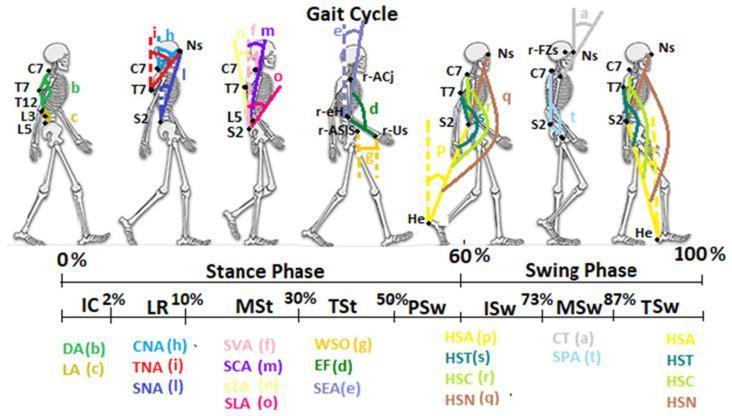
This medical illustration is a Timeline/Progression diagram depicting the human gait cycle from 0% to 100%. Seven skeletal figures in sagittal view demonstrate the biomechanics of movement across the Stance Phase (0-60%) and Swing Phase (60-100%). The diagram incorporates the DB-Total marker set protocol, with reflective markers at anatomical landmarks including the Nasion (Ns), spinous processes (C7, T7, L5, S2), acromioclavicular joint (ACj), and heel (He). Key gait phases are identified: Initial Contact (IC), Loading Response (LR), Mid-Stance (MSt), Terminal Stance (TSt), Pre-Swing (PSw), Initial Swing (ISw), Mid-Swing (MSw), and Terminal Swing (TSw). Color-coded lines and lowercase letters (a-t) represent eighteen sagittal kinematic parameters, such as Dorsal Angle (DA), Lumbar Angle (LA), Sagittal Vertical Axis (SVA), and various Heel-Sacrum relationships (HSA, HST, HSC, HSN). The educational focus is on whole-body kinematics, showing the dynamic alignment of the head, trunk, and limbs during walking for clinical motion analysis and gait assessment in rehabilitation medicine.
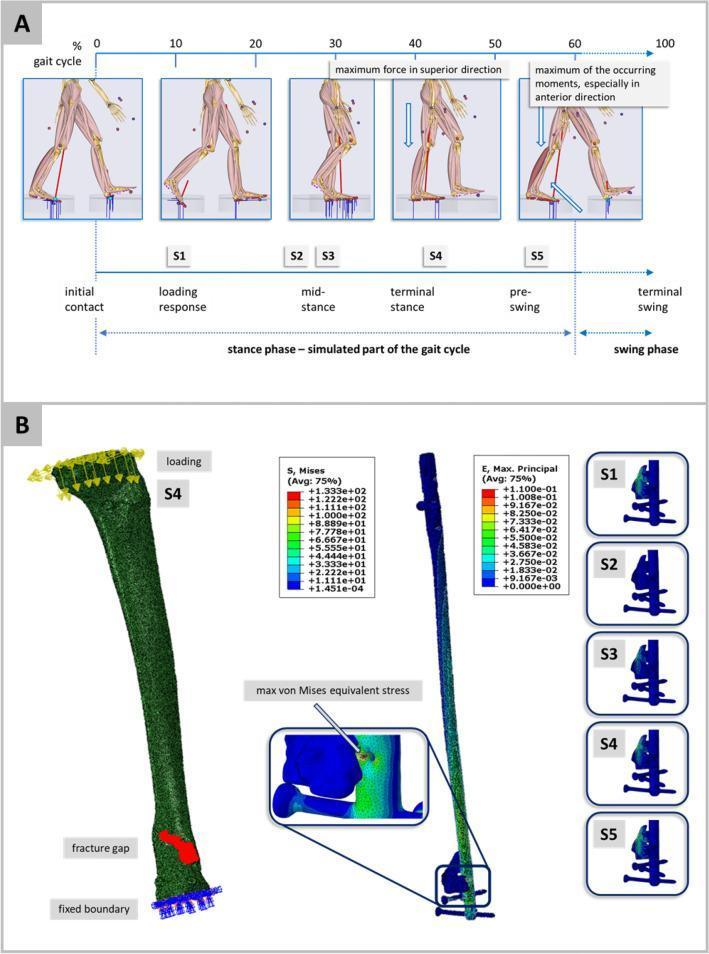
This composite educational graphic illustrates a biomechanical simulation of the gait cycle and its mechanical effects on an intramedullary tibial nail. Section A displays a gait cycle diagram (0-100%) divided into the stance and swing phases. Musculoskeletal models identify five specific landmarks: S1 (initial contact), S2 (loading response), S3 (mid-stance), S4 (terminal stance/maximum superior force), and S5 (pre-swing/maximum anterior moments). Section B presents Finite Element Analysis (FEA) results for a tibial fracture model fixed with an intramedullary nail. The primary simulation (S4) shows von Mises equivalent stress distribution across the implant using a color-coded heat map (blue for low stress, red for maximum stress), with a magnified view of the maximum stress point at the nail-screw interface. Additional frames (S1-S5) depict the maximum principal strain within the fracture gap across different gait phases. This material is designed to illustrate mechanobiological loading and the influence of gait dynamics on fracture gap micromechanics in orthopaedic rehabilitation.
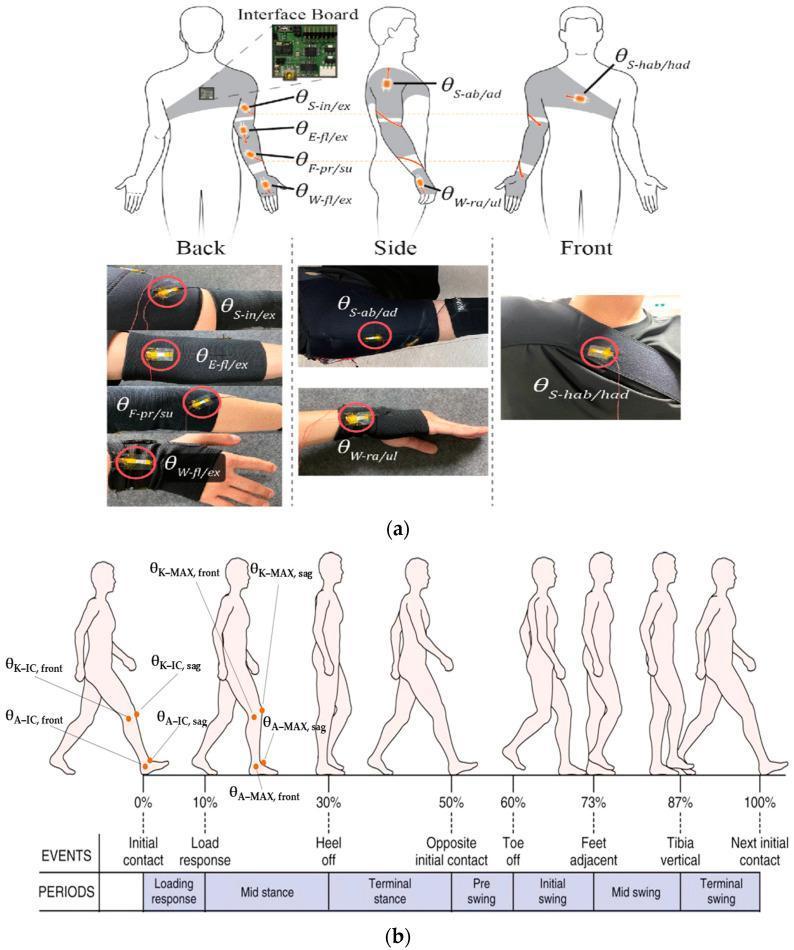
This medical infographic and diagnostic diagram illustrates wearable biomechanical motion detection systems for rehabilitation and sports medicine. Section (a) displays a schematic and clinical photographs of tendon-inspired sensors integrated into wearable elastic belts on the upper body. Labeled locations include the shoulder, elbow, forearm, and wrist, with mathematical notations for measuring joint angles such as internal/external rotation (θ_S-in/ex), abduction/adduction (θ_S-ab/ad), horizontal abduction (θ_S-hab/had), elbow flexion (θ_E-fl/ex), forearm pronation/supination (θ_F-pr/su), and wrist flexion/deviation (θ_W-fl/ex, θ_W-ra/ul). Section (b) presents a gait analysis flowchart using silhouettes to represent a full gait cycle (0% to 100%). It categorizes gait phases into 'Events' (Initial contact, Load response, Heel-off, Toe-off, Mid swing) and 'Periods' (Stance and Swing phases). The diagram highlights critical biomechanical parameters, specifically knee and ankle angles at initial contact (θ_K-IC, θ_A-IC) and maximum flexion/dorsiflexion (θ_K-MAX, θ_A-MAX) in both frontal and sagittal planes, essential for gait monitoring and injury prevention.
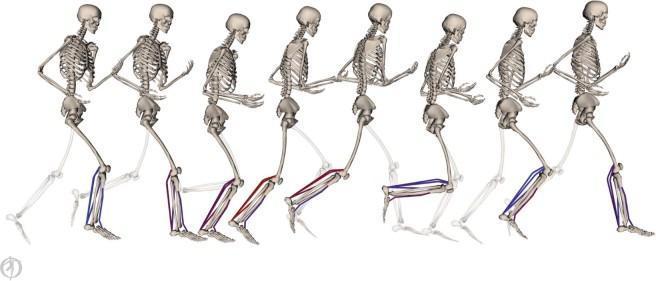
This musculoskeletal simulation diagram illustrates a sequence of a human skeletal model in various stages of a running gait cycle. The image provides a visual progression of lower body kinematics, transitioning through foot contact, stance, and swing phases. Key anatomical focus is placed on the plantar flexor muscles of the lower leg, specifically the medial gastrocnemius, lateral gastrocnemius, and soleus. Muscle excitations, derived from processed electromyography (EMG) data, are visually represented using a color gradient overlay on the muscle-tendon units: blue indicates low levels of excitation, while red signifies high excitation. The skeletal poses are prescribed by joint angles estimated from motion capture data, demonstrating dynamic changes in knee flexion, ankle dorsiflexion, and plantarflexion throughout the gait. Faint skeletal silhouettes provide a path of motion reference, highlighting the biomechanical relationship between muscle activation and skeletal movement during running. This visualization is used in sports medicine and kinesiopathology to analyze muscle-tendon mechanics and force generation ability.
Introduction to Gait
What Is Gait?
"Gait demonstrates the integrated function of the lower limbs and will reveal abnormalities in the musculoskeletal system." - Rheumatology, 2-Volume Set (Elsevier, 2022)
The Gait Cycle
| Phase | Duration | Description |
|---|---|---|
| Stance Phase | ~60% of cycle | Foot is in contact with the ground |
| Swing Phase | ~40% of cycle | Foot is in the air, moving forward |
- Step = interval from initial contact of one foot to initial contact of the opposite foot
- Stride = the full gait cycle (one foot contact to the same foot contact again)
Stance Phase (~60%)
-
Heel Strike (Initial Contact)
- The heel makes contact with the ground
- The foot is dorsiflexed; the tibialis anterior contracts eccentrically
- The subtalar joint is everted, unlocking the transverse tarsal joint to absorb weight-bearing forces
-
Loading Response
- The ankle dorsiflexors continue to eccentrically contract
- Guides the midfoot and forefoot to the ground
- The body's weight is transferred onto the limb
-
Mid-Stance
- Initial period of single-leg stance
- The center of gravity passes directly over the weight-bearing leg
-
Terminal Stance
- The supporting heel rises via contraction of ankle plantar flexors and toe flexors
- The subtalar joint inverts, locking the transverse tarsal joint
- The midfoot transforms from flexible to rigid, generating forward propulsive force
-
Pre-Swing
- Characterized by heel strike of the contralateral (opposite) limb
- The stance limb is preparing to lift off
Swing Phase (~40%)
-
Initial Swing (Toe-Off)
- The leg is propelled forward by hip flexor contraction
- Ends when the knee reaches maximal flexion
-
Mid-Swing
- Dorsiflexors of the foot contract to clear the foot from the ground
- The limb continues advancing forward
-
Terminal Swing
- The hamstrings contract eccentrically to decelerate the limb
- The foot is repositioned for the next heel strike
Double Support Phase
Gait Parameters Examined Clinically
- Initiation of walking
- Heel strike quality
- Stride length and symmetry
- Base width (distance between the feet)
- Arm swing
- Tandem walking ability
- Romberg position (balance with eyes open vs. closed)
Common Abnormal Gait Patterns
| Gait Type | Cause | Appearance |
|---|---|---|
| Antalgic gait | Pain in one limb | Shortened stance phase on painful side; asymmetric steps |
| Trendelenburg gait | Weak hip abductors | Pelvis dips to opposite side; body leans over weak hip; side-to-side shoulder sway |
| Foot drop / Steppage gait | Foot drop (e.g., peroneal nerve palsy) | High-stepping to avoid tripping toes during swing phase |
| Parkinsonian gait | Parkinson disease | Decreased heel strike, short shuffling steps, flexed posture, reduced arm swing |
| Ataxic gait | Cerebellar disease | Wide base, inability to tandem walk |
| Short leg gait | Leg length inequality | Pelvic tilt; may flex the longer leg's knee to clear the ground |
Visual Reference - Gait Cycle Diagram
Summary
| Key Point | Detail |
|---|---|
| Definition | Pattern of walking; integrated function of limbs, nervous system, and musculature |
| Gait cycle | Heel strike to same heel strike |
| Stance phase | 60% - 5 subphases (heel strike → loading → midstance → terminal stance → pre-swing) |
| Swing phase | 40% - 3 subphases (initial → mid → terminal swing) |
| Clinical use | Reveals musculoskeletal and neurological abnormalities |
- Imaging Anatomy: Bones, Joints, Vessels and Nerves, p. 3162-3169
- Rheumatology, 2-Volume Set (Elsevier 2022), p. 265
- Bradley and Daroff's Neurology in Clinical Practice, p. 370
- Physio-Pedia: The Gait Cycle
- Kenhub: Gait Cycle