
How does ventricular tachycardia occur
ventricular tachycardia ECG wide complex tachycardia
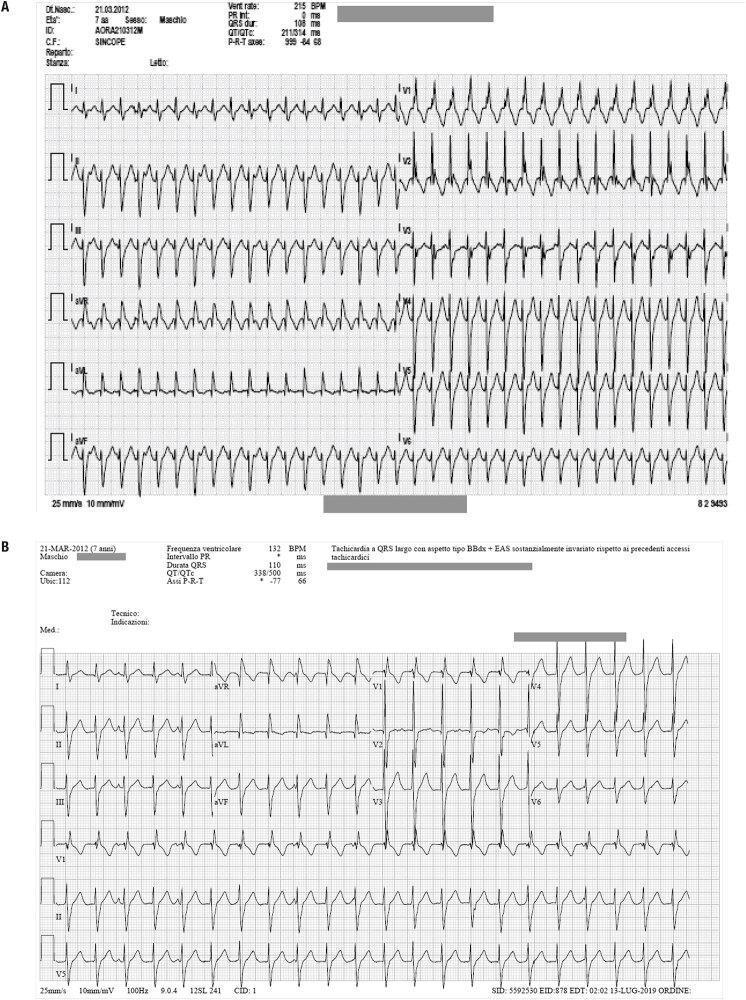
Two diagnostic 12-lead electrocardiogram (ECG) tracings (labeled A and B) from a 7-year-old male patient showing wide-complex tachyarrhythmias. Figure 1A demonstrates a regular, wide QRS tachycardia at a rate of approximately 215 BPM. The morphology exhibits features consistent with a right bundle branch block (RBBB) pattern and a superior axis, suggestive of left anterior fascicular block. Figure 1B shows a subsequent episode of wide-complex tachycardia at a slower rate of 132 BPM, maintaining the RBBB-like morphology and superior QRS axis deviation. Key diagnostic parameters provided in the ECG headers include a QRS duration of 110 ms in Figure 1B and a markedly shifted P-R-T axis between the two recordings. Both tracings represent ventricular fascicular tachycardia (VFT), a specific type of idiopathic ventricular tachycardia often characterized by a RBBB pattern and axis deviation. The images serve as educational materials for distinguishing fascicular ventricular tachycardia from other forms of supraventricular or ventricular arrhythmias based on QRS morphology, axis, and rate.
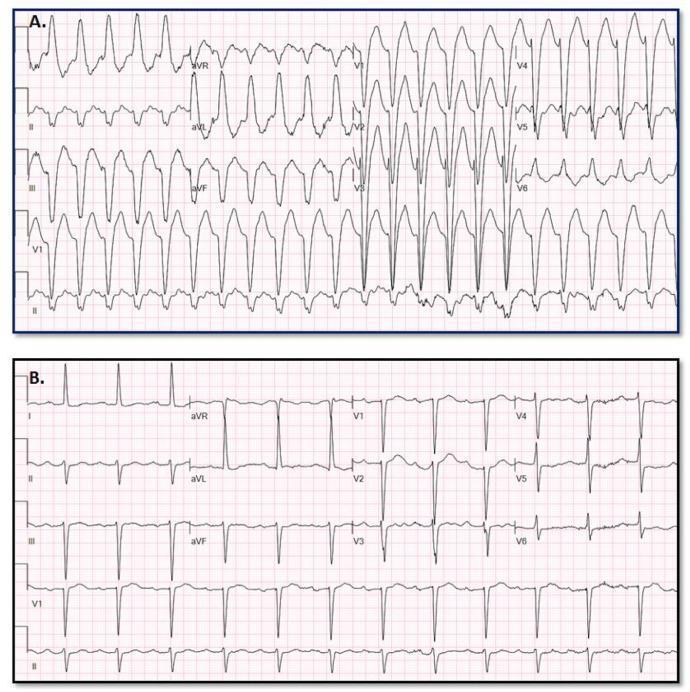
This diagnostic comparison image shows two 12-lead electrocardiograms (ECGs) used to illustrate the differentiation between Wide Complex Tachycardia (WCT) and baseline rhythms. Panel A displays a Wide Complex Tachycardia characterized by a rapid ventricular rate and significantly widened QRS complexes (approximately 170 ms). The morphology is relatively uniform with prominent S-waves in the precordial leads and notable baseline artifact. Panel B shows the patient's baseline ECG, presenting a narrow QRS complex rhythm with visible P-waves preceding each QRS, consistent with sinus rhythm or a supraventricular origin. The comparison highlights clinical diagnostic challenges where Supraventricular Tachycardia (SWCT) with aberrancy may mimic Ventricular Tachycardia (VT). This material is intended for advanced medical education in cardiology and electrophysiology, specifically focusing on ECG interpretation and the application of predictive models for arrhythmia classification.
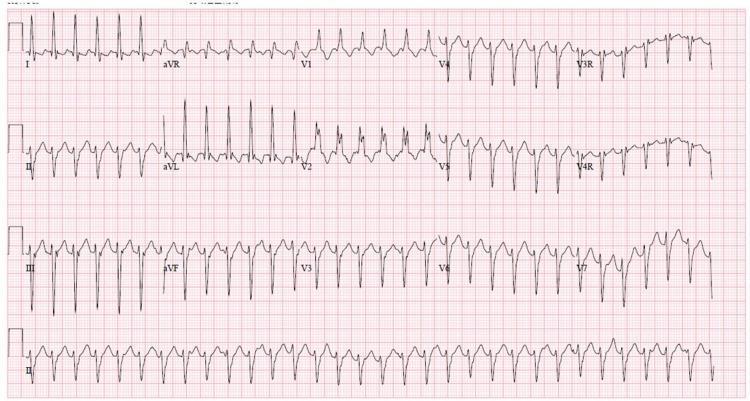
A 12-lead electrocardiogram (ECG) demonstrating a regular wide complex tachycardia (WCT). The rhythm is characterized by a rapid ventricular rate and broad QRS complexes, indicating delayed ventricular depolarization. Key morphological findings include a Right Bundle Branch Block (RBBB) pattern, notably visible as an RSR' or notched morphology in the right precordial leads (V1, V2). There is significant left axis deviation (LAD), with predominantly negative QRS complexes in the inferior leads (II, III, and aVF) and positive complexes in leads I and aVL. This combination of RBBB morphology and left axis deviation in the context of wide complex tachycardia is a classic presentation of idiopathic left ventricular tachycardia, also known as Belhassen tachycardia or verapamil-sensitive fascicular ventricular tachycardia. The rhythm appears monomorphic, and the baseline shows no clearly identifiable P waves, suggesting atrioventricular dissociation or retrograde conduction common in ventricular arrhythmias.
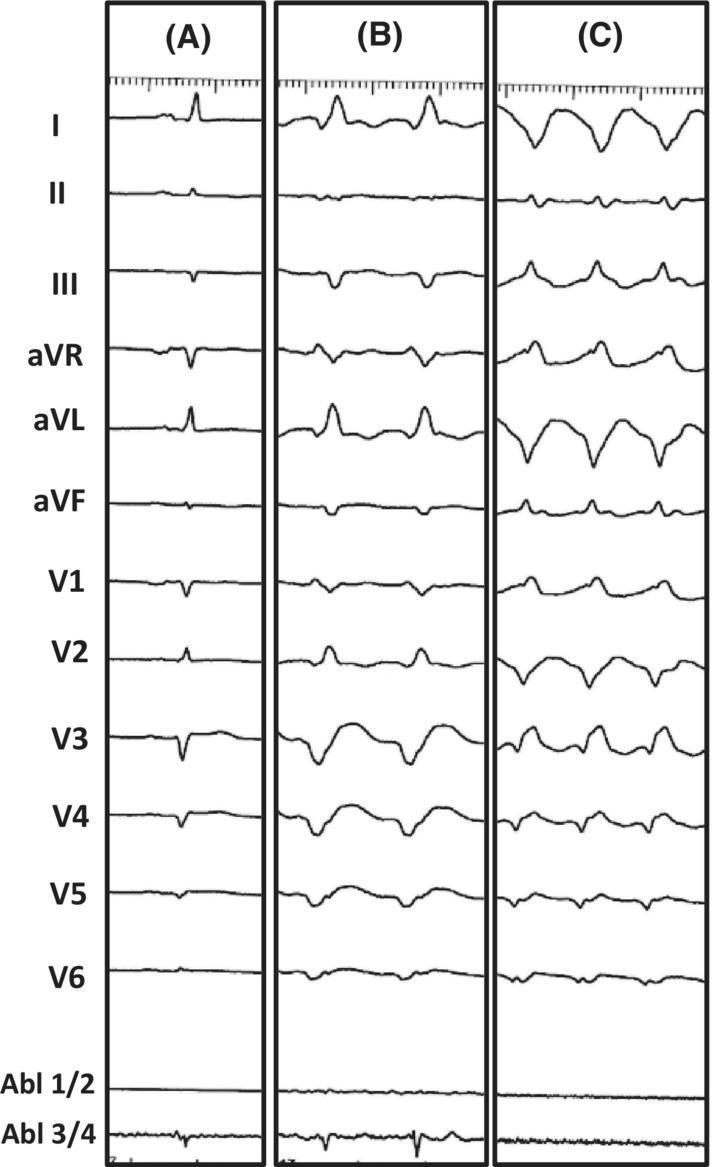
This diagnostic image consists of three vertical panels (A, B, and C) displaying 12-lead electrocardiogram (ECG) tracings alongside intracardiac ablation catheter signals (Abl 1/2, Abl 3/4). Panel A represents the patient's baseline ECG, showing narrow QRS complexes and normal sinus rhythm. Panel B illustrates Ventricular Tachycardia (VT) Morphology 1, characterized by a wide-complex tachycardia with a right bundle branch block (RBBB) morphology in V1 and a predominantly positive axis in lead I. Panel C displays VT Morphology 2, which shows a different wide-complex tachycardia pattern with a more discordant QRS morphology across the precordial leads and higher frequency compared to Panel B. The image serves as an educational tool for comparing baseline cardiac rhythms with different morphologies of monomorphic ventricular tachycardia in the context of electrophysiology studies and catheter ablation. It demonstrates clinical features such as QRS widening, secondary ST-T wave changes, and morphology shifts indicative of different ventricular exit sites during a VT storm.
"ventricular tachycardia"[MeSH Terms] AND mechanisms
1. Reentry (the most common mechanism)
- Unidirectional block. A premature beat meets tissue that is still refractory in one direction.
- Slow conduction. The impulse travels slowly through a channel of surviving myocytes, which gives the blocked region time to recover.
- Re-excitation. The impulse returns and re-enters through the recovered tissue, closing the loop.
2. Triggered activity
-
Early afterdepolarizations (EADs) arise before full repolarization. They occur when repolarization is prolonged, as in acquired long QT syndrome. Drug causes include sotalol and erythromycin, and low potassium also contributes. The result is torsades de pointes.
-
Delayed afterdepolarizations (DADs) arise after repolarization is complete, typically from intracellular calcium overload. Examples are digitalis toxicity, catecholamine excess, and catecholaminergic polymorphic VT, which comes from gain-of-function RyR2 mutations.
-
Braunwald's Heart Disease, Ch. 62
3. Abnormal automaticity
Common clinical settings
- Acute MI. Goldman-Cecil lists adrenergic tone, intracellular electrolyte disturbance, free fatty acids and oxygen free radicals as contributors. It states that "micro-re-entry likely is the most common electrophysiologic mechanism of early-phase arrhythmias," though enhanced automaticity and triggered activity also occur - Goldman-Cecil Medicine, Ventricular Arrhythmias.
- Chronic ischemic scar. This is the most common cause of sustained monomorphic VT.
- Cardiomyopathies. Dilated, hypertrophic and arrhythmogenic RV cardiomyopathy all produce scar or fibrosis.
- Channelopathies. These include long QT, Brugada syndrome and CPVT.
- Drugs and metabolic causes. Digitalis and QT-prolonging agents are examples, as are hypokalemia and hypomagnesemia.
- Idiopathic VT with a structurally normal heart. Examples are outflow tract VT (triggered activity or automaticity) and fascicular VT (reentry within the Purkinje system). Harrison's notes that scar-related reentrant VTs carry a risk of sudden death, whereas idiopathic VT is more benign.
Why it matters
ECG appearance
Recent evidence check
How can prolonged repolarization cause early after depolarisation
early afterdepolarization action potential prolonged plateau torsades de pointes
Step by step
-
Normal timing. During the plateau (phase 2) the inward L-type Ca²⁺ current (I_Ca,L) is balanced by outward K⁺ currents (I_Kr, I_Ks). Phase 3 follows, when K⁺ efflux dominates and the membrane returns to rest. The Na⁺ channels are inactivated during all of this, and I_Ca,L inactivates as the plateau ends.
-
Repolarization is delayed. Outward K⁺ current is reduced (the "repolarization reserve" is lost), or inward current persists (the late Na⁺ current is increased). Examples are K⁺-channel block, long QT mutations, low extracellular K⁺, and calmodulin kinase II (CaMKII) activation, which enhances late Na⁺ and Ca²⁺ currents.
-
The membrane stays depolarized for too long. Medical Physiology describes the key point: "I_Na remains inactivated because the cell is so depolarized." But "I_Ca has had enough time to recover from inactivation and, because the cell is still depolarized, triggers a slow, positive deflection in V_m known as an early afterdepolarization" - Medical Physiology, Ch. 21. Because the cell is still at plateau-range voltage, the recovered Ca²⁺ channels can reopen. This is called reactivation.
-
Sodium-calcium exchange adds to it. Ca²⁺ entry and release from the sarcoplasmic reticulum (SR) activate the Na⁺/Ca²⁺ exchanger (NCX). NCX is electrogenic and brings in net inward current, which further prolongs the action potential and sustains the depolarizing oscillation. Goodman & Gilman says EAD triggered upstrokes "probably reflect inward current through Ca²⁺ channels or possibly the NCX and/or Na⁺ channels" - Goodman & Gilman, Ch. 34.
-
Repolarization resumes or a beat fires. Eventually I_K grows and pulls the membrane back to rest. If the EAD is large enough to reach threshold, it triggers an extrasystole (a premature ventricular contraction).
Why EADs are more likely in some conditions
- Slow heart rate. There is more time at plateau, and class III drugs cause EADs at slow rates. This is why bradycardia and the post-pause beat precede torsades.
- Low K⁺ or Mg²⁺. Low extracellular K⁺ reduces outward K⁺ current, which delays repolarization further.
- Drugs that block I_Kr. Examples are sotalol, quinidine and erythromycin.
- Cell type. Purkinje cells and mid-myocardial M cells have intrinsically longer action potentials, so they develop EADs more readily than epicardial cells.
- Phase of the EAD. Phase 2 EADs occur at potentials positive to about -30 mV, and phase 3 EADs occur at more negative potentials. Phase 2 EADs mainly involve I_Ca,L reactivation, while phase 3 EADs involve NCX and other mechanisms.
From one cell to arrhythmia
Contrast with DADs
So is this happening: when repolarozation is prolonged the inactivated voltage gated sodium channels and l type calcium channels recover before the cell is completely repolarized. If something like catecholamines excess, hypokalemia or infarction or injury produces fluctuations in the RMP the channels can open and produce EAD. Is this right?
What is right
- Repolarization is prolonged, so the membrane stays at depolarized voltages for longer than normal.
- Channels that were inactivated recover from inactivation while the cell is still depolarized.
- Those channels then reopen and generate an inward current. That inward current produces the EAD.
What needs correcting
| Trigger | How it promotes EADs |
|---|---|
| Hypokalemia | Reduces outward K⁺ current (I_Kr and I_K1), so repolarization slows. |
| Catecholamines | Increase I_Ca,L, which means more inward current and a larger Ca²⁺ load. They also raise SR Ca²⁺ and NCX activity and activate CaMKII, which enhances late Na⁺ and Ca²⁺ currents. Catecholamines also enhance I_Ks, which shortens the action potential, so their EAD effect is rate dependent. |
| Ischemia and infarction | Cause electrolyte and pH shifts, acidosis, Ca²⁺ overload and a lower K⁺ reserve, all of which alter repolarization. Fuster and Hurst lists injury, altered electrolytes, hypoxia and acidosis as EAD conditions. |
| Drugs (class III, macrolides, quinidine) and long QT mutations | Block K⁺ channels or increase late Na⁺ current, so the action potential is prolonged. |
Corrected summary
Whats the role of NCX
sodium-calcium exchanger NCX cardiac myocyte calcium handling sarcoplasmic reticulum
Normal role
- Ca²⁺ removal. Braunwald's Heart Disease says NCX extrudes most of the Ca²⁺ that entered through I_Ca,L. A very small fraction is removed by the plasma membrane Ca²⁺-ATPase (PMCA). The SR Ca²⁺-ATPase (SERCA) takes up the rest into the SR. This lets the cell relax in diastole.
- Energy source. NCX uses the inward Na⁺ gradient, which the Na⁺/K⁺-ATPase maintains, to drive Ca²⁺ out. Goodman & Gilman describes this as antiport: 3 Na⁺ in for 1 Ca²⁺ out.
- Electrogenic. Three Na⁺ carry three positive charges in, while one Ca²⁺ carries two positive charges out. The net result is one positive charge entering per cycle. In forward mode, NCX therefore produces an inward (depolarizing) current. Braunwald adds that NCX "almost always functions to extrude Ca²⁺, resulting in a net inward current" (Braunwald's Heart Disease, Na⁺/Ca²⁺ Exchanger).
- Reverse mode. The exchanger can also run backward, bringing Ca²⁺ in and removing Na⁺. This happens when the cell is strongly depolarized or intracellular Na⁺ is high. Fishman's describes NCX as operating in either forward or reverse mode (Fishman's Pulmonary Diseases and Disorders). Reverse mode is brief in a normal cardiac action potential.
Role in delayed afterdepolarizations (DADs)
- Ca²⁺ overload (from digitalis, catecholamines, ischemia, or RyR2 gain-of-function in CPVT) makes the SR leak or spontaneously release Ca²⁺ after repolarization.
- The rise in cytosolic Ca²⁺ activates NCX in forward mode to remove it.
- NCX brings in 3 Na⁺ for each Ca²⁺ it removes, so there is a net inward current.
- This depolarizes the membrane after repolarization is complete. That is the DAD, and if it reaches threshold it triggers a premature beat.
Role in early afterdepolarizations (EADs)
- During a prolonged plateau, Ca²⁺ is already elevated and SR release can occur late in the action potential.
- NCX then provides inward current at the plateau and prolongs the action potential. This favors L-type Ca²⁺ channel reactivation, which is the main EAD driver.
- Goodman & Gilman says EAD upstrokes "probably reflect inward current through Ca²⁺ channels or possibly the NCX and/or Na⁺ channels." This points to NCX as a contributor in some EADs, especially phase 3 EADs, and not as the sole cause.
- Fuster and Hurst describes a priming effect. NCX provides an electrogenic inward current that helps EADs form and prolongs the action potential. This is the mechanism behind the biphasic effect of β-adrenergic stimulation on EADs.
- Braunwald also shows EADs in mice with heterozygous knockout of NCX, so the exchanger is not strictly required for every EAD.