
Fluid administration protocol in dengue with warning signs
dengue fluid resuscitation management
dengue fluid management algorithm warning signs flowchart
Summary : This flowchart provides a comprehensive management algorithm for adults with atopic dermatitis, detailing baseline management, topical therapies, phototherapy, and systemic therapies, including FDA-approved and recommended treatments, maintenance strategies, and escalation steps for inadequate control. flowchart: # Baseline Management : • Severity Assessment: Assessment of signs of disease, severity of symptoms, comorbidities, and impact on quality of life (QOL). • Exacerbating Factor Avoidance: Identify trigger factors (allergens, irritants, etc.) and counsel patients on avoidance. • Baseline Therapy: Moisturizers/Emollients (strong recommendation), Bathing Practices (conditional recommendation). # Initial Pathways : • Mild to Severe: Proceed to Topical Therapies. • Moderate to Severe: Proceed to Phototherapy & Systemic Therapy. # Topical Therapies : ## Optimized Topical Therapy for Inflamed Areas : • TCS (Topical corticosteroids) (FDA, strong recommendation) • TCIs (Topical calcineurin inhibitors) (FDA, strong recommendation) • Crisaborole ointment (FDA, strong recommendation) • Ruxolitinib cream (FDA, strong recommendation) • Wet Dressings (strong recommendation) ## Ongoing Maintenance with Topical Therapies : • Reactive or proactive application for maintenance. • Shared decision-making for long-term treatment. • Consider patient satisfaction and adherence. ## Inadequate Control : • If topical therapy and basic management optimized, consider alternative diagnoses. • Consider additional treatment with phototherapy and/or systemic agents. # Phototherapy & Systemic Therapy : • Topical agents can be used concurrently with phototherapy or systemic agents for maintenance, rescue, or flares. # Phototherapy : • No specific agents listed; included as a treatment option for moderate to severe cases. # Systemic Therapies : ## Biologics : • Dupilumab (FDA, strong recommendation) • Tralokinumab (FDA, strong recommendation) ## JAK Inhibitors : • Upadacitinib (FDA, strong recommendation) • Abrocitinib (FDA, strong recommendation) • Baricitinib (strong recommendation) ## Immunosuppressants : • Methotrexate (strong recommendation) • Azathioprine (strong recommendation) • Cyclosporine (strong recommendation) • Mycophenolate mofetil (strong recommendation) • Systemic corticosteroids (FDA, strong recommendation against use) # Key : • Green circle: Strong recommendation in favor. • Yellow circle: Conditional recommendation in favor. • Red circle: Strong recommendation against. • Orange circle: Conditional recommendation against. • FDA: Indicated for atopic dermatitis. # Abbreviations : • QOL: Quality of Life • FDA: Food and Drug Administration • TCS: Topical corticosteroids • TCI: Topical calcineurin inhibitor # Layout : • The flowchart is organized from baseline management at the top, splitting into two main pathways (mild to severe and moderate to severe), with further branches into topical, phototherapy, and systemic therapies. • Maintenance and escalation steps are included for ongoing management and inadequate control. # Analysis : • The algorithm emphasizes starting with baseline management and topical therapies, escalating to phototherapy and systemic therapies for more severe or refractory cases. • Strong recommendations are visually highlighted for first-line agents, with systemic corticosteroids strongly discouraged. • FDA-approved options are clearly marked, supporting evidence-based decision-making. • The flowchart supports a stepwise, patient-centered approach, integrating maintenance and escalation strategies.
Summary : This flowchart presents a prehospital algorithm for the evaluation and management of patients with suspicion for moderate to severe traumatic brain injury (TBI), covering airway, ventilation, blood pressure, and mentation assessment, with decision points and recommended interventions. flowchart: # Nodes : • Suspicion for moderate to severe TBI (rounded rectangle, top center) • Airway & Oxygenation (green rectangle) • Immediately apply supplemental O2 via nasal cannula or face mask (green rectangle) • Continuous pulse oximetry, document readings q5–10 mins (green rectangle) • O2 saturation < 90%? (diamond) • Airway repositioning, bag-valve mask, rate 10 breaths/minute, airway adjuncts (green rectangle) • Consider advanced airway (green rectangle) • Endotracheal intubation if experienced provider available (green rectangle) • Ventilation (yellow rectangle) • Adequate ventilatory effort? (diamond) • Confirm continuous EtCO2, document readings q5–10 mins (yellow rectangle) • Maintain EtCO2 goal of 35–45, avoid hyperventilation unless signs of herniation, tidal volume goal 7cc/kg on ventilator (yellow rectangle) • Confirm endotracheal tube placement by EtCO2 (yellow rectangle) • Blood Pressure (cyan rectangle) • Obtain IV or IO access (cyan rectangle) • Frequent BP and HR monitoring, document readings q5–10 mins (cyan rectangle) • SBP < 100 mmHg? (diamond) • Continue careful monitoring for signs of shock or hypotension (cyan rectangle) • IV fluid resuscitation with 1L NS/LR (cyan rectangle) • Preferential transport to level 1 or 2 trauma center (red rectangle) • Evidence of impending herniation? (GCS < 8, dilated/unresponsive pupils, extensor posturing) (diamond) • Moderate hyperventilation (20 breaths/minute, EtCO2 goal 30–35), elevate HOB 30°, high suspicion of spinal injury (orange rectangle) • Mentation (orange rectangle) • Evaluate GCS (orange rectangle) • Evaluate for hypoglycemia (orange rectangle) • BGL < 70? (diamond) • Administer Dextrose IV, recheck in 10 mins (orange rectangle) • GCS < 13 (diamond) • Pediatric ventilation rates, identifying pediatric hypotension, rules of thumb, pediatric dextrose administration, pediatric moderate hyperventilation guidelines, pediatric IV fluid resuscitation (white rectangle, bottom right) # Connectors : • Arrows connect nodes in a left-to-right and top-to-bottom sequence, with decision diamonds splitting into "Yes" and "No" branches. • Airway & Oxygenation and Ventilation branches merge after advanced airway placement. • Blood Pressure and Mentation branches feed into the central decision for trauma center transport and herniation management. • Pediatric guidelines are referenced from multiple branches. # Layout : • Three main vertical branches: Airway/Oxygenation (left, green), Blood Pressure (center, cyan), Mentation (right, orange). • Decision diamonds create horizontal splits for "Yes"/"No" logic. • Red and orange nodes highlight critical interventions and transport decisions. • White rectangle at bottom right provides reference guidelines for pediatric care. # Analysis : • The flowchart provides a systematic, stepwise approach for prehospital providers to assess and manage suspected moderate to severe TBI. • Emphasis is placed on maintaining oxygenation, ventilation, and blood pressure, with frequent monitoring and documentation. • Decision points guide escalation of care, including advanced airway management, fluid resuscitation, and rapid transport to trauma centers. • Special considerations for pediatric patients are included, with specific rates and thresholds for intervention. • The algorithm prioritizes early recognition of herniation and hypoglycemia, with clear instructions for immediate action.
This diagnostic algorithm flowchart integrates Inferior Vena Cava Collapsibility Index (IVCCI) and Point-of-Care Lung Ultrasound (LUS) to guide preoperative fluid management. The top row illustrates IVCCI assessment using combined B-mode and M-mode ultrasonography. The left panel shows a highly collapsible IVC (distensibility/collapsibility ≥40%, e.g., 2.51 cm to 1.55 cm), suggesting fluid responsiveness. The right panel shows a plethoric IVC with low collapsibility (<40%, e.g., 2.59 cm to 1.92 cm). The bottom row displays lung profiles based on the BLUE protocol. Profile A (left) shows characteristic horizontal 'A-lines', indicating dry lungs and normal aeration, leading toward fluid therapy. Profile B (right) demonstrates vertical, laser-like 'B-lines' (comet-tail artifacts) arising from the pleural line, indicating interstitial syndrome or pulmonary edema. The algorithm concludes with decision nodes: patients with A-profiles and high IVCCI are directed toward 'FLUID THERAPY', while those with anterior B-profiles or low IVCCI are directed toward 'FLUID RESTRICTION' to prevent volume overload.
Summary : This flowchart presents an algorithm for the diagnosis and management of idiopathic hyperlactation in breastfeeding dyads, outlining stepwise interventions and decision points based on patient response. flowchart: # Nodes : • Breastfeeding dyad with signs/symptoms of hyperlactation (rectangle) • Diagnose and treat iatrogenic or self-induced hyperlactation (process note) • Idiopathic hyperlactation diagnosed (rectangle) • Block feeding under close supervision by a breastfeeding medicine expert for 24-48 hours: during the day, feed from a single breast for a period of 3 hours and alternate sides each cycle; overnight, feed ad lib (rectangle) • Persistent hyperlactation (rectangle) • Symptoms improved - continue to block feed under close observation until milk production matches needs of infant(s) (rectangle, branch) • Herbal therapies, pseudoephedrine, and/or combined oral contraceptive (COC) (rectangle) – Therapy selection should be individualized based on number of weeks postpartum, patient preferences, potential adverse drug reactions, potential medication interactions, and cultural beliefs (note) • Persistent hyperlactation (rectangle) • Symptoms improved - may continue herbal and/or medical therapy as-needed or continuously (rectangle, branch) • Dopamine agonists: cabergoline preferred (rectangle) – Potential need for repeat dosing in severe cases (note) • Symptoms improved - stop therapy (rectangle) # Connectors : • Downward arrows connect each step in the main pathway. • At each intervention step, a rightward arrow branches to a “Symptoms improved” node, indicating continued or adjusted therapy. • If symptoms persist, the flow returns to the main vertical pathway for escalation of therapy. # Layout : • The flowchart is arranged vertically, with decision branches to the right at each intervention step. • Main pathway: initial diagnosis → block feeding → herbal/medication therapy → dopamine agonists. • Branches at each intervention for symptom improvement, leading to continued observation or therapy cessation. # Analysis : • The algorithm is structured to escalate interventions for idiopathic hyperlactation only if symptoms persist after each step. • Initial management focuses on supervised block feeding, followed by individualized herbal or medication therapy, and finally dopamine agonists for refractory cases. • At each stage, improvement in symptoms allows for de-escalation or cessation of therapy, emphasizing a tailored and stepwise approach.
Fluid Administration Protocol in Dengue with Warning Signs
WHO Classification: Dengue with Warning Signs (Group B)
Warning Signs to Recognize
| Warning Sign | Clinical Significance |
|---|---|
| Abdominal pain or tenderness | Predicts plasma leakage |
| Persistent vomiting | Prevents oral rehydration |
| Clinical fluid accumulation | Pleural effusion, ascites - sign of leakage |
| Mucosal bleeding | Epistaxis, gum bleed, hematemesis |
| Lethargy / restlessness | End-organ perfusion compromise |
| Liver enlargement > 2 cm | Hepatic involvement |
| Rapid rise in Hct with fall in platelet | Imminent plasma leakage |
| Oliguria | Reduced renal perfusion |
Phases of Dengue and Their Fluid Strategy
1. Febrile Phase (Days 1-3)
- Encourage oral fluids: ORS, fruit juices, electrolyte-containing drinks
- If tolerating orals and no warning signs: manage as outpatient
- Avoid NSAIDs and aspirin (risk of bleeding, Reye's syndrome)
- Paracetamol for fever (do not exceed 4-hourly intervals)
- Return precautions: cold extremities, black stools, no urine for 4-6 h, altered sensorium
2. Critical Phase (Days 4-6 - around defervescence)
- Warning signs are present
- Patient cannot tolerate oral intake (persistent vomiting)
- Haematocrit rises > 20% from baseline
- Haemodynamic instability
Fluid Protocol by Severity
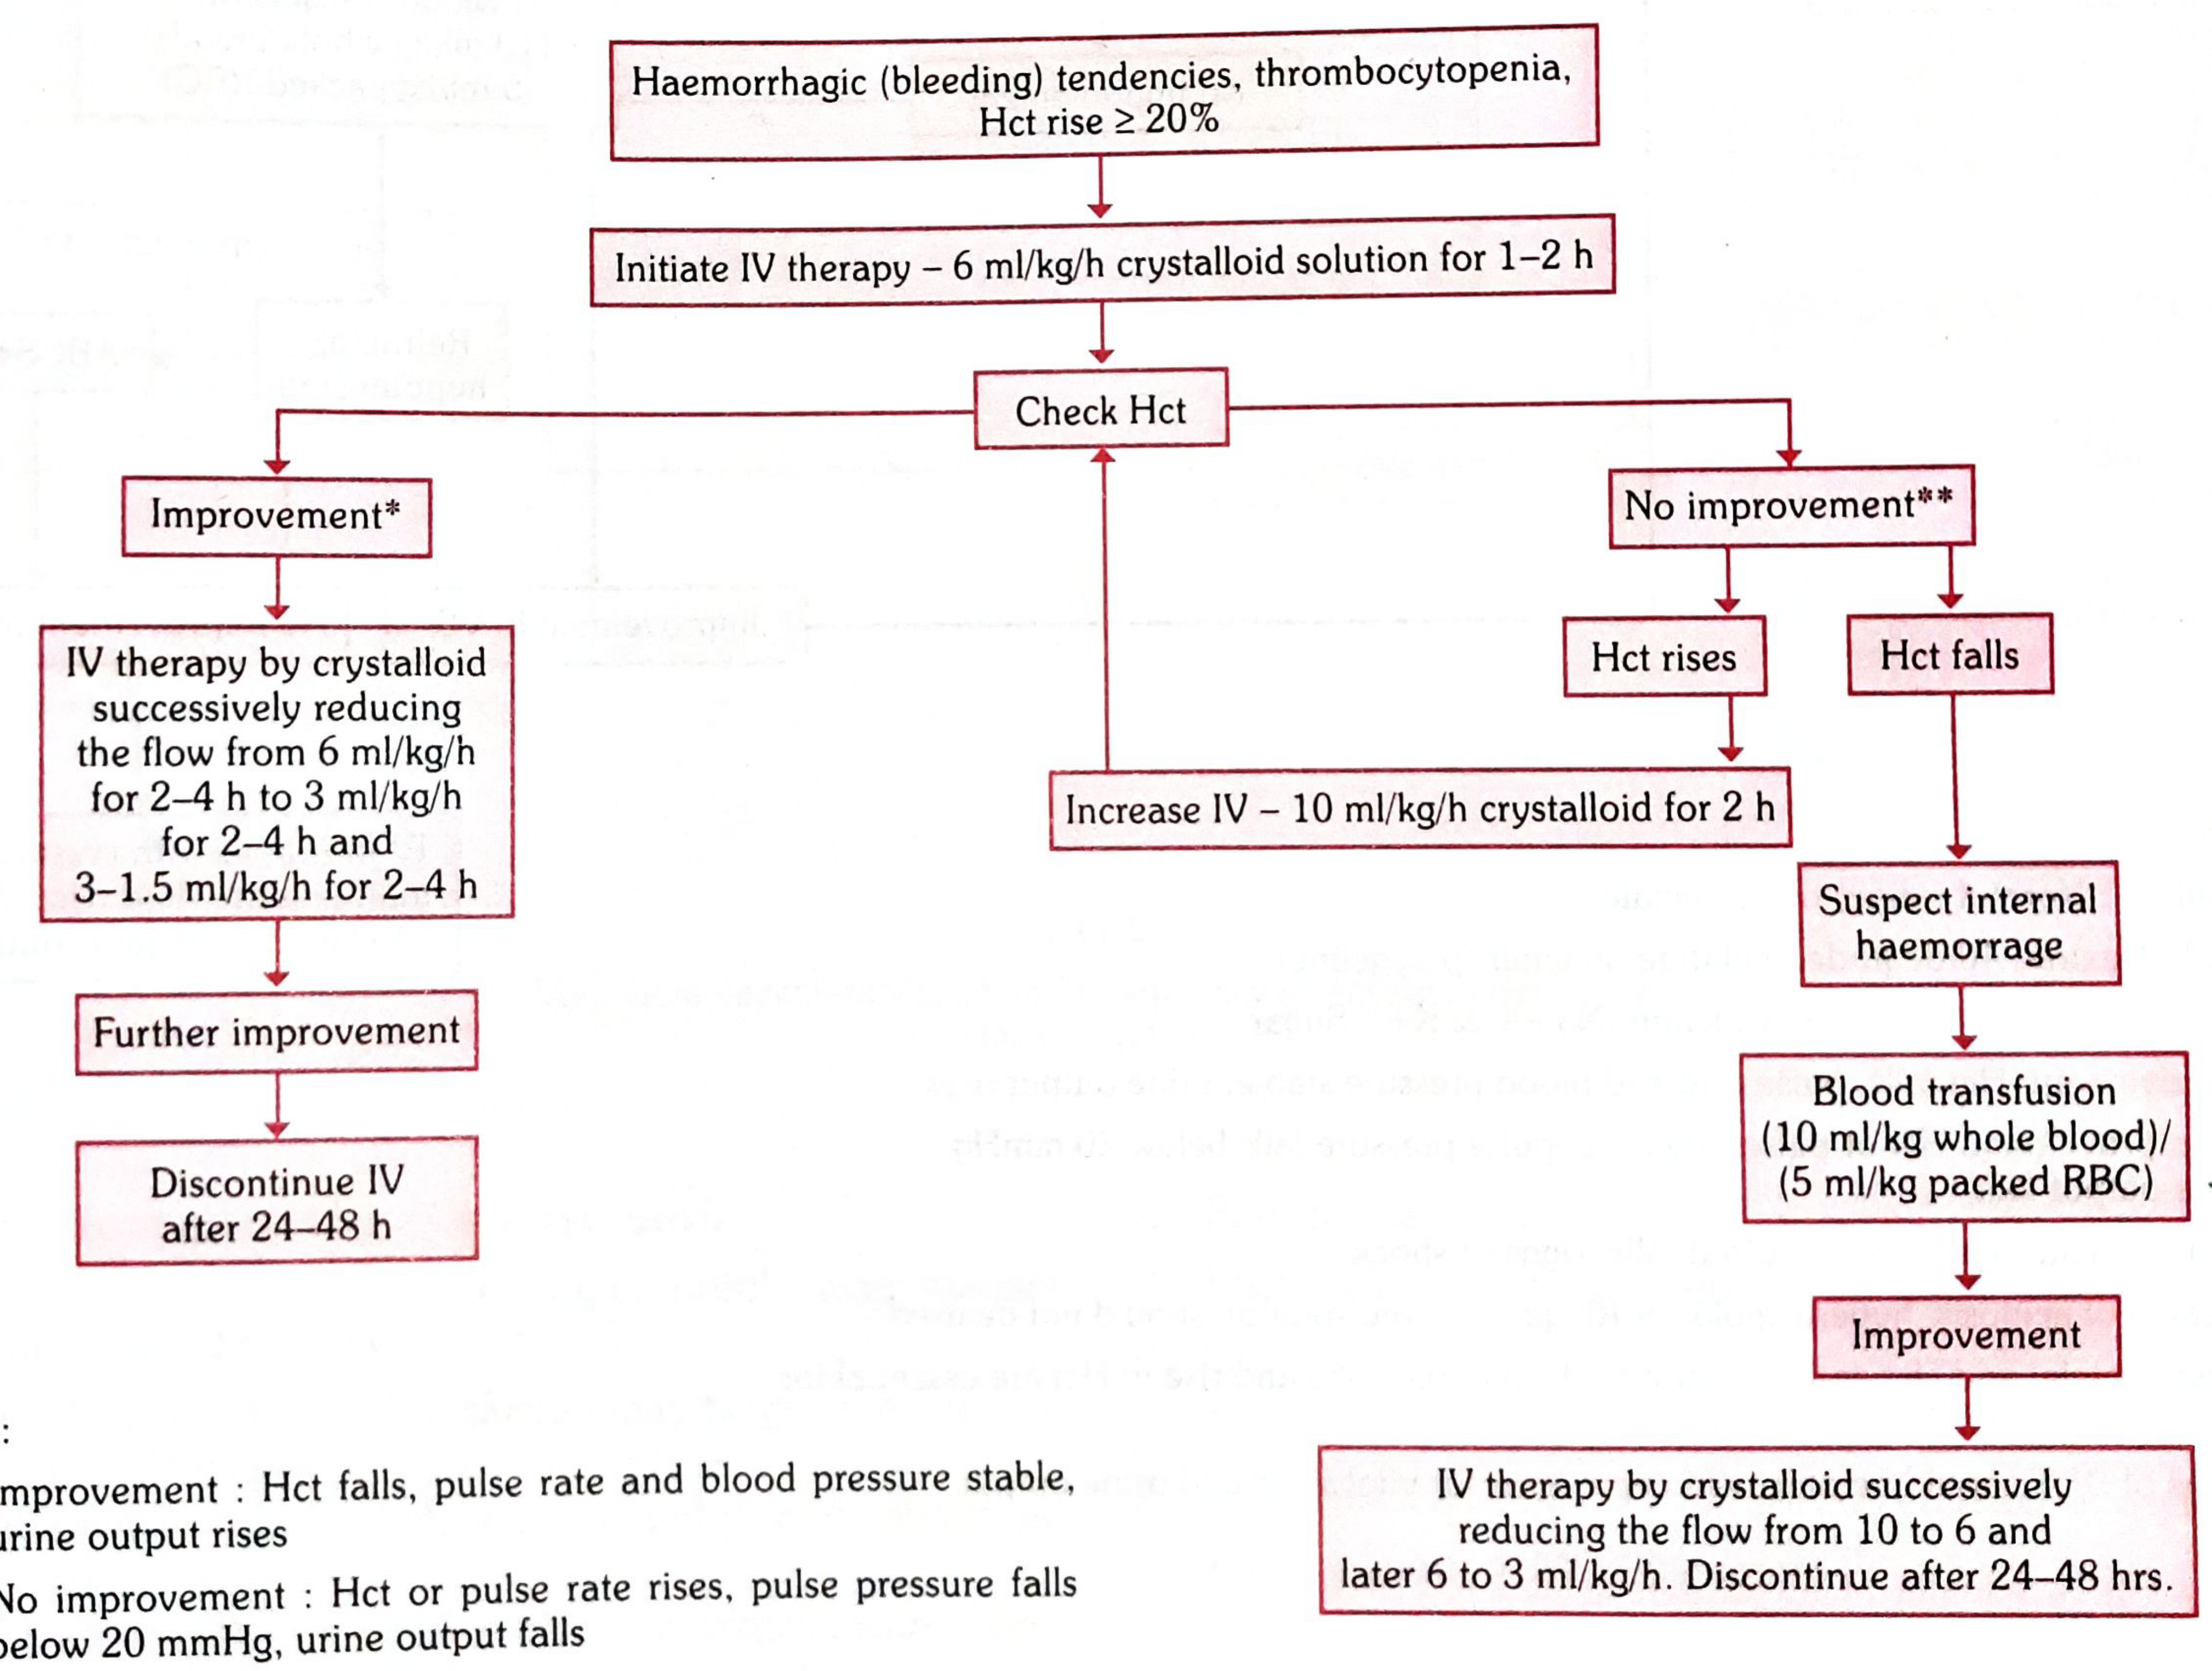
DHF Grade I and II (Warning Signs Present, No Shock)
- IV crystalloid (Normal Saline or Ringer's Lactate): 6 ml/kg/h for 1-2 hours
| Response | Action |
|---|---|
| Improvement (Hct falls, pulse/BP stable, urine output rises) | Reduce IV crystalloid stepwise: 6 → 3 → 1.5 ml/kg/h over 2-4 h each; discontinue IV after 24-48 h |
| No improvement + Hct rises | Increase to 10 ml/kg/h crystalloid for 2 hours |
| No improvement + Hct falls | Suspect internal haemorrhage → blood transfusion: 10 ml/kg whole blood or 5 ml/kg packed RBC |
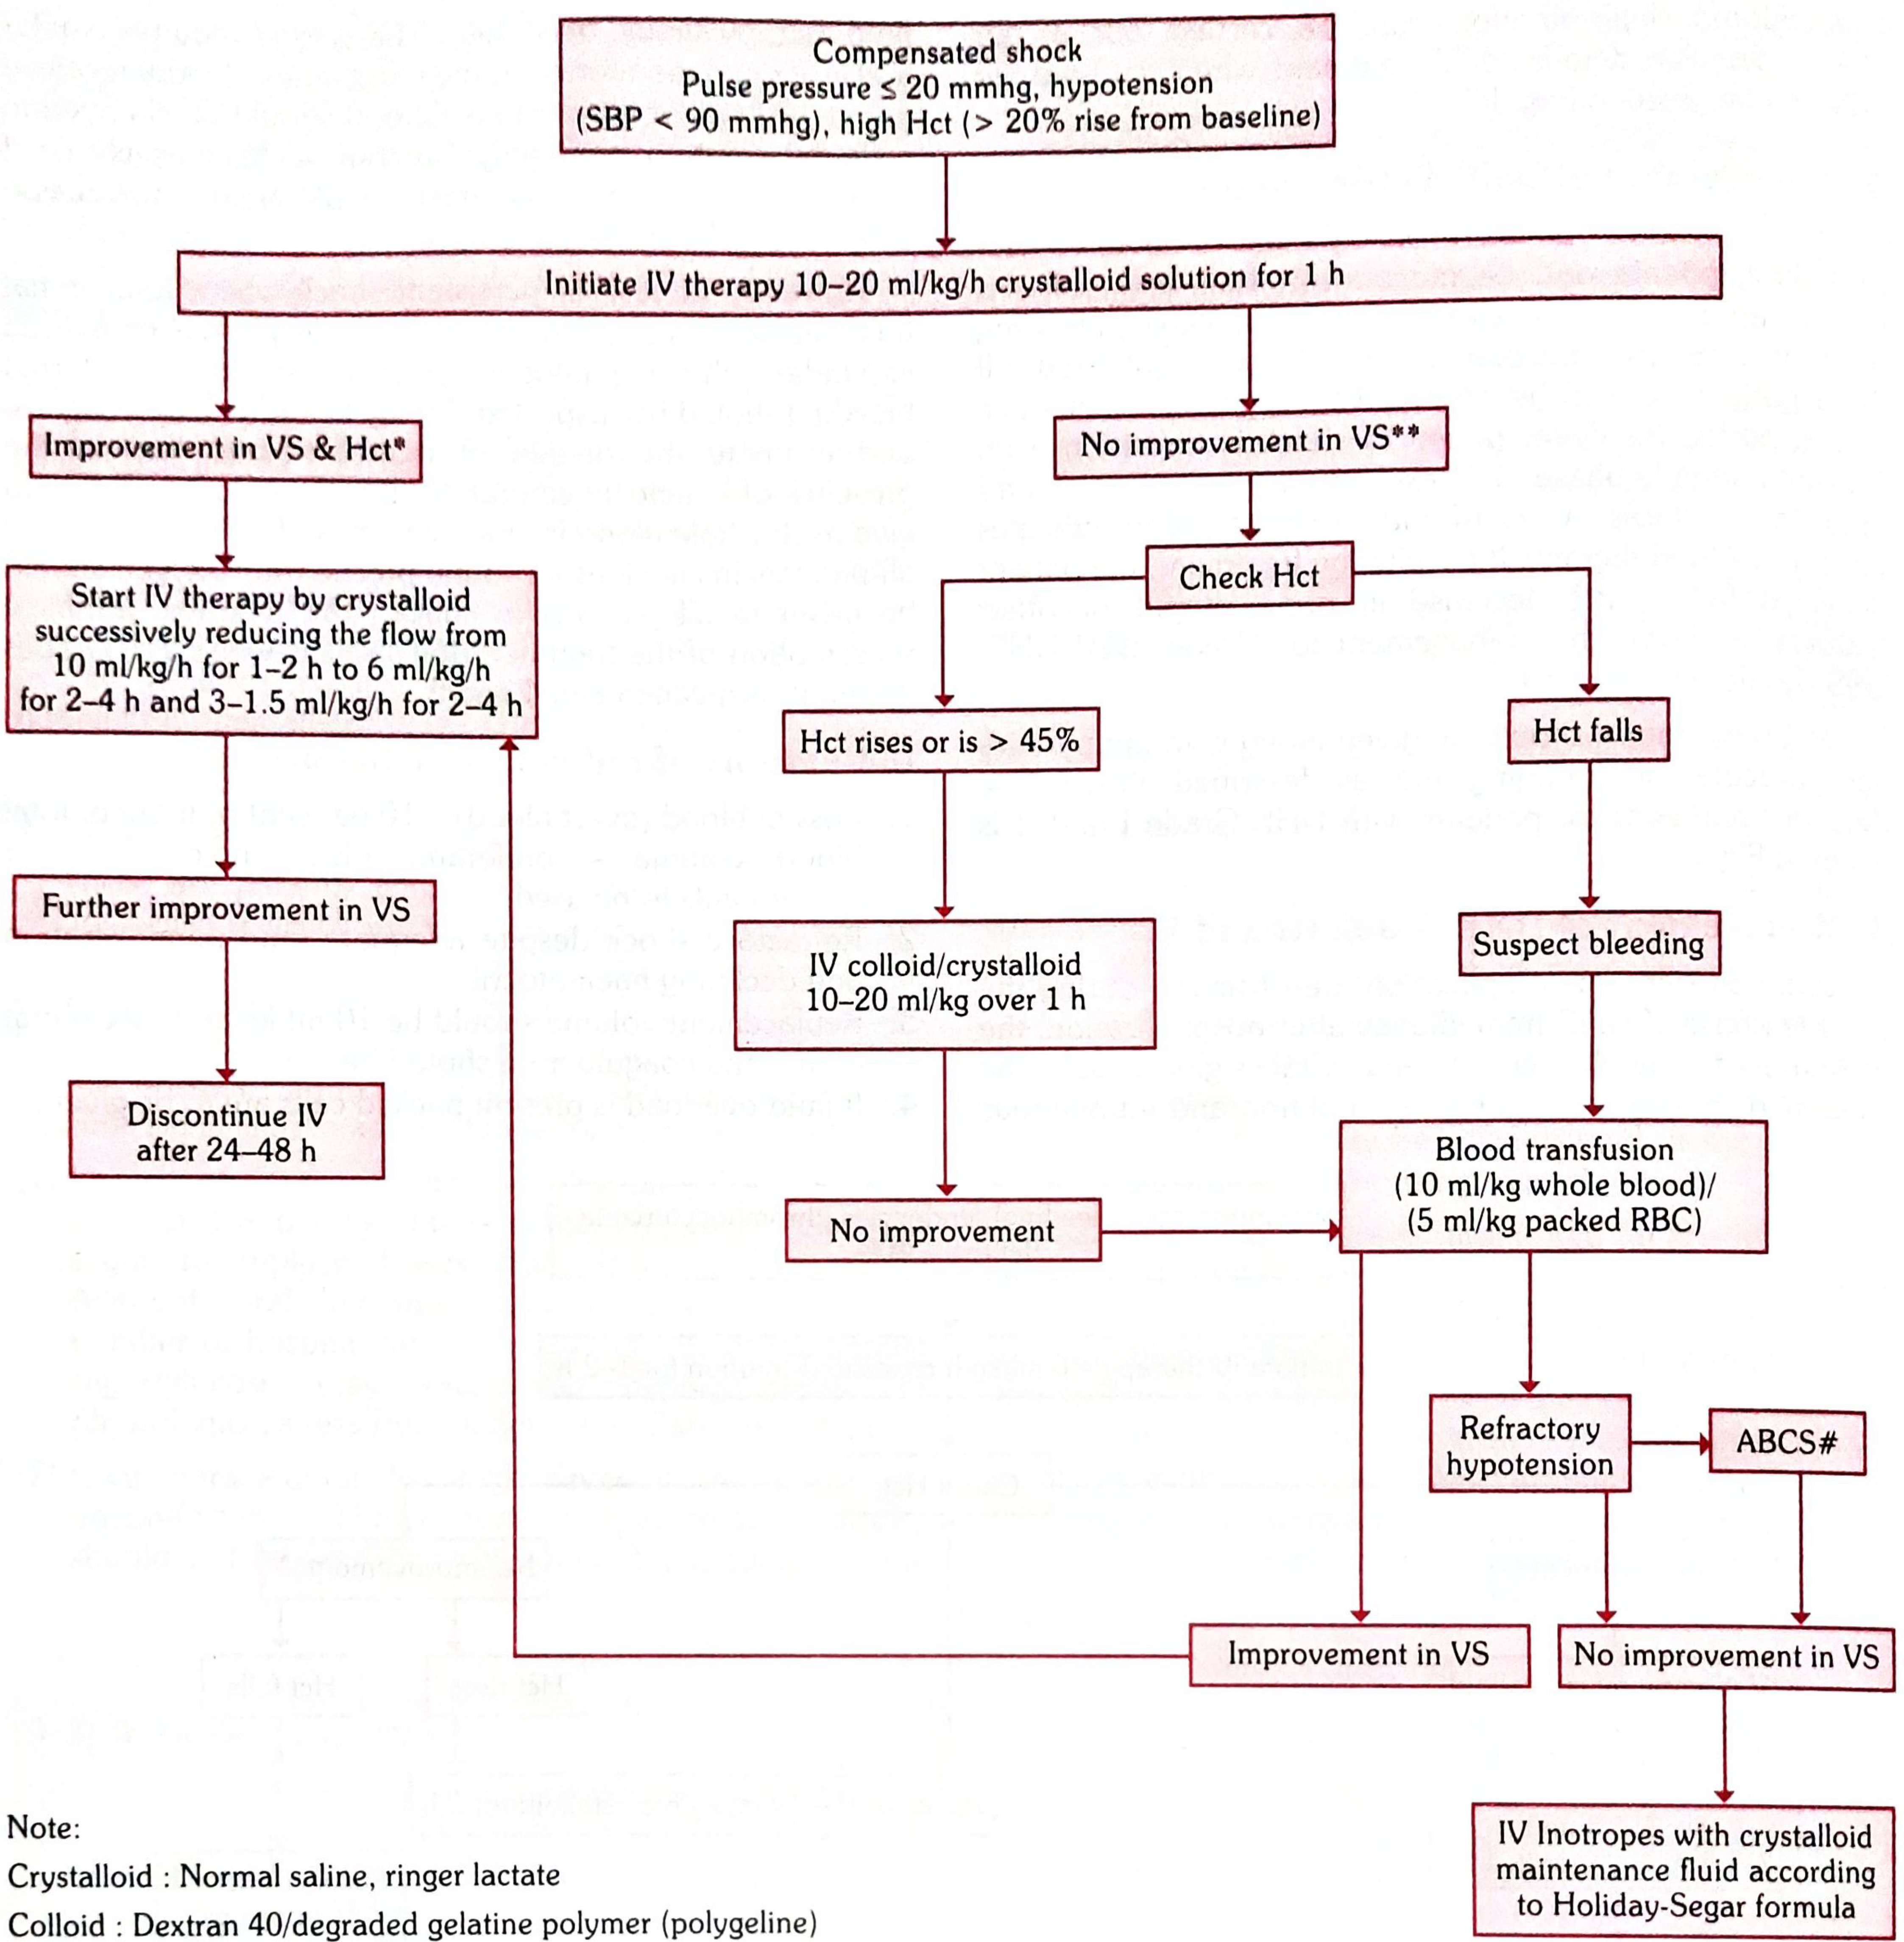
DHF Grade III (Compensated Shock)
- IV crystalloid: 10-20 ml/kg/h for 1 hour + supplemental oxygen
| Response | Action |
|---|---|
| Improvement in VS and Hct | Step down: 10 → 6 ml/kg/h (1-2 h) → 6 → 3 ml/kg/h (2-4 h) → 3 → 1.5 ml/kg/h (2-4 h); discontinue IV after 24-48 h |
| No improvement + Hct rises or > 45% | Switch to IV colloid or crystalloid 10-20 ml/kg over 1 hour |
| No improvement + Hct falls | Suspect bleeding → blood transfusion 10 ml/kg whole blood or 5 ml/kg pRBC |
| Refractory hypotension after transfusion | Check ABCS: Acidosis, Bleeding, Calcium/electrolytes, Sugar |
| No improvement despite ABCS correction | IV inotropes + crystalloid maintenance per Holiday-Segar formula |
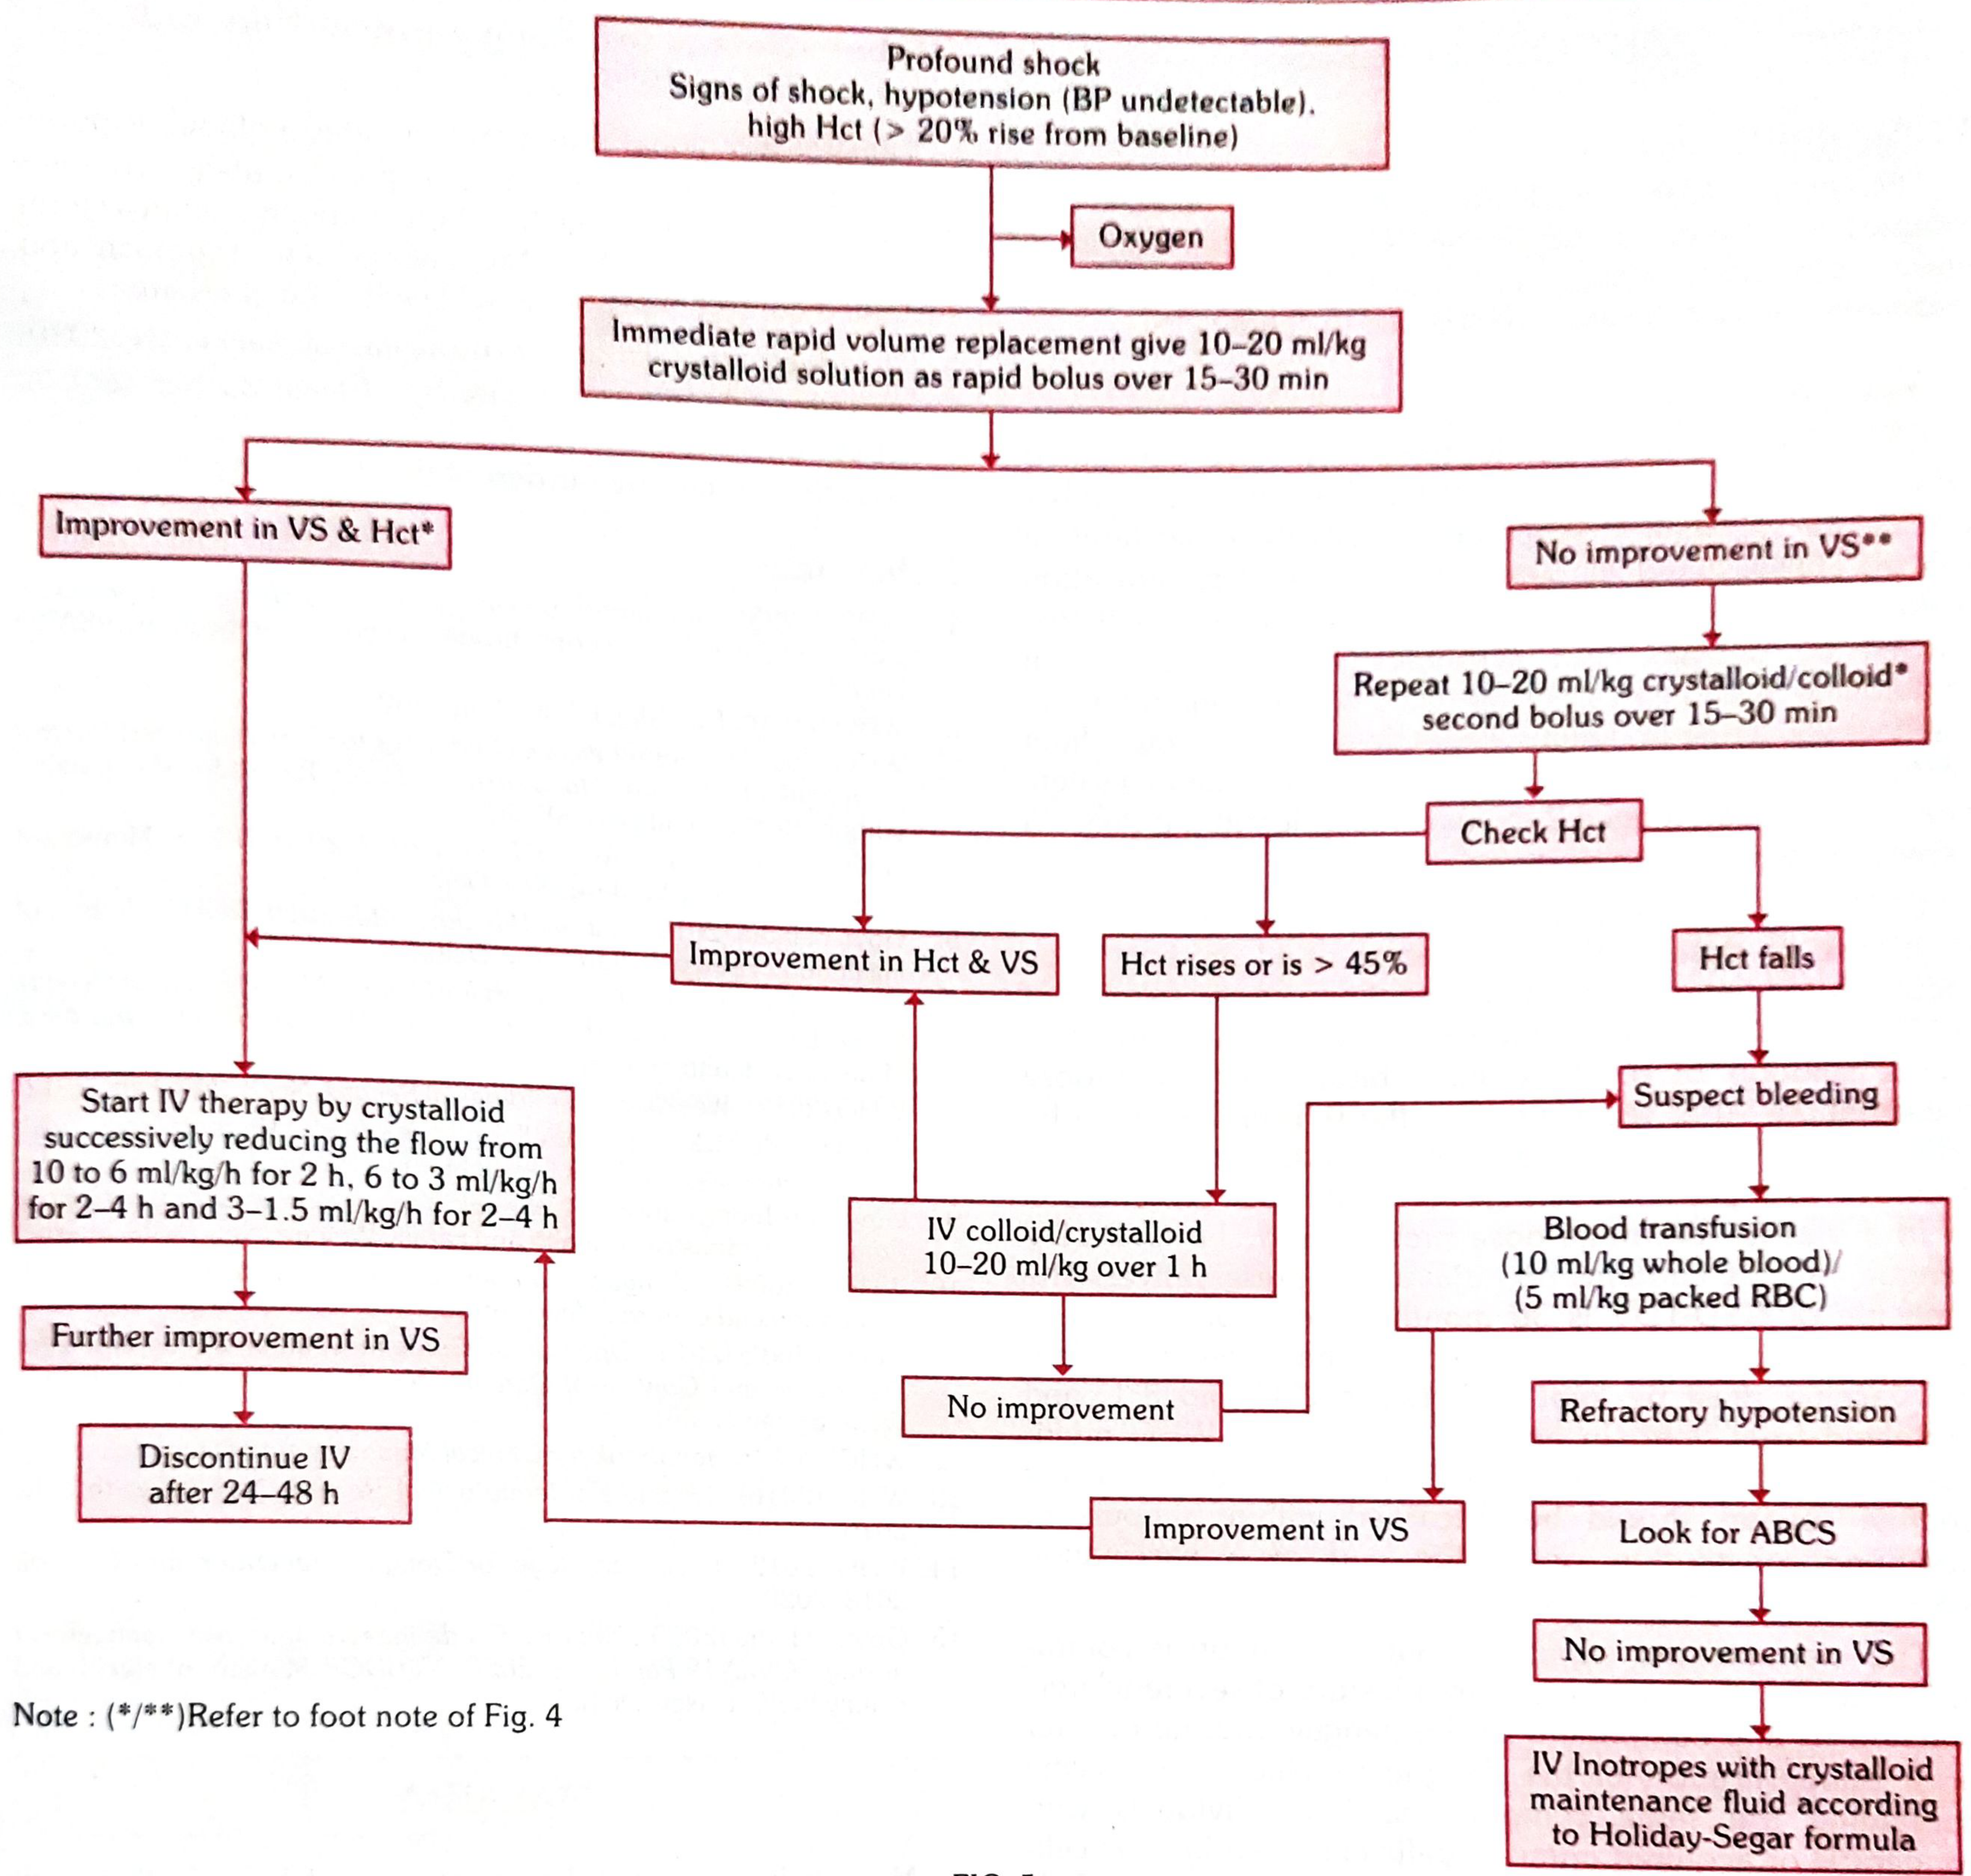
DHF Grade IV / Dengue Shock Syndrome (Profound Shock)
- Give oxygen first
- Rapid bolus: 10-20 ml/kg crystalloid over 15-30 minutes
| Response | Action |
|---|---|
| Improvement in VS and Hct | Stepwise reduction: 10 → 6 ml/kg/h (2h) → 6 → 3 ml/kg/h (2-4 h) → 3 → 1.5 ml/kg/h (2-4 h); discontinue after 24-48 h |
| No improvement | Repeat 10-20 ml/kg crystalloid/colloid as second bolus over 15-30 min |
| After second bolus, check Hct: | |
| - Hct rises or > 45% | IV colloid/crystalloid 10-20 ml/kg over 1 hour |
| - Hct falls | Suspect bleeding → blood transfusion |
| Refractory hypotension | ABCS workup → if no improvement → IV inotropes + Holiday-Segar maintenance |
Fluid Choices
| Fluid | Use |
|---|---|
| Normal saline / Ringer's Lactate | First-line crystalloid for all stages; avoid Ringer's Lactate in acidosis |
| Colloid (Dextran 40 / Polygeline/Haemaccel) | When 1000 ml of IV crystalloid has already been given with no improvement, or Hct remains high despite crystalloids |
| Whole blood (10 ml/kg) | When Hct is falling (internal haemorrhage) or refractory shock |
| Packed RBC (5 ml/kg) | Alternative to whole blood; preferred if fluid overload is present |
| Platelet transfusion | Only if platelet < 10,000/cu.mm prophylactically; if systemic massive bleeding with coagulopathy; NOT routine at < 20,000 |
Monitoring Parameters During Fluid Therapy
- Vital signs every hour during the critical phase (pulse, BP, pulse pressure)
- Urine output: target > 0.5 ml/kg/h
- Serial Hct: every 4-6 hours; a rising Hct = ongoing plasma leakage; a suddenly falling Hct = internal bleeding
- Platelet count twice daily during critical phase
- End-points of adequate resuscitation: Hct stabilizes or falls toward normal, urine output improves, pulse slows, pulse pressure widens
Recovery Phase (Days 7-8)
- Plasma reabsorption begins 48-72 hours after critical phase
- Reduce and stop IV fluids to avoid fluid overload (a major complication in recovery phase)
- Bradycardia and bradycardia with rash ("isles of white in a sea of red") are characteristic
- Diuresis signals recovery
Criteria for Hospital Discharge
- Afebrile for at least 24 hours without antipyretics
- Appetite returned
- Visible clinical improvement
- Good urine output
- Minimum 2-3 days after recovery from shock
- No respiratory distress from pleural effusion or ascites
- Platelet count > 50,000/cu.mm
Key Principles
- Haematocrit is the guide: it tracks plasma leakage better than clinical signs alone
- Avoid over-hydration: fluid overload is a recognized fatal complication - taper IV fluids as soon as the patient improves
- Colloids only when crystalloids fail at adequate rates, or when Hct is persistently very high
- Falling Hct in a shocked patient = bleeding, not improvement - give blood, not more crystalloid
- ABCS mnemonic for refractory shock: Acidosis, Bleeding, Calcium/electrolytes, Sugar
Should we give iv fluids 100ml ns / hr if hematocrit is raising
Should you give 100 ml/hr flat rate when Hct is rising?
Why weight-based dosing matters
- Underhydrates a 70 kg adult in compensated shock (needs ~700-1400 ml/hr)
- Dangerously overhydrates a 15 kg child (100 ml/hr = 6.7 ml/kg/h, which is actually reasonable, but happens to be coincidental rather than intentional)
What the protocol actually says when Hct is rising
If patient has warning signs, stable VS, no shock (DHF Grade I/II):
| Step | Action |
|---|---|
| Start | 6 ml/kg/h crystalloid (NS or RL) for 1-2 hours |
| Check Hct after 1-2 hours | |
| Hct still rising + no clinical improvement | Increase to 10 ml/kg/h for 2 hours |
| Hct rising + haemodynamic deterioration | Step up to Grade III/IV protocol |
| Hct falls + VS stable + urine output improves | Step down: 6 → 3 → 1.5 ml/kg/h |
For a 50 kg adult as a reference:
- 6 ml/kg/h = 300 ml/hr (not 100)
- 10 ml/kg/h = 500 ml/hr
- Step-down to 3 ml/kg/h = 150 ml/hr
- Step-down to 1.5 ml/kg/h = 75 ml/hr
The key principle: Hct is your titration guide
"Serial haematocrit determinations are essential guide for treatment, since they reflect the degree of plasma leakage and need for intravenous administration of fluids."
- Park's Textbook of Preventive and Social Medicine, p. 295
| Hct trend | Interpretation | Action |
|---|---|---|
| Rising despite IV fluids | Ongoing plasma leakage | Increase fluid rate |
| Stable | Leakage controlled | Maintain current rate |
| Falling + VS stable + good urine | Recovery or fluid equilibrium | Step down rate |
| Falling + shock not improving | Internal haemorrhage | Stop crystalloid escalation - give blood |