Total respiratory system notes physiology with all important points and topics in understanding way in exam point of view

Reading File
Finding Sources
Finding Sources
Finding Sources
Reading File
Reading File
Finding Sources
Reading File
Reading File
Finding Sources
Finding Sources
Reading File
Finding Sources
Reading File
Finding Sources
Reading File
Finding Sources
Reading File
Searching Images

oxygen hemoglobin dissociation curve

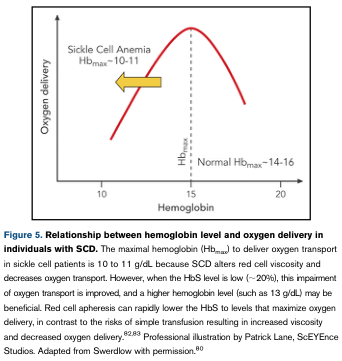
Summary : This figure illustrates the relationship between hemoglobin (Hb) level and oxygen delivery in individuals with sickle cell disease (SCD), highlighting the optimal Hb range for oxygen transport in SCD compared to normal individuals.

line plot:
# Title & Axes :
  • No explicit title on the plot, but the context is "Relationship between hemoglobin level and oxygen delivery in individuals with SCD."
  • X-axis: "Hemoglobin" (units not specified, but contextually g/dL).
  • Y-axis: "Oxygen delivery" (units not specified).
  • X-axis tick labels: 10, 15, 20.
  • Y-axis: No tick labels, only qualitative trend.

# Data Points & Series :
  • Single red curve showing oxygen delivery as a function of hemoglobin level.
  • The curve rises from Hb = 10, peaks near Hb = 14–16, then declines toward Hb = 20.
  • Arrow and annotation for "Sickle Cell Anemia Hb_max ~10–11" indicating the optimal Hb range for SCD.
  • Dashed vertical line at "Normal Hb_max ~14–16" indicating the optimal Hb range for normal individuals.

# Design Encodings :
  • Red solid line for the main curve.
  • Yellow arrow highlighting the SCD optimal Hb range.
  • Dashed vertical line for normal Hb_max.
  • Text annotations for "Sickle Cell Anemia Hb_max ~10–11" and "Normal Hb_max ~14–16".

# Distribution & Trends :
  • The curve is unimodal, peaking at intermediate Hb levels.
  • Oxygen delivery increases with Hb up to a point, then decreases at higher Hb levels.
  • The optimal Hb for SCD is lower (~10–11 g/dL) than for normal individuals (~14–16 g/dL).

# Analysis :
  • The figure visually demonstrates that the maximal oxygen delivery in SCD occurs at a lower hemoglobin level than in normal individuals, due to altered red cell viscosity and oxygen transport in SCD.
  • Increasing Hb above the SCD optimal range may decrease oxygen delivery, while lowering Hb to the optimal range can improve oxygen transport.
  • The curve supports clinical recommendations for transfusion targets in SCD patients to avoid excessive Hb levels that could impair oxygen delivery.

Summary : This figure illustrates the relationship between hemoglobin (Hb) level and oxygen delivery in individuals with sickle cell disease (SCD), highlighting the optimal Hb range for oxygen transport in SCD compared to normal individuals. line plot: # Title & Axes : • No explicit title on the plot, but the context is "Relationship between hemoglobin level and oxygen delivery in individuals with SCD." • X-axis: "Hemoglobin" (units not specified, but contextually g/dL). • Y-axis: "Oxygen delivery" (units not specified). • X-axis tick labels: 10, 15, 20. • Y-axis: No tick labels, only qualitative trend. # Data Points & Series : • Single red curve showing oxygen delivery as a function of hemoglobin level. • The curve rises from Hb = 10, peaks near Hb = 14–16, then declines toward Hb = 20. • Arrow and annotation for "Sickle Cell Anemia Hb_max ~10–11" indicating the optimal Hb range for SCD. • Dashed vertical line at "Normal Hb_max ~14–16" indicating the optimal Hb range for normal individuals. # Design Encodings : • Red solid line for the main curve. • Yellow arrow highlighting the SCD optimal Hb range. • Dashed vertical line for normal Hb_max. • Text annotations for "Sickle Cell Anemia Hb_max ~10–11" and "Normal Hb_max ~14–16". # Distribution & Trends : • The curve is unimodal, peaking at intermediate Hb levels. • Oxygen delivery increases with Hb up to a point, then decreases at higher Hb levels. • The optimal Hb for SCD is lower (~10–11 g/dL) than for normal individuals (~14–16 g/dL). # Analysis : • The figure visually demonstrates that the maximal oxygen delivery in SCD occurs at a lower hemoglobin level than in normal individuals, due to altered red cell viscosity and oxygen transport in SCD. • Increasing Hb above the SCD optimal range may decrease oxygen delivery, while lowering Hb to the optimal range can improve oxygen transport. • The curve supports clinical recommendations for transfusion targets in SCD patients to avoid excessive Hb levels that could impair oxygen delivery.

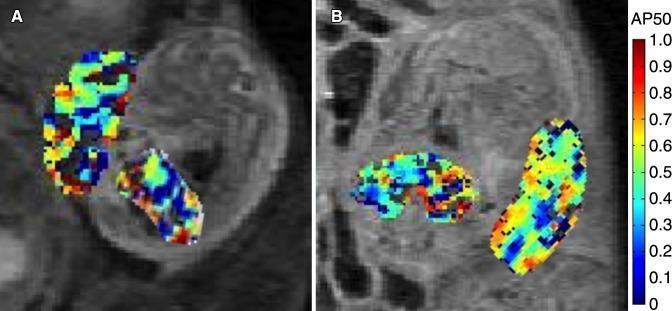
This diagnostic image set displays two functional MR images (A and B) showing maternal-fetal units in a mouse model at embryonic days 14.5 and 17.5. The images feature overlaid color-coded AP50 maps, which represent fetal and placental oxygen-hemoglobin dissociation parameters. In both panels, the placenta and fetal liver are isolated as regions of interest. A vertical color bar on the right side indicates AP50 values scaled from 0 to 1.0, with cool colors (dark blue) representing lower values and warm colors (red/orange) representing higher values. Panel A (day 14.5) demonstrates a heterogeneous distribution of oxygenation parameters within the tissues, showing a mix of green, yellow, and blue pixels. Panel B (day 17.5) illustrates the progression of these physiological markers over time, with the placental AP50 values showing a significant spatial shift toward warmer colors, reflecting changes in oxygen transfer efficiency. These maps provide a non-invasive visual method for studying fetal oxygenation and placental function during gestation.

This diagnostic image set displays two functional MR images (A and B) showing maternal-fetal units in a mouse model at embryonic days 14.5 and 17.5. The images feature overlaid color-coded AP50 maps, which represent fetal and placental oxygen-hemoglobin dissociation parameters. In both panels, the placenta and fetal liver are isolated as regions of interest. A vertical color bar on the right side indicates AP50 values scaled from 0 to 1.0, with cool colors (dark blue) representing lower values and warm colors (red/orange) representing higher values. Panel A (day 14.5) demonstrates a heterogeneous distribution of oxygenation parameters within the tissues, showing a mix of green, yellow, and blue pixels. Panel B (day 17.5) illustrates the progression of these physiological markers over time, with the placental AP50 values showing a significant spatial shift toward warmer colors, reflecting changes in oxygen transfer efficiency. These maps provide a non-invasive visual method for studying fetal oxygenation and placental function during gestation.

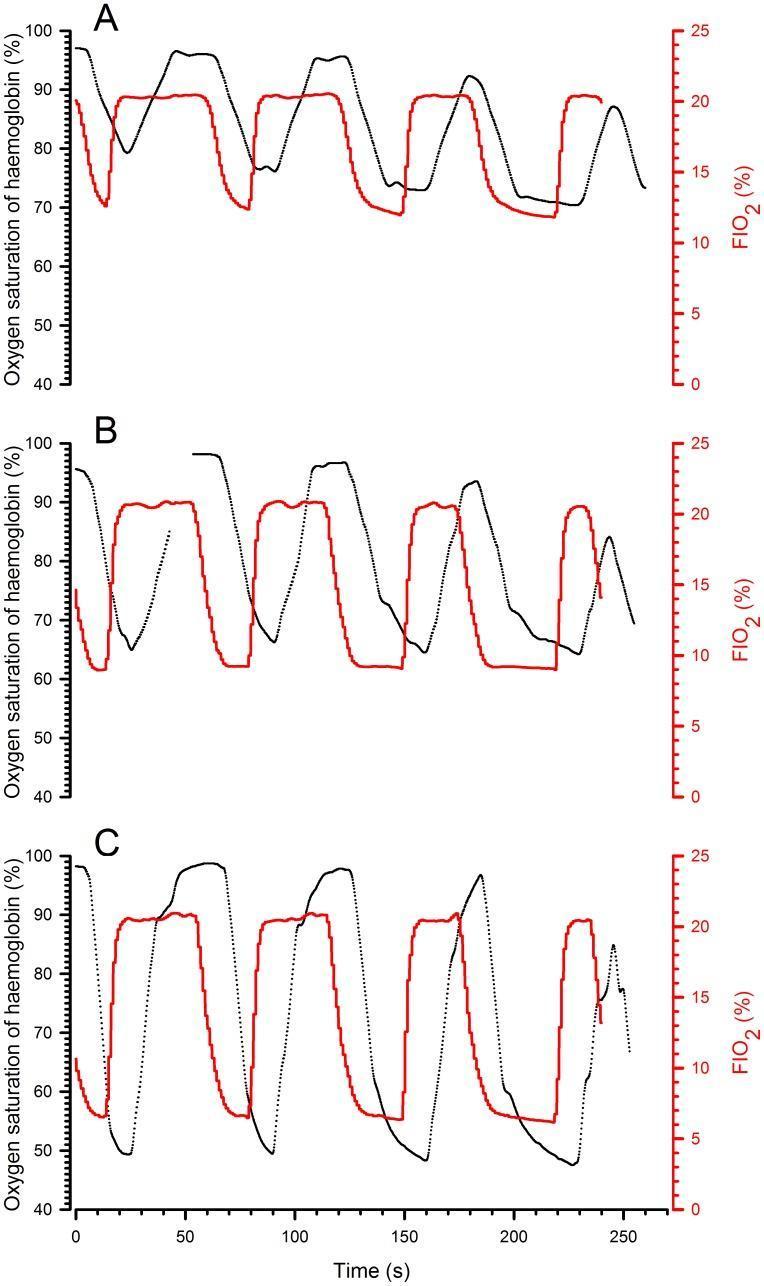
This physiological data visualization consists of three stacked line graphs (A, B, and C) depicting the relationship between inspired oxygen concentration (FIO2) and hemoglobin oxygen saturation over time in a cyclic hypoxia-reoxygenation model. The horizontal x-axis represents time in seconds (0 to 250s). Each graph features dual y-axes: the left axis measures 'Oxygen saturation of haemoglobin (%)' from 40% to 100%, represented by a black line; the right red axis measures 'FIO2 (%)' from 0% to 25%, represented by a red line. The graphs demonstrate physiological response to progressively longer hypoxic phases (15s, 20s, 30s, and 40s) across four cycles. Graph A shows mild hypoxia (FIO2 12%), Graph B shows moderate hypoxia (FIO2 9%), and Graph C shows severe hypoxia (FIO2 6%). Key clinical concepts illustrated include the latency period between FIO2 changes and hemoglobin desaturation, the nadir of saturation proportional to FIO2 severity, and the incomplete resaturation occurring when normoxic intervals are insufficient. These records provide a representative look at respiratory physiology and gas exchange dynamics during intermittent hypoxia.

This physiological data visualization consists of three stacked line graphs (A, B, and C) depicting the relationship between inspired oxygen concentration (FIO2) and hemoglobin oxygen saturation over time in a cyclic hypoxia-reoxygenation model. The horizontal x-axis represents time in seconds (0 to 250s). Each graph features dual y-axes: the left axis measures 'Oxygen saturation of haemoglobin (%)' from 40% to 100%, represented by a black line; the right red axis measures 'FIO2 (%)' from 0% to 25%, represented by a red line. The graphs demonstrate physiological response to progressively longer hypoxic phases (15s, 20s, 30s, and 40s) across four cycles. Graph A shows mild hypoxia (FIO2 12%), Graph B shows moderate hypoxia (FIO2 9%), and Graph C shows severe hypoxia (FIO2 6%). Key clinical concepts illustrated include the latency period between FIO2 changes and hemoglobin desaturation, the nadir of saturation proportional to FIO2 severity, and the incomplete resaturation occurring when normoxic intervals are insufficient. These records provide a representative look at respiratory physiology and gas exchange dynamics during intermittent hypoxia.

Searching Images

lung volumes capacities spirometry diagram

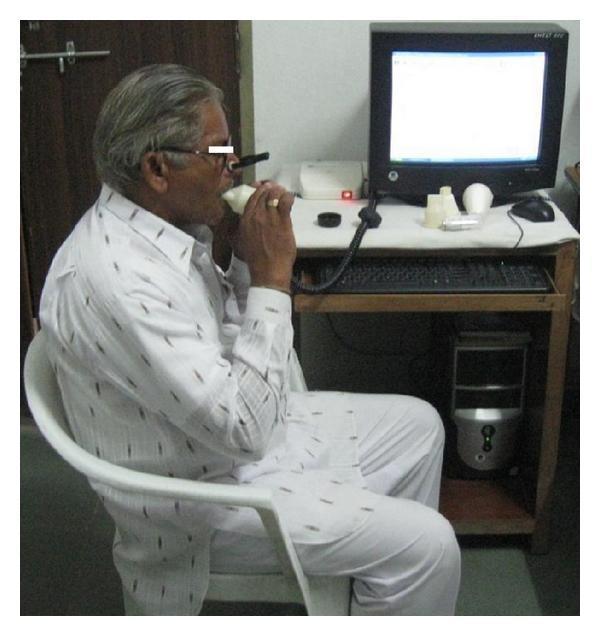
A clinical photograph illustrating a patient performing a Pulmonary Function Test (PFT) via spirometry in a clinical or research setting. The image depicts an older adult male seated upright, wearing a nose clip to ensure mouth-only breathing. He is actively interacting with a handheld spirometer, holding the disposable mouthpiece with both hands to maintain a tight seal. The device is connected via a data cable to a computer system, which includes a monitor displaying an active interface, likely for real-time visualization of flow-volume loops and spirograms. On the desk, several replacement white cylindrical mouthpieces and the hardware interface are visible. This visual serves as an educational example of the standardized setup for measuring lung volumes and ventilation capacities, such as Forced Vital Capacity (FVC) and Forced Expiratory Volume in 1 second (FEV1), highlighting the necessary equipment and proper patient positioning during the procedure.

A clinical photograph illustrating a patient performing a Pulmonary Function Test (PFT) via spirometry in a clinical or research setting. The image depicts an older adult male seated upright, wearing a nose clip to ensure mouth-only breathing. He is actively interacting with a handheld spirometer, holding the disposable mouthpiece with both hands to maintain a tight seal. The device is connected via a data cable to a computer system, which includes a monitor displaying an active interface, likely for real-time visualization of flow-volume loops and spirograms. On the desk, several replacement white cylindrical mouthpieces and the hardware interface are visible. This visual serves as an educational example of the standardized setup for measuring lung volumes and ventilation capacities, such as Forced Vital Capacity (FVC) and Forced Expiratory Volume in 1 second (FEV1), highlighting the necessary equipment and proper patient positioning during the procedure.

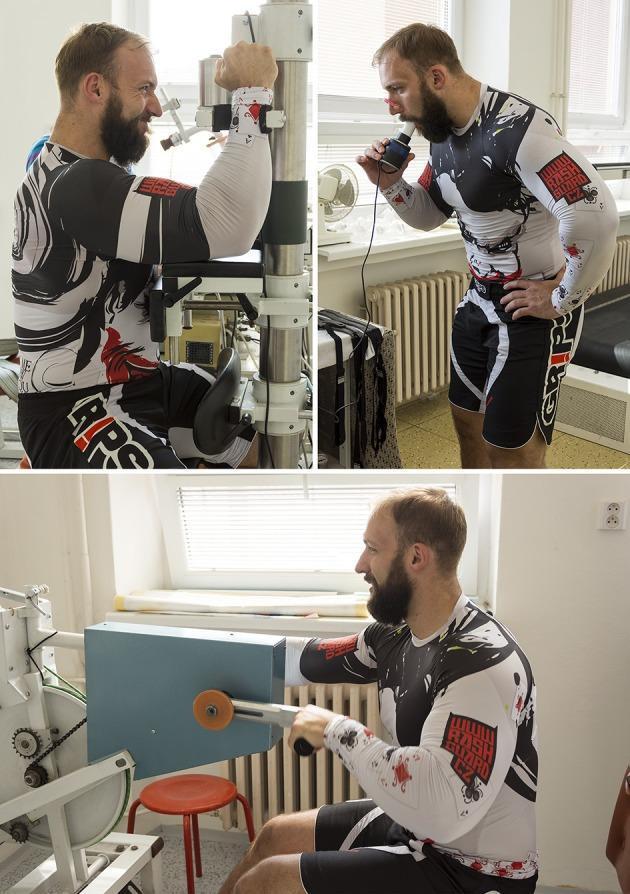
This composite of clinical photographs illustrates three standard methods for assessing physical performance and physiological capacity in a laboratory setting. Top Left: A participant undergoes maximal isometric strength measurement using an arm extension dynamometer. The subject is seated with the upper limb secured to a mechanical lever arm equipped with force transducers to quantify torque and muscular exertion. Top Right: A measurement of pulmonary function (spirometry) is shown. The participant uses a handheld spirometer with a nose clip to ensure isolated oral airflow, measuring lung volumes and capacities such as FVC and FEV1. Bottom: The participant is engaged in an anaerobic capacity assessment via a Wingate anaerobic test. This involves high-intensity cycling on a specialized ergometer to measure peak power, anaerobic fatigue, and total anaerobic work. These tests are essential in sports medicine and exercise physiology for evaluating cardiovascular fitness, neuromuscular strength, and metabolic efficiency.

This composite of clinical photographs illustrates three standard methods for assessing physical performance and physiological capacity in a laboratory setting. Top Left: A participant undergoes maximal isometric strength measurement using an arm extension dynamometer. The subject is seated with the upper limb secured to a mechanical lever arm equipped with force transducers to quantify torque and muscular exertion. Top Right: A measurement of pulmonary function (spirometry) is shown. The participant uses a handheld spirometer with a nose clip to ensure isolated oral airflow, measuring lung volumes and capacities such as FVC and FEV1. Bottom: The participant is engaged in an anaerobic capacity assessment via a Wingate anaerobic test. This involves high-intensity cycling on a specialized ergometer to measure peak power, anaerobic fatigue, and total anaerobic work. These tests are essential in sports medicine and exercise physiology for evaluating cardiovascular fitness, neuromuscular strength, and metabolic efficiency.

Searching Images

ventilation perfusion V/Q mismatch diagram zones lung

**Imaging Modality:** Lung Scintigraphy (V/Q Scan)

**Anatomical Region:** Bilateral lungs, thoracic cavity.

**Observed Pathology:** The image demonstrates a classic ventilation-perfusion (V/Q) mismatch. The perfusion scan (right panel) reveals multiple large, wedge-shaped, segmental photopenic areas indicating significant perfusion defects throughout both lung fields. Conversely, the ventilation scan (left panel) shows relatively homogeneous tracer distribution without corresponding filling defects.

**Characteristic Visual Features:**
*   **Perfusion Scan:** Multi-focal areas of absent or diminished radiopharmaceutical uptake, particularly noted in the middle and lower zones of the right lung and the mid-zone of the left lung.
*   **Ventilation Scan:** Preserved ventilation across both lung fields, contrasting with the perfusion irregularities.
*   **Pattern:** Non-matched defects, where ventilation is normal in areas of absent perfusion.

**Clinical Context and Diagnostic Features:** This V/Q mismatch pattern is highly suggestive of pulmonary embolism (PE). The presence of multiple segmental perfusion defects in the setting of normal ventilation is the primary diagnostic criterion for a "high probability" lung scan for thromboembolic disease. These findings allow for the differentiation from obstructive lung diseases, which typically present with matched V/Q defects.

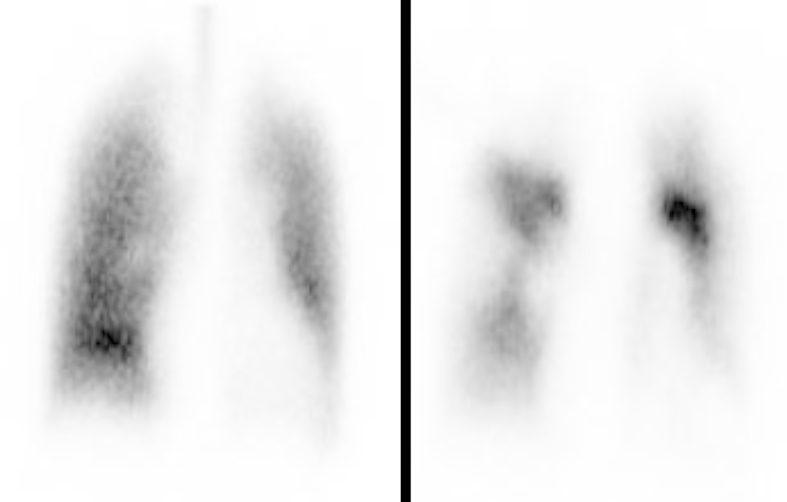
**Imaging Modality:** Lung Scintigraphy (V/Q Scan) **Anatomical Region:** Bilateral lungs, thoracic cavity. **Observed Pathology:** The image demonstrates a classic ventilation-perfusion (V/Q) mismatch. The perfusion scan (right panel) reveals multiple large, wedge-shaped, segmental photopenic areas indicating significant perfusion defects throughout both lung fields. Conversely, the ventilation scan (left panel) shows relatively homogeneous tracer distribution without corresponding filling defects. **Characteristic Visual Features:** * **Perfusion Scan:** Multi-focal areas of absent or diminished radiopharmaceutical uptake, particularly noted in the middle and lower zones of the right lung and the mid-zone of the left lung. * **Ventilation Scan:** Preserved ventilation across both lung fields, contrasting with the perfusion irregularities. * **Pattern:** Non-matched defects, where ventilation is normal in areas of absent perfusion. **Clinical Context and Diagnostic Features:** This V/Q mismatch pattern is highly suggestive of pulmonary embolism (PE). The presence of multiple segmental perfusion defects in the setting of normal ventilation is the primary diagnostic criterion for a "high probability" lung scan for thromboembolic disease. These findings allow for the differentiation from obstructive lung diseases, which typically present with matched V/Q defects.

**Imaging Modality:** Ventilation-Perfusion (V/Q) Lung Scintigraphy / SPECT-CT Fusion image.

**Anatomical Region:** Bilateral thoracic cavity and lungs.

**Observed Pathology:** The image demonstrates a significant ventilation-perfusion mismatch localized to the left lung. While the right lung shows relatively homogeneous and preserved tracer distribution, the left lung exhibits a large, segmental, wedge-shaped area of absent or severely diminished perfusion in the lower lobe and mid-lung zones.

**Characteristic Visual Features:** 
- **Right Lung:** Normal tracer uptake appearing as green-to-yellow pseudo-coloring, indicating balanced ventilation and perfusion.
- **Left Lung:** A distinct "cold zone" or photopenic area is visible in the lower two-thirds of the lung field, represented by a dark/purple-black void against the functional tracer. This indicates a profound perfusion deficit.
- **Distribution:** The deficit is peripheral and follows a segmental distribution, characteristic of vascular occlusion.

**Key Diagnostic Features:** The presence of a V/Q mismatch—characterized by preserved lung volume/structure but focal absence of blood flow—is a primary scintigraphic hallmark of pulmonary embolism or significant pulmonary arterial obstruction. The image highlights the functional disparity between the two hemithoraces.

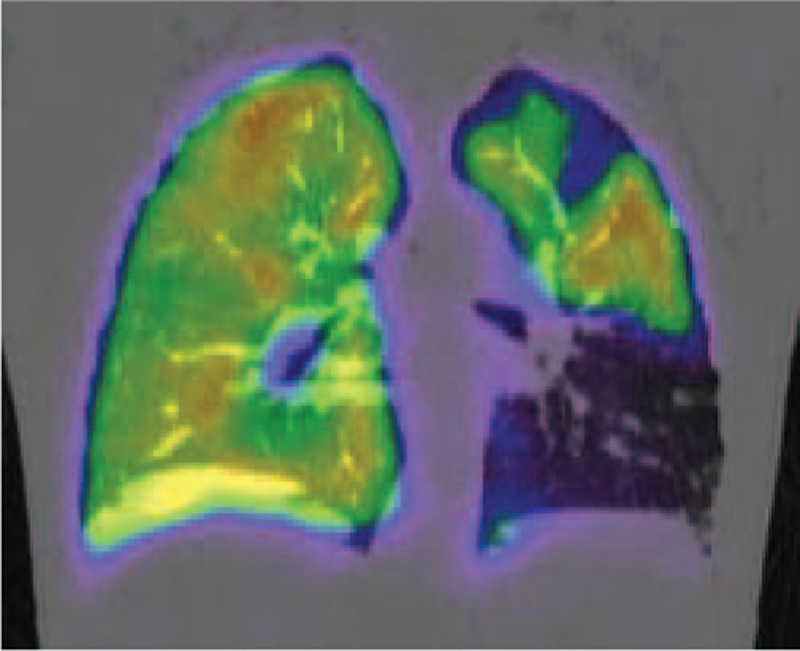
**Imaging Modality:** Ventilation-Perfusion (V/Q) Lung Scintigraphy / SPECT-CT Fusion image. **Anatomical Region:** Bilateral thoracic cavity and lungs. **Observed Pathology:** The image demonstrates a significant ventilation-perfusion mismatch localized to the left lung. While the right lung shows relatively homogeneous and preserved tracer distribution, the left lung exhibits a large, segmental, wedge-shaped area of absent or severely diminished perfusion in the lower lobe and mid-lung zones. **Characteristic Visual Features:** - **Right Lung:** Normal tracer uptake appearing as green-to-yellow pseudo-coloring, indicating balanced ventilation and perfusion. - **Left Lung:** A distinct "cold zone" or photopenic area is visible in the lower two-thirds of the lung field, represented by a dark/purple-black void against the functional tracer. This indicates a profound perfusion deficit. - **Distribution:** The deficit is peripheral and follows a segmental distribution, characteristic of vascular occlusion. **Key Diagnostic Features:** The presence of a V/Q mismatch—characterized by preserved lung volume/structure but focal absence of blood flow—is a primary scintigraphic hallmark of pulmonary embolism or significant pulmonary arterial obstruction. The image highlights the functional disparity between the two hemithoraces.

Loading Image
Loading Image
Searching Images

pulmonary compliance surfactant surface tension lung mechanics

This composite educational graphic combines a line chart and four serial chest radiographs illustrating the correlation between lung compliance and radiographic improvement in a pediatric patient. The line graph at the top tracks pulmonary compliance (ml/cmH2O) over five days (Day 11 to Day 15), showing a steady upward trend interrupted by transient dips following medical interventions. Four supine anteroposterior (AP) chest X-rays correspond to specific time points. Image (a) on Day 11 shows bilateral hazy opacities, particularly on the right, suggesting pulmonary edema or consolidation. Image (b) on Day 12 reveals a persistent right-sided opacity prior to lavage and hematoma removal. Image (c) on Day 13 shows improved lung volumes and increased radiolucency before surfactant administration. Image (d) on Day 15 demonstrates significantly improved aeration with clear costophrenic angles and visible pulmonary vasculature, correlating with the highest recorded compliance levels on the graph. The presence of medical devices, including an endotracheal tube and monitors, indicates critical care management, likely during ECMO support.

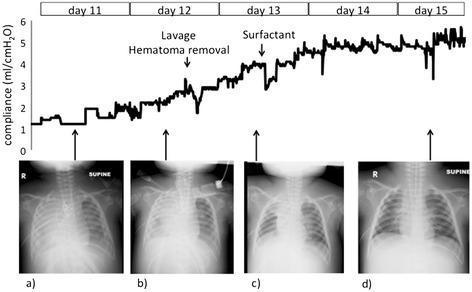
This composite educational graphic combines a line chart and four serial chest radiographs illustrating the correlation between lung compliance and radiographic improvement in a pediatric patient. The line graph at the top tracks pulmonary compliance (ml/cmH2O) over five days (Day 11 to Day 15), showing a steady upward trend interrupted by transient dips following medical interventions. Four supine anteroposterior (AP) chest X-rays correspond to specific time points. Image (a) on Day 11 shows bilateral hazy opacities, particularly on the right, suggesting pulmonary edema or consolidation. Image (b) on Day 12 reveals a persistent right-sided opacity prior to lavage and hematoma removal. Image (c) on Day 13 shows improved lung volumes and increased radiolucency before surfactant administration. Image (d) on Day 15 demonstrates significantly improved aeration with clear costophrenic angles and visible pulmonary vasculature, correlating with the highest recorded compliance levels on the graph. The presence of medical devices, including an endotracheal tube and monitors, indicates critical care management, likely during ECMO support.

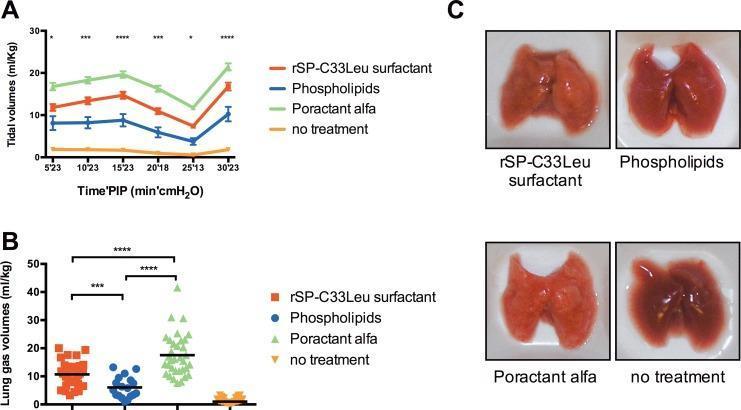
This composite educational image illustrates the effects of different surfactant treatments on pulmonary function and morphology in a premature rabbit model of Respiratory Distress Syndrome (RDS). Panel A is a line graph showing tidal volumes (ml/kg) over a 30-minute ventilation period across four groups: rSP-C33Leu surfactant (orange), Phospholipids (blue), Poractant alfa (green), and no treatment (yellow). Panel B is a scatter plot depicting lung gas volumes (ml/kg) at the end of ventilation, showing median values for the same experimental groups. Panel C features four macroscopic clinical photographs of excised lungs from each treatment group. The photographs visually compare lung expansion and aeration: lungs treated with Poractant alfa and rSP-C33Leu appear lighter, pinker, and more uniformly inflated, whereas lungs from the 'no treatment' and 'phospholipids' groups appear darker, more congested, and exhibit significant atelectasis (collapse). This infographic serves to demonstrate the therapeutic efficacy of recombinant SP-C based synthetic surfactants in improving lung compliance and gas exchange compared to phospholipid-only controls.

This composite educational image illustrates the effects of different surfactant treatments on pulmonary function and morphology in a premature rabbit model of Respiratory Distress Syndrome (RDS). Panel A is a line graph showing tidal volumes (ml/kg) over a 30-minute ventilation period across four groups: rSP-C33Leu surfactant (orange), Phospholipids (blue), Poractant alfa (green), and no treatment (yellow). Panel B is a scatter plot depicting lung gas volumes (ml/kg) at the end of ventilation, showing median values for the same experimental groups. Panel C features four macroscopic clinical photographs of excised lungs from each treatment group. The photographs visually compare lung expansion and aeration: lungs treated with Poractant alfa and rSP-C33Leu appear lighter, pinker, and more uniformly inflated, whereas lungs from the 'no treatment' and 'phospholipids' groups appear darker, more congested, and exhibit significant atelectasis (collapse). This infographic serves to demonstrate the therapeutic efficacy of recombinant SP-C based synthetic surfactants in improving lung compliance and gas exchange compared to phospholipid-only controls.

I now have comprehensive content from authoritative textbooks (Costanzo Physiology, Guyton & Hall, Ganong's Review). Let me compile the complete respiratory physiology notes.

🫁 Respiratory System - Complete Physiology Notes (Exam Focused)

Sources: Costanzo Physiology 7th Ed., Guyton & Hall Medical Physiology, Ganong's Review of Medical Physiology

📌 OVERVIEW

The respiratory system has two main goals:
  1. Deliver O₂ from the atmosphere to the tissues
  2. Remove CO₂ from the tissues to the atmosphere
At rest: 12-15 breaths/min × ~500 mL = 6-8 L/min inspired air. O₂ uptake = 250 mL/min; CO₂ output = 200 mL/min.

1. LUNG VOLUMES AND CAPACITIES

🔑 Four Basic Volumes (measured by spirometry)

VolumeAbbreviationNormal ValueDescription
Tidal VolumeTV/Vt500 mLAir moved per normal breath
Inspiratory Reserve VolumeIRV3000 mLExtra air inspired above TV
Expiratory Reserve VolumeERV1200 mLExtra air expired below TV
Residual VolumeRV1200 mLAir remaining after maximal expiration
⚠️ Exam Tip: RV cannot be measured by spirometry (cannot be exhaled). Lung capacities that include RV (FRC, TLC) also cannot be directly measured by spirometry.

🔑 Four Capacities (each = sum of 2+ volumes)

CapacityFormulaNormal Value
Inspiratory Capacity (IC)TV + IRV3500 mL
Functional Residual Capacity (FRC)ERV + RV2400 mL
Vital Capacity (VC)IC + ERV4700 mL
Total Lung Capacity (TLC)VC + RV5900 mL
FRC = equilibrium volume of the lungs after a normal tidal expiration. It is the balance point between lung elastic recoil (inward) and chest wall recoil (outward).

Measuring FRC (RV-containing volumes)

  • Helium dilution: closed-circuit, measures communicating lung spaces
  • Body plethysmography (gold standard): measures total thoracic gas volume including trapped gas

2. MECHANICS OF BREATHING

Pressures in the Respiratory System

PressureNormal ValueSignificance
Intra-alveolar (Palv)0 (atmospheric) at restDrives air in/out when it changes
Intrapleural (Ppl)-5 cmH₂O at restAlways negative (sub-atmospheric); keeps lungs expanded
Transpulmonary (PL)+5 cmH₂O= Palv - Ppl; keeps lungs open against elastic recoil
Inspiration: Diaphragm contracts → thoracic volume ↑ → Ppl becomes more negative → alveolar pressure drops below atmospheric → air flows IN.
Expiration (at rest): Passive - elastic recoil of lung forces air out.

Compliance

Compliance = ΔVolume / ΔPressure
  • High compliance = easy to stretch (emphysema - destruction of elastic tissue)
  • Low compliance = stiff lungs (pulmonary fibrosis, pulmonary edema, infant RDS)
Hysteresis: The inflation and deflation limbs of the pressure-volume loop follow different paths. This occurs because surface tension forces differ during inspiration vs. expiration (related to surfactant action).

Surfactant

  • Produced by Type II alveolar cells (pneumocytes)
  • Composition: mostly dipalmitoylphosphatidylcholine (DPPC)
  • Function: Reduces surface tension of the alveolar air-liquid interface → prevents alveolar collapse (atelectasis)
  • La Place's Law: P = 2T/r (pressure inside a bubble = 2 × tension / radius)
    • Without surfactant, small alveoli (small r) would have higher internal pressure and would empty into larger ones → collapse
    • Surfactant lowers T proportionally more in small alveoli → stabilizes them
⚠️ Exam Tip: Deficiency in premature neonates → Infant Respiratory Distress Syndrome (IRDS/RDS) - lungs are stiff, compliance is low, atelectasis occurs.

3. VENTILATION & DEAD SPACE

Minute Ventilation

V̇E = TV × Respiratory Rate = 500 mL × 12 = 6000 mL/min

Dead Space (ventilated but no gas exchange)

TypeDescriptionNormal
Anatomical dead spaceConducting airways (nose → bronchioles)~150 mL
Alveolar dead spaceAlveoli ventilated but not perfused~0 mL (healthy)
Physiological dead spaceAnatomical + Alveolar~150 mL (healthy)
Bohr Equation (calculates physiological dead space):
VD = VT × (PaCO₂ - PECO₂) / PaCO₂

Alveolar Ventilation

V̇A = (VT - VD) × RR
The Alveolar Ventilation Equation (most important relationship):
PACO₂ = (V̇CO₂ × K) / V̇A
  • If V̇A doubles → PACO₂ halves (inverse hyperbolic relationship)
  • CO₂ crosses the blood-alveoli barrier perfectly → PACO₂ ≈ PaCO₂ = 40 mmHg

4. GAS EXCHANGE & DIFFUSION

Partial Pressures of Gases (at sea level, 760 mmHg)

LocationPO₂PCO₂
Dry inspired air159 mmHg0.3 mmHg
Humidified tracheal air149 mmHg0.3 mmHg
Alveolar air (PAO₂)100 mmHg40 mmHg
Systemic arterial blood95 mmHg40 mmHg
Mixed venous blood40 mmHg45 mmHg
Tissues20-40 mmHg45-50 mmHg
Alveolar Gas Equation:
PAO₂ = PIO₂ - (PACO₂ / RQ) where RQ (respiratory quotient) = 0.8

Factors Affecting Diffusion (Fick's Law)

Rate of diffusion ∝ (Area × ΔP × Solubility) / (Distance × √MW)
  1. Area: ↑ in exercise (more capillaries recruited); ↓ in emphysema, fibrosis
  2. Partial pressure gradient: driving force
  3. Thickness of membrane: ↑ in pulmonary edema, fibrosis → impairs diffusion
  4. Solubility: CO₂ is 20× more soluble than O₂ (CO₂ diffuses much more easily)
  5. Diffusion-limited vs. Perfusion-limited gases:
    • O₂ is normally perfusion-limited (equilibrates before blood leaves capillary)
    • O₂ becomes diffusion-limited in disease or at high altitude
    • CO₂ is always perfusion-limited (highly soluble)
    • CO is always diffusion-limited (binds hemoglobin so fast, gradient is never lost)

A-a Gradient (Alveolar-arterial O₂ difference)

Normal: <15 mmHg (young), increases with age
  • Causes of elevated A-a gradient: V/Q mismatch, diffusion impairment, shunt
  • Normal A-a gradient in hypoxemia → suggests hypoventilation (e.g., opioids, CNS depression)

5. OXYGEN TRANSPORT

Oxygen in Blood - Two Forms

FormAmountDetails
Dissolved in plasma0.3 mL O₂/100 mL blood (3%)Very small amount
Bound to hemoglobin~20 mL O₂/100 mL blood (97%)Main transport form

Hemoglobin (Hb)

  • Each Hb molecule has 4 heme groups, each binds 1 O₂
  • 15 g Hb/100 mL blood × 1.34 mL O₂/g Hb = 20.1 mL O₂/100 mL (20 vol%)
  • O₂ saturation (SpO₂): % of Hb binding sites carrying O₂

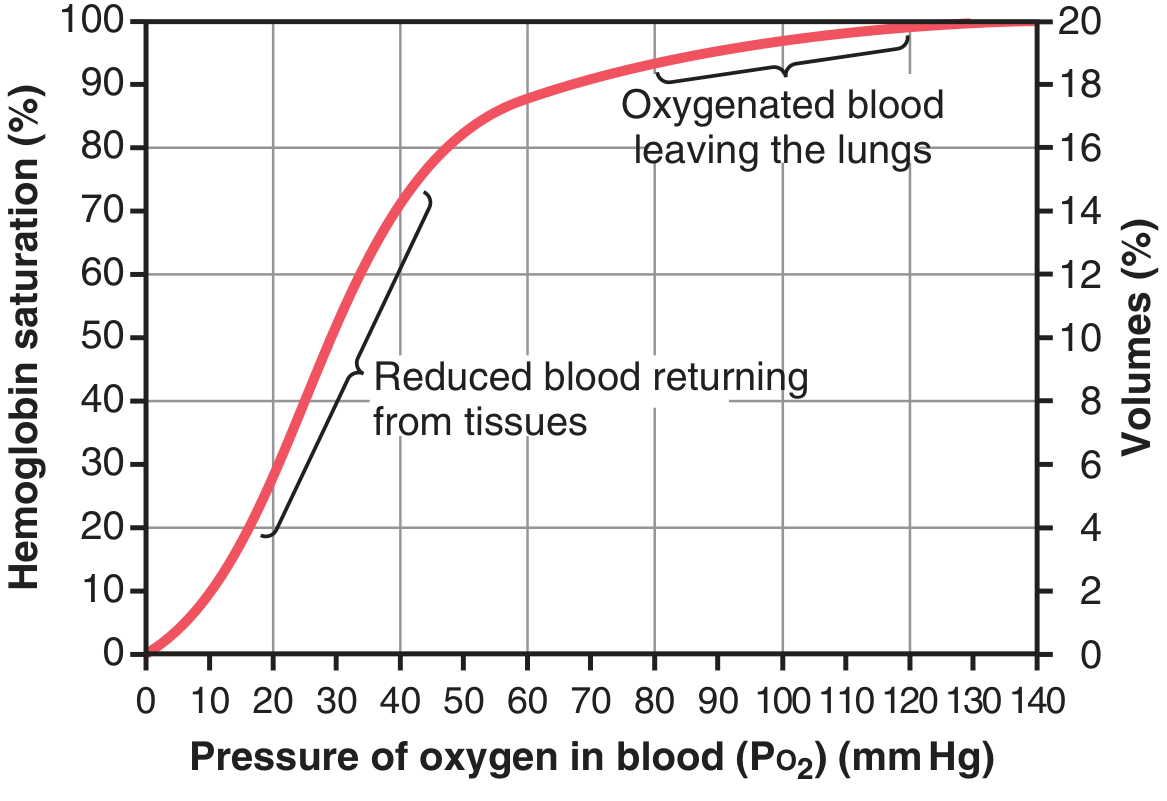
Oxygen-Hemoglobin Dissociation Curve

The classic sigmoid (S-shaped) curve:
Oxygen-Hemoglobin Dissociation Curve
PointPO₂SpO₂Clinical meaning
Arterial blood (lungs)95 mmHg97%Near-fully saturated
Venous blood (tissues)40 mmHg75%~25% O₂ unloaded
P50 (normal)26.5 mmHg50%PO₂ at half-saturation

Right Shift of Dissociation Curve (↓ affinity, ↑ O₂ delivery to tissues)

Mnemonic: CADET - Right shift = unloading
  • ↑ CO₂ (Bohr effect)
  • ↑ Acid (↓ pH)
  • ↑ 2,3-DPG (exercise, chronic hypoxia, anemia)
  • ↑ Exercise/Temperature

Left Shift (↑ affinity, less O₂ released)

  • ↓ CO₂, ↑ pH, ↓ temperature, ↓ 2,3-DPG
  • Fetal hemoglobin (HbF): higher O₂ affinity than HbA (extracts O₂ from maternal blood)
  • CO poisoning: COHb left-shifts + blocks binding sites
⚠️ Bohr Effect: ↑ PCO₂ / ↓ pH → RIGHT shift → more O₂ released at tissues

6. CO₂ TRANSPORT

CO₂ is transported in three forms:
FormPercentageMechanism
As bicarbonate (HCO₃⁻)70%CO₂ + H₂O ↔ H₂CO₃ ↔ H⁺ + HCO₃⁻ (carbonic anhydrase in RBCs)
As carbaminohemoglobin20-23%CO₂ binds amine groups of Hb directly
Dissolved in plasma7-10%Small but physiologically important
Chloride Shift (Hamburger Shift): HCO₃⁻ formed in RBCs exits into plasma in exchange for Cl⁻ entering the RBC via Band-3 protein (anion exchanger).
Haldane Effect: Oxygenation of Hb decreases its affinity for CO₂ (and vice versa). In the tissues, deoxygenated Hb picks up more CO₂ (facilitating CO₂ transport). In the lungs, oxygenation of Hb releases CO₂ for excretion.

7. VENTILATION-PERFUSION (V/Q) RELATIONSHIPS

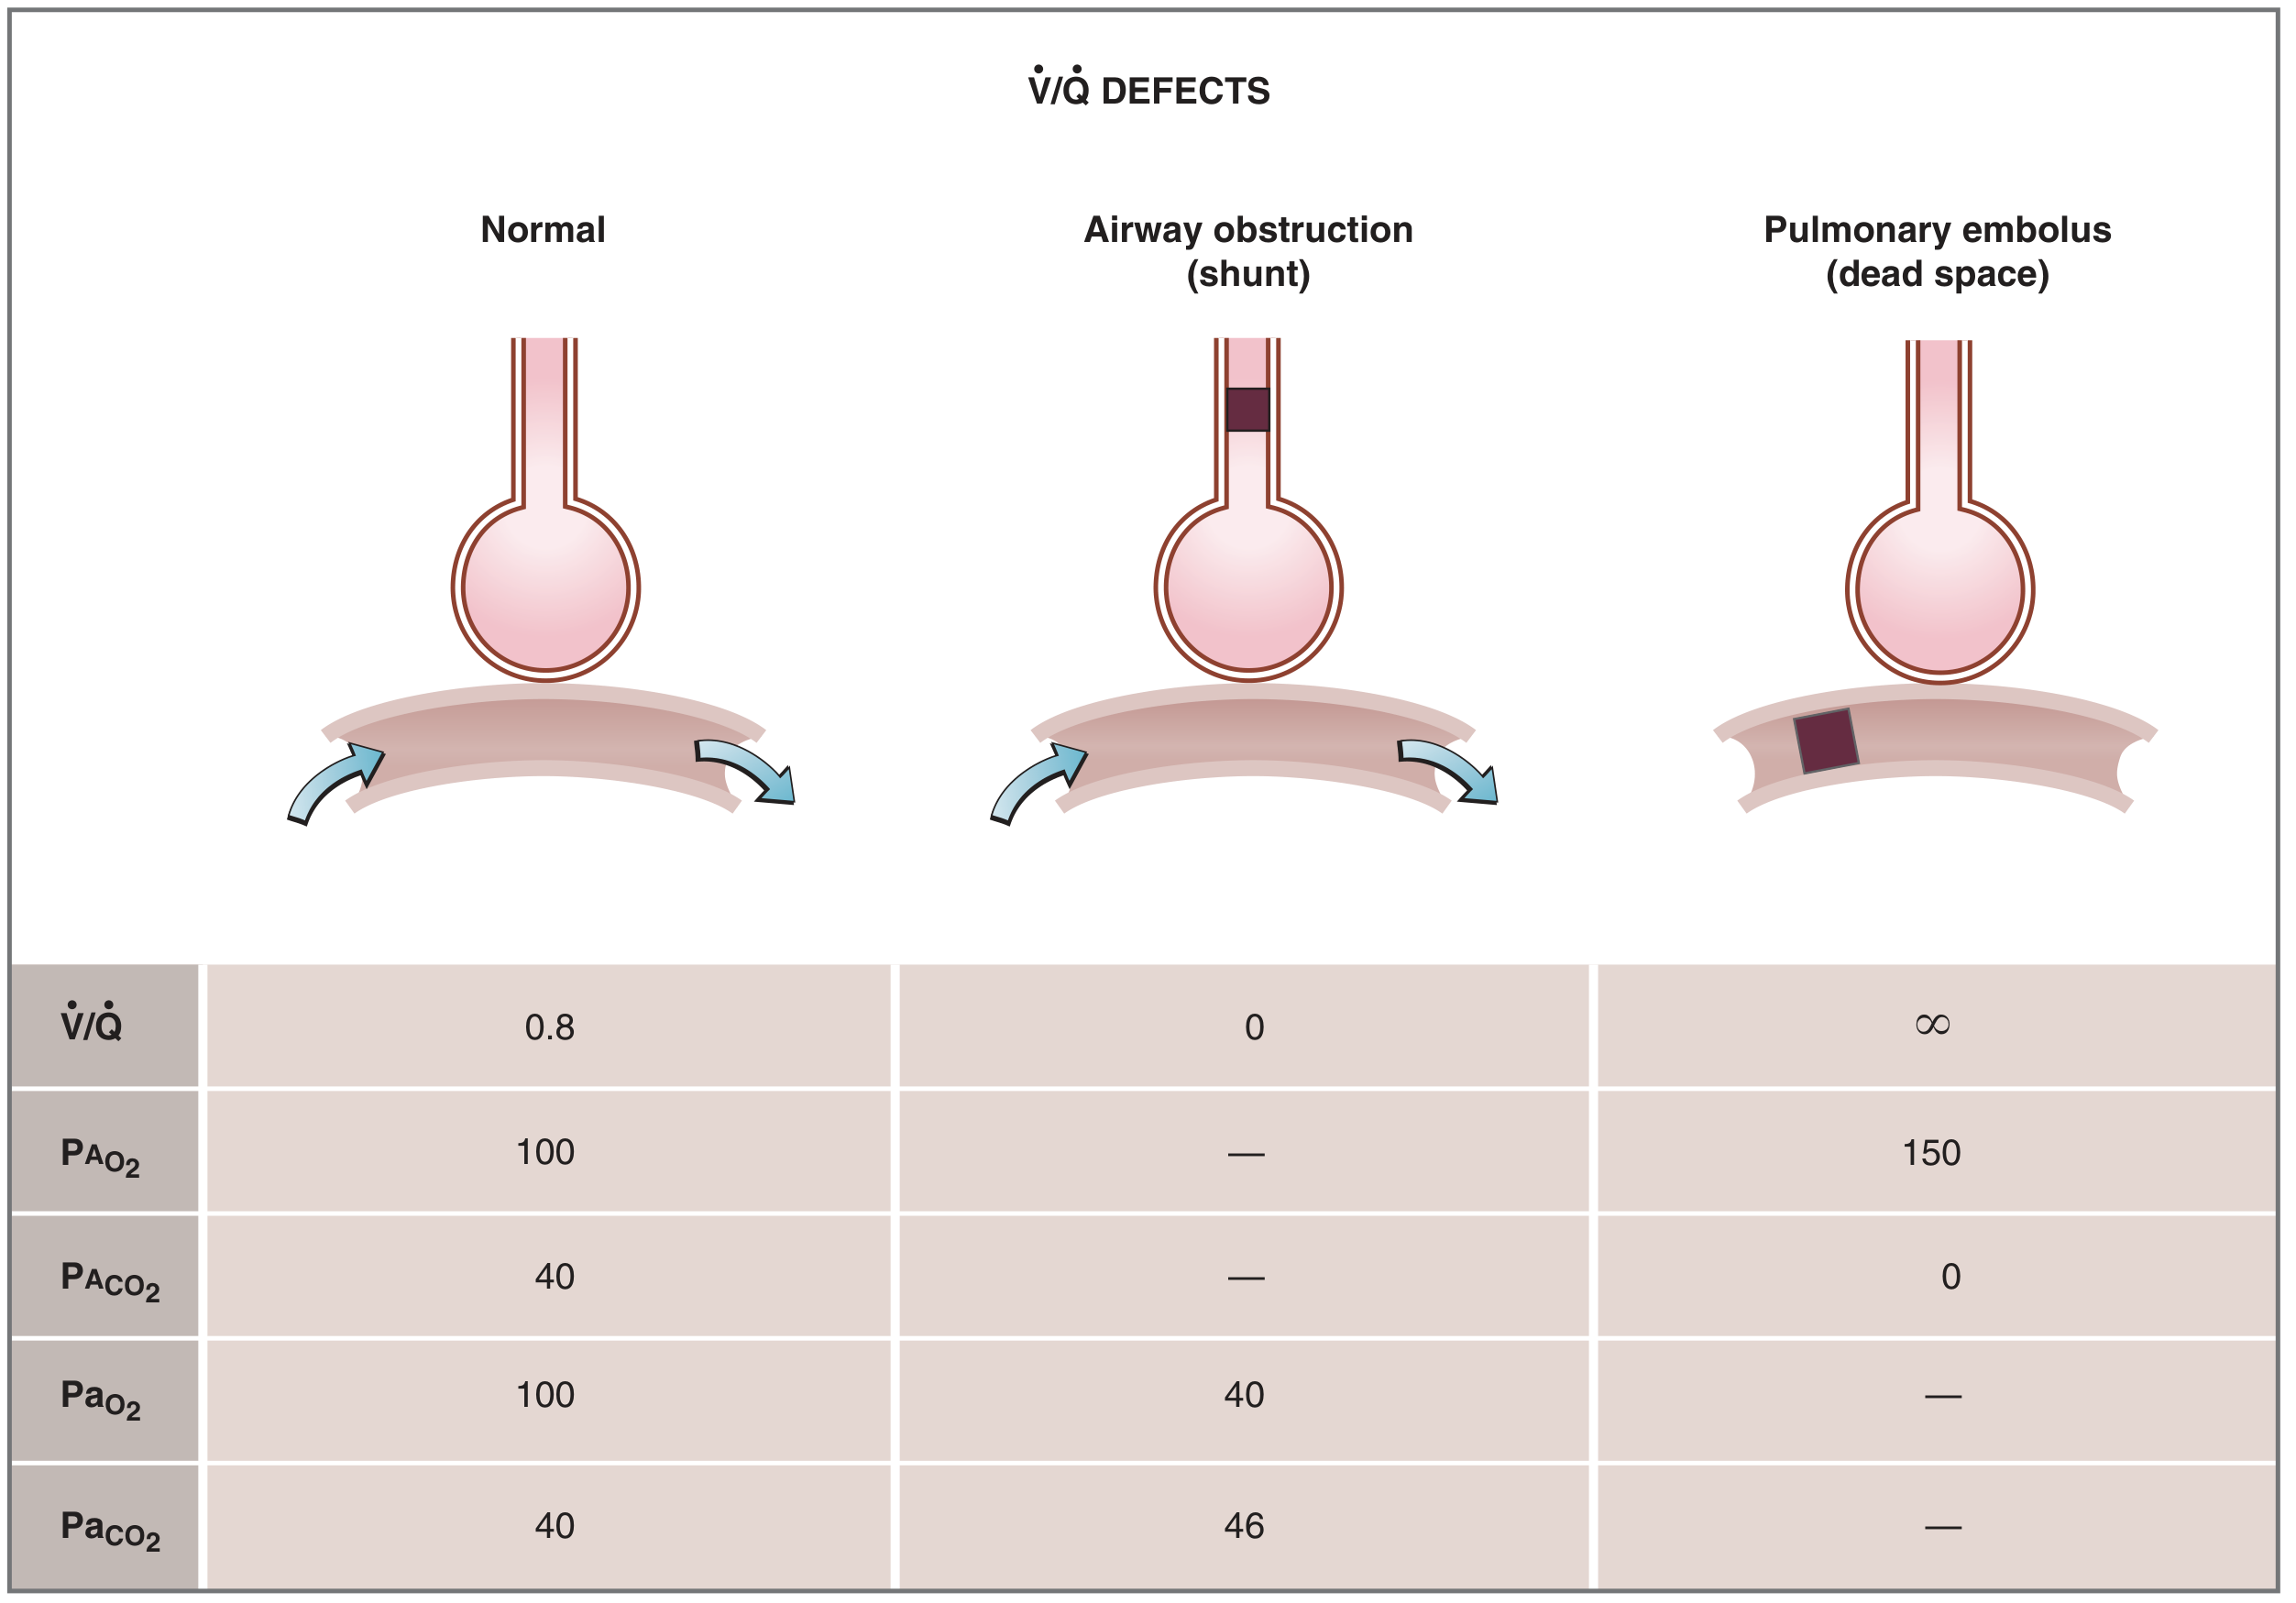
Normal V/Q ratio = 0.8 (V̇A = 4 L/min; Q̇ = 5 L/min)
V/Q Defects - Normal, Shunt, Dead Space

Regional V/Q Differences (upright person)

ZoneLocationBlood flowVentilationV/Q ratio
Apex (top)Zone 1Least (gravity)Highest relative>0.8 (dead space-like)
Base (bottom)Zone 3GreatestLess relative<0.8 (shunt-like)
Hypoxic Pulmonary Vasoconstriction (HPV): Low alveolar O₂ → vasoconstriction of local pulmonary arterioles → diverts blood away from poorly ventilated areas → optimizes V/Q matching. (Opposite to systemic circulation!)

Clinical Extremes of V/Q

ScenarioV/QAlveolar airArterial bloodExample
Perfect match0.8PO₂=100, PCO₂=40NormalNormal
Shunt (airway obstruction)0 (no ventilation)Like mixed venous bloodPaO₂=40, PaCO₂=46Atelectasis, pneumonia
Dead space (PE) (no perfusion)Like inspired airNo exchangePulmonary embolism
⚠️ Key clinical point: V/Q mismatch is the most common cause of hypoxemia in clinical practice. Shunt does NOT correct with 100% O₂; dead space does.

8. CONTROL OF BREATHING

Brain Stem Centers

CenterLocationFunction
Dorsal Respiratory Group (DRG)Medulla (inspiratory center)Controls basic rhythm of breathing; sends output via phrenic nerve to diaphragm
Ventral Respiratory Group (VRG)Medulla (expiratory center)Active during forced/exercise breathing
Pneumotaxic CenterPons (upper)Limits inspiration (switches off inspiration) → controls inspiratory duration
Apneustic CenterPons (lower)Prolongs inspiration; inhibited by pneumotaxic center

Chemoreceptors

Central Chemoreceptors

  • Location: medulla oblongata (ventral surface)
  • Stimulus: CO₂ / H⁺ (indirectly via CO₂ crossing the blood-brain barrier → forms H⁺ in CSF)
  • NOT directly sensitive to O₂
  • Most powerful driver of ventilation under normal conditions
  • CO₂ rises → ↑ H⁺ in CSF → ↑ ventilation

Peripheral Chemoreceptors

  • Carotid bodies (at carotid bifurcation, CN IX) - primary for humans
  • Aortic bodies (aortic arch, CN X) - less important
  • Stimulated by: ↓ PaO₂ (< 60 mmHg), ↑ PaCO₂, ↓ pH
  • Hypoxemia is sensed HERE (not in the medulla)
⚠️ Exam Tip: The peripheral chemoreceptors only significantly respond to PO₂ below 60 mmHg (steep part of the O₂-Hb curve). Above this, they contribute little to ventilatory drive.

Lung Receptors

ReceptorLocationStimulusResponse
Stretch receptors (slowly adapting)Airway smooth muscleLung inflationInhibit inspiration (Hering-Breuer reflex)
Irritant receptors (rapidly adapting)Airway epitheliumSmoke, dust, cold airCough, bronchoconstriction, hyperpnea
J receptors (juxtacapillary)Alveolar wallsPulmonary edema, PERapid, shallow breathing, dyspnea
Hering-Breuer Reflex: Inflation of lungs → stretch receptors activated → inhibit further inspiration (prevents over-inflation). Important in neonates; less important in adults at normal tidal volumes.

9. ACID-BASE AND RESPIRATION

ConditionpHPaCO₂HCO₃⁻Cause
Respiratory acidosis↑ (compensatory)Hypoventilation
Respiratory alkalosis↓ (compensatory)Hyperventilation
Metabolic acidosis↓ (compensatory)Diarrhea, DKA, renal failure
Metabolic alkalosis↑ (compensatory)Vomiting, diuretics
Henderson-Hasselbalch Equation:
pH = 6.1 + log ([HCO₃⁻] / 0.03 × PCO₂)
Normal ABG: pH = 7.4, PaCO₂ = 40 mmHg, PaO₂ = 95 mmHg, HCO₃⁻ = 24 mEq/L

10. PULMONARY CIRCULATION

  • Low pressure circuit: Normal pulmonary artery pressure = 25/10 mmHg (mean ~15 mmHg)
  • Much lower resistance than systemic circulation
  • Blood flow distribution: At the base of upright lungs (gravity) > apex
  • Hypoxic vasoconstriction (unique to pulmonary): ↓ O₂ → vasoconstriction (opposite of systemic)
  • Bronchial circulation: Supplies conducting airways; a small fraction of total pulmonary blood flow

Zones of the Lung (West Zones)

ZonePressure relationshipBlood flow
Zone 1 (apex)PA > Pa > PvNone to minimal
Zone 2 (middle)Pa > PA > PvIntermittent
Zone 3 (base)Pa > Pv > PAContinuous, largest
PA = alveolar pressure; Pa = pulmonary arterial pressure; Pv = pulmonary venous pressure

11. SPECIAL TOPICS

Exercise Physiology

  • Ventilation ↑ dramatically (can reach 100-150 L/min in athletes)
  • V̇O₂ and V̇CO₂ both ↑
  • Cardiac output ↑ → pulmonary blood flow ↑ → more capillary beds perfused → V/Q matching improves → physiological dead space ↓
  • O₂-Hb curve shifts RIGHT (↑ CO₂, ↓ pH, ↑ temperature, ↑ 2,3-DPG)
  • Ventilatory threshold (anaerobic threshold): point at which VCO₂ increases disproportionately to VO₂ (lactic acid buffering adds extra CO₂)

High Altitude

At high altitude (↓ barometric pressure → ↓ PiO₂ → ↓ PAO₂ → hypoxemia):
Adaptive responses:
  1. Hyperventilation (↑ VA → ↓ PACO₂ → ↑ PAO₂)
  2. Polycythemia (↑ EPO from kidneys → ↑ RBCs → ↑ O₂ carrying capacity)
  3. Right shift of O₂-Hb curve (↑ 2,3-DPG in RBCs - hours to days)
  4. Increased cardiac output (early)
  5. Pulmonary hypertension (hypoxic vasoconstriction of pulmonary vessels)
  6. Renal HCO₃⁻ excretion (compensates for respiratory alkalosis from hyperventilation - takes days)
⚠️ PO₂ at 18,000 ft = (380 - 47) × 0.21 = 70 mmHg (vs. 150 mmHg at sea level)

Chronic Hypoxia (COPD "Blue Bloaters")

Long-standing hypercapnia (↑ CO₂) → central chemoreceptors desensitize → ventilatory drive shifts to hypoxic drive (peripheral chemoreceptors). This is why supplemental O₂ in severe COPD can paradoxically reduce ventilatory drive.

12. KEY SPIROMETRY VALUES (FEV₁/FVC)

PatternFEV₁FVCFEV₁/FVCExamples
NormalNormalNormal>0.75-0.80Healthy
Obstructive↓↓Normal or ↓<0.70Asthma, COPD
Restrictive↓↓Normal or ↑Fibrosis, obesity, scoliosis
  • DLCO (diffusing capacity for CO): ↓ in emphysema & fibrosis; normal in asthma; ↑ in polycythemia, left-to-right shunt
  • Flow-volume loop: Essential for identifying obstruction (concave expiratory limb = obstructive; reduced loop size = restrictive)

🔑 HIGH-YIELD SUMMARY TABLE

TopicKey Number/Fact
Normal PaO₂95 mmHg
Normal PaCO₂40 mmHg
Normal pH7.4
Normal SpO₂97-99%
P50 of Hb26.5 mmHg
FRC = ERV + RV2400 mL
Tidal Volume500 mL
Anatomical dead space150 mL (1 mL/pound ideal body weight)
Normal V/Q ratio0.8
Normal FEV₁/FVC>0.75
O₂ carried by Hb97%
CO₂ as bicarbonate70%
Hypoxic vasoconstriction PO₂ threshold<60 mmHg (peripheral chemoreceptors)
Bohr effect↑CO₂/↓pH → RIGHT shift → more O₂ unloaded
Haldane effectO₂ binding → CO₂ released from Hb
Surfactant made byType II pneumocytes

🧠 MNEMONICS

  • "CADET Face Right" = Right shift of Hb curve: CO₂↑, Acid↑, DPG↑, Exercise, Temperature↑
  • "The LUNGS CAN'T measure RV" = RV, FRC, TLC cannot be measured by spirometry alone
  • Obstructive = Obstruct flow = FEV₁/FVC ↓ | Restrictive = Restrict volume = FVC ↓
  • "Peripheral chemorec = PO₂; Central chemorec = PCO₂ via H⁺"
  • "Shunt → No correction with O₂; Dead space → Corrects with O₂"

All values from: Costanzo Physiology 7th Ed. | Guyton & Hall Medical Physiology 14th Ed. | Ganong's Review of Medical Physiology 26th Ed.
This is a shared conversation. Sign in to Orris to start your own chat.