
Tell me the causes, symptoms and preventions of the Hepatitis A
Hepatitis A causes symptoms prevention 2024
Hepatitis A virus transmission diagram
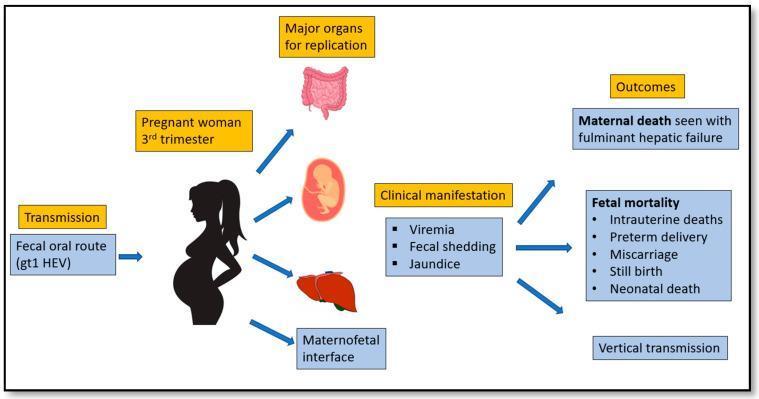
A medical infographic illustrating the transmission, pathogenesis, and clinical outcomes of Hepatitis E virus (HEV), specifically genotype 1 (gt1 HEV), in pregnant women during the third trimester. The diagram shows the transmission occurring via the fecal-oral route. Major organs for viral replication are identified as the intestines, liver, the fetus, and the maternofetal interface. Clinical manifestations listed include viremia, fecal shedding, and jaundice. The right side of the infographic delineates serious maternal and fetal outcomes: maternal death associated with fulminant hepatic failure, and high fetal mortality rates linked to intrauterine deaths, preterm delivery, miscarriage, stillbirth, and neonatal death. The diagram also highlights the risk of vertical transmission from mother to fetus. This educational visual is designed for medical curriculum use, focusing on infectious disease pathology and obstetric complications related to viral hepatitis.
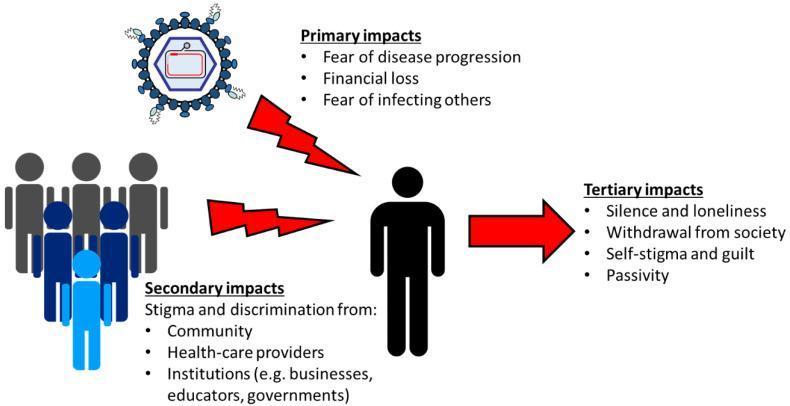
A pathophysiology and psychosocial diagram illustrating the impact of chronic Hepatitis B virus (HBV) infection on an individual. The central element is a black silhouette of a person, representing an individual living with chronic hepatitis B (CHB). To the top-left, a diagram of the HBV virus particles indicates the clinical origin of the condition. Red jagged arrows point from the virus and a group of blue-toned human figures toward the central individual, symbolizing external stressors. The diagram categorizes the consequences into three tiers: 'Primary impacts' (fear of progression, financial loss, fear of transmission); 'Secondary impacts' originating from the community and healthcare providers (stigma and discrimination); and 'Tertiary impacts' shown on the right (silence, loneliness, withdrawal from society, self-stigma, and passivity). The visual logic demonstrates how biological disease leads to societal reaction, which ultimately results in negative psychological internalizations for the patient. This educational infographic is designed for clinicians and public health educators to understand the multifaceted lived experience of CHB beyond clinical markers.
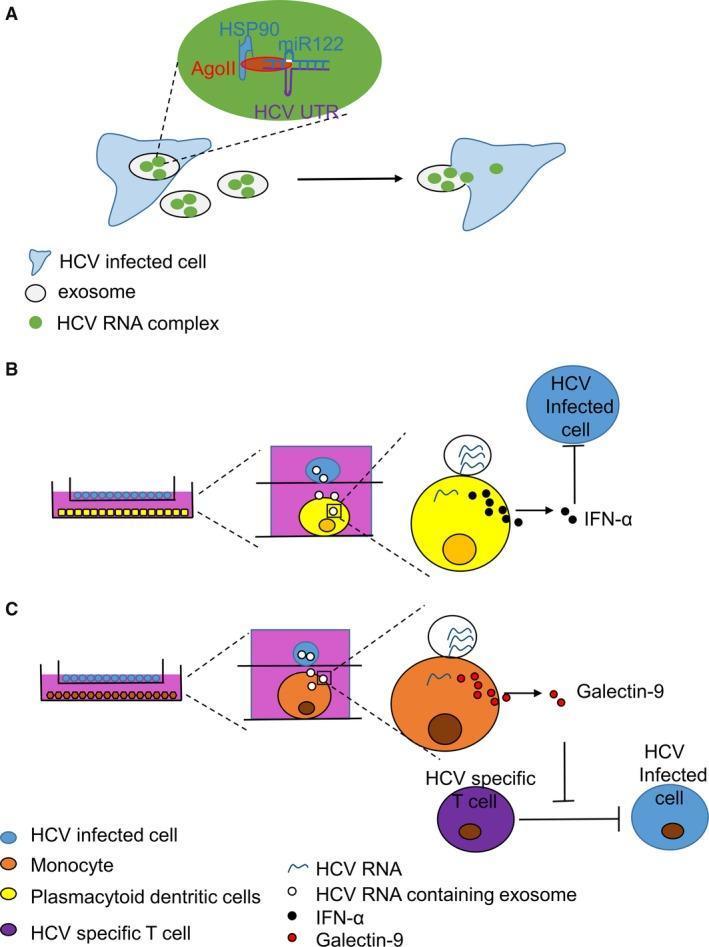
A three-part pathophysiology diagram (A, B, C) illustrating the roles of exosomes in Hepatitis C Virus (HCV) infection, immune activation, and immune escape. Panel A depicts an anatomical diagram of exosome-mediated transmission, showing an HCV-infected cell releasing exosomes containing an 'HCV RNA complex.' A magnified view of the complex identifies its components: HSP90, AgoII, miR122, and HCV UTR. Panel B illustrates the innate immune response where HCV RNA-containing exosomes are transferred to a Plasmacytoid Dendritic Cell (pDC), triggering the secretion of IFN-α, which subsequently inhibits the infected cell. Panel C demonstrates immune escape mechanisms; exosomes from an infected cell stimulate a monocyte to release Galectin-9. This protein inhibits HCV-specific T cells, which would otherwise suppress the infected cell. The diagrams use color-coded cell types (HCV-infected cells in blue, pDCs in yellow, monocytes in orange, and T cells in purple) and molecular labels to show how viral cargo impacts intercellular communication and host immunity within the liver microenvironment.
Hepatitis A: Causes, Symptoms & Prevention
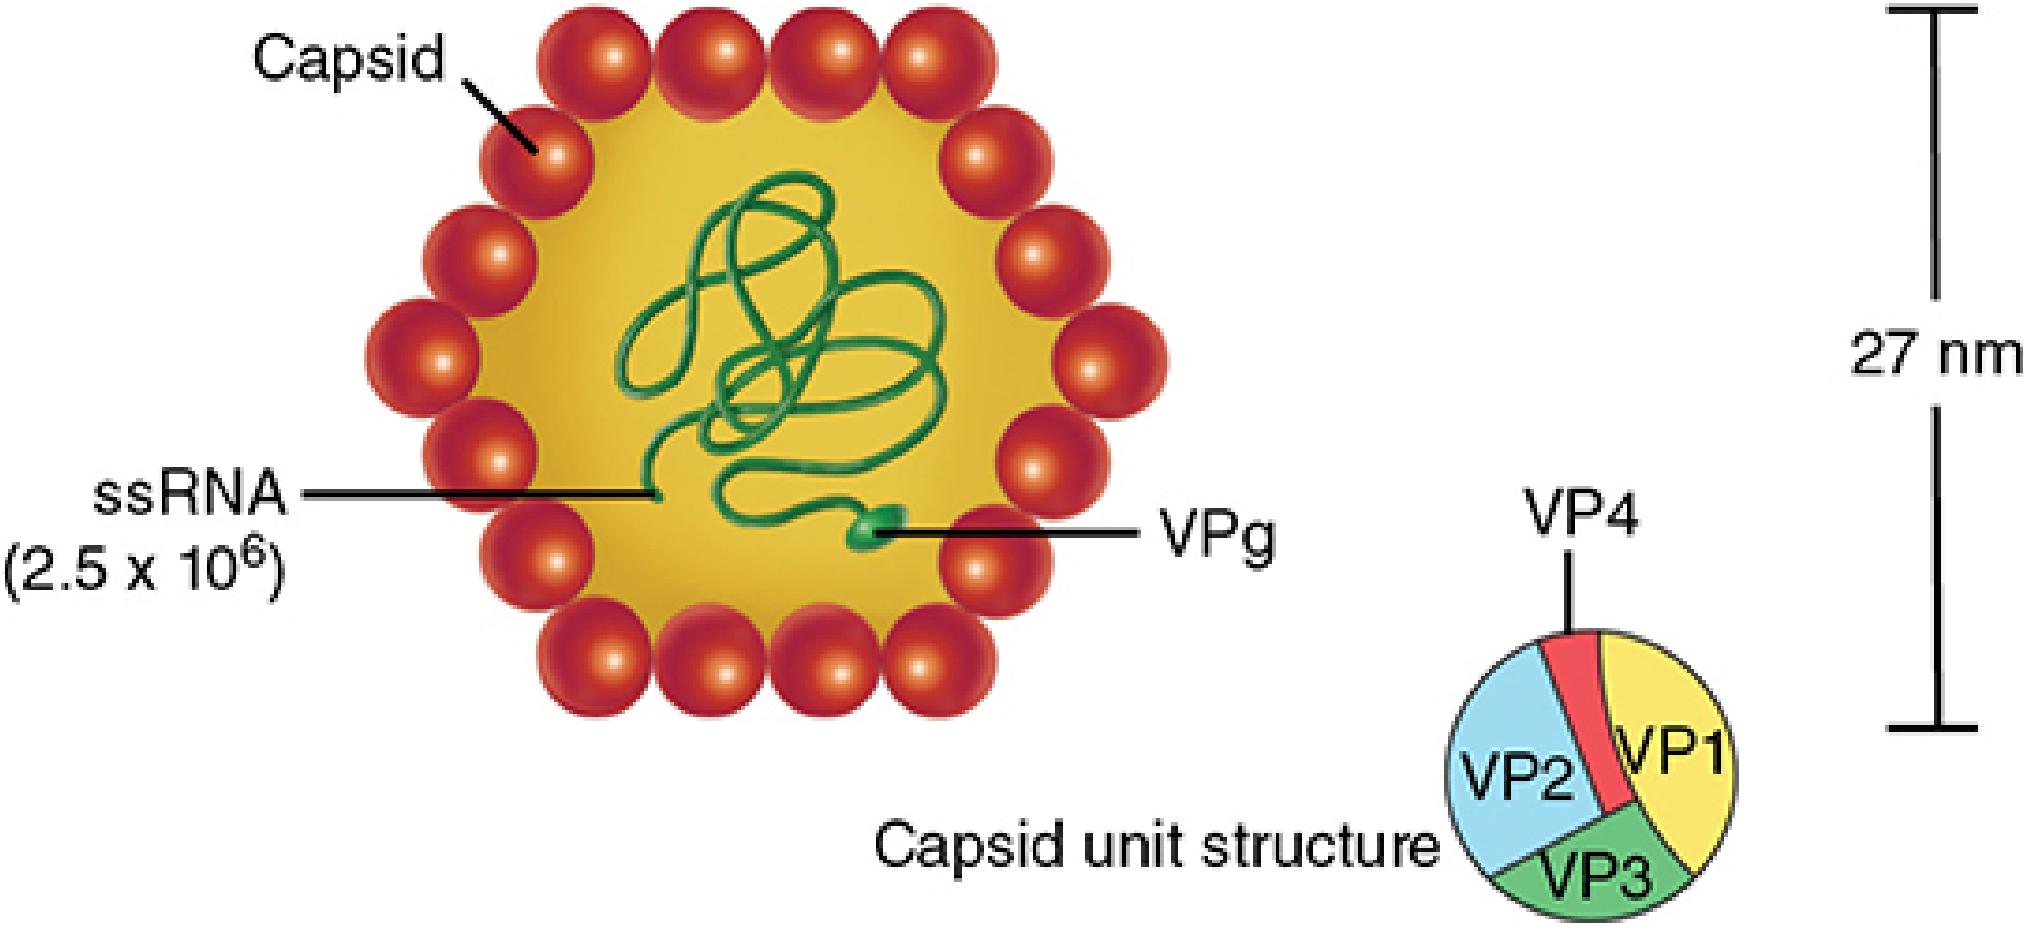
What Is Hepatitis A?
Causes
The Virus
Transmission Routes
- Contaminated food or water - the most common source. Raw shellfish (oysters, clams), raw produce, and uncooked foods handled by infected individuals are frequent culprits.
- Direct person-to-person contact - through close physical contact with an infected person, especially with poor hand hygiene.
- Oral-anal sexual contact - a recognized transmission route.
- Blood transfusion - reported rarely; HAV can be transiently present in blood during viremia.
- Perinatal transmission - isolated cases described.
High-Risk Groups
- Travelers to developing/endemic countries
- Children in day-care centers (and their parents/caregivers)
- Men who have sex with men (MSM)
- Injection drug users
- Homeless persons
- Patients receiving plasma products (e.g., for hemophilia)
- Persons in institutional settings (prisons, group homes)
- Household or sexual contacts of infected individuals
Why It Thrives
Symptoms
Who Gets Symptoms?
- Children under 6: up to 70% are asymptomatic; jaundice is uncommon
- Older children and adults: most develop symptoms, and jaundice is typical
- Severity increases with age at infection
Prodromal Phase (before jaundice)
- Fever
- Fatigue and general malaise
- Loss of appetite (anorexia)
- Nausea and vomiting
- Right upper quadrant abdominal pain or discomfort
- Diarrhea
- Dark (cola-colored) urine - an early sign
- Clay-colored (pale) stools - indicating bile flow obstruction
Icteric (Jaundice) Phase
- Jaundice - yellowing of the skin and whites of the eyes (scleral icterus)
- Elevated liver enzymes (ALT, AST) and bilirubin in blood tests
- Joint pain (arthralgia)
Course of Illness
- Up to 13% of adults require hospitalization
- About 10% of adults have a prolonged course lasting 6-9 months
- Hepatitis A is the most common cause of relapsing cholestatic hepatitis
- Fulminant hepatic failure (with extensive liver necrosis) can rarely occur - especially in older adults or those with pre-existing chronic liver disease - and can be fatal
Warning Signs of Severe Disease (WHO)
- Severe or persistent vomiting
- Persistent sense of not feeling well
- Photophobia (light sensitivity)
- Irritability or confusion/disorientation
- Unusual sleepiness
Prevention
1. Vaccination (Most Effective)
- Standard schedule: 2 doses given 6-18 months apart
- Accelerated schedule: Days 0, 7, and 21 (for urgent travelers to endemic areas)
- Virtually all healthy vaccinated people develop protective anti-HAV antibodies
- A combined HAV + HBV vaccine is also available
- Safe to administer alongside other vaccines or immunoglobulins
- People already immune (detectable anti-HAV IgG) do not need vaccination
- Travelers to endemic countries
- Healthcare workers
- Men who have sex with men
- Close contacts of hepatitis A patients
- People with chronic liver disease
- Persons who use injection drugs
- Children (routine childhood immunization in many countries)
2. Post-Exposure Prophylaxis
3. Hand Hygiene
- After using the toilet or changing diapers
- Before preparing or eating food
- After contact with an infected person
4. Safe Food and Water Practices
- Drink safe (bottled or boiled) water when in endemic regions
- Avoid raw shellfish and raw produce in areas with poor sanitation
- Cook food to appropriate temperatures
5. Safe Sex Practices
6. Sanitation and Infrastructure
Key Facts at a Glance
| Feature | Detail |
|---|---|
| Causative agent | Hepatitis A virus (HAV), Picornaviridae |
| Transmission | Fecal-oral (contaminated food/water, person-to-person) |
| Incubation period | 15-45 days |
| Chronic disease? | No - always acute and self-limiting |
| Immunity after infection | Lifelong |
| Specific treatment | None (supportive care only) |
| Best prevention | HAV vaccination (2-dose series) |