
Ecg
Asking for Preferences
What would you like to know about ECG?
A standard ECG has 12 leads, records electrical activity of the heart, and is interpreted in a systematic order: rate, rhythm, axis, P waves, PR interval, QRS complex, ST segment, and T waves. Each component reflects a specific phase of cardiac depolarization/repolarization.
Searching sources...
Reading File
Finding Sources
Searching the Web
ECG basic interpretation systematic approach 12 lead
Reading File
Loading Image
Reading File
Reading File
Finding Sources
Finding Sources
Finding Sources
Finding Sources
Finding Sources
Finding Sources
Now I have comprehensive information from multiple authoritative textbooks. Here is a thorough guide to basic ECG interpretation:
ECG (Electrocardiogram) - Basic Interpretation
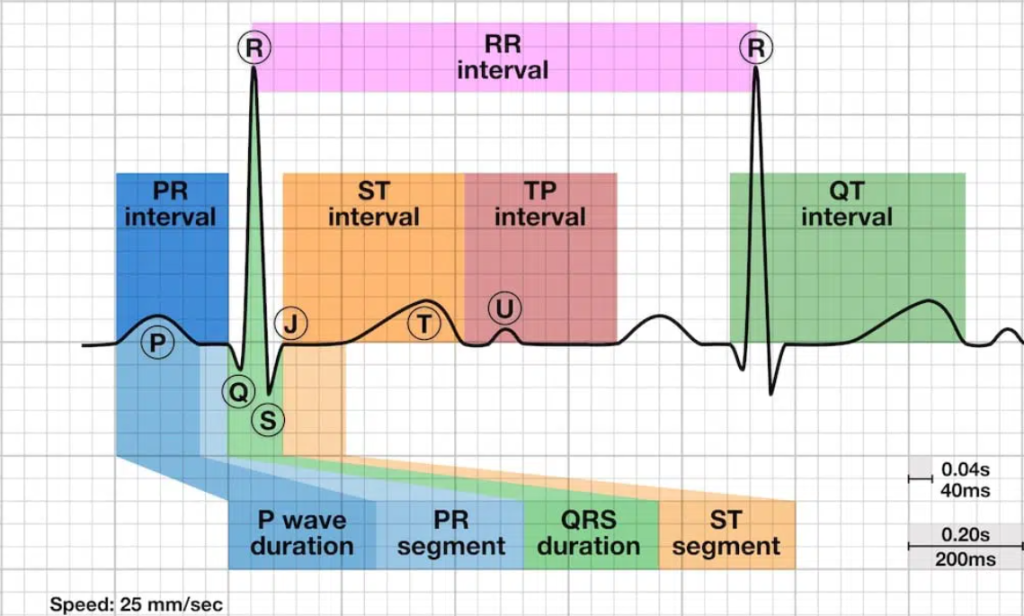
What is an ECG?
An ECG records the heart's electrical activity from 12 vantage points (leads) derived from 10 electrodes - 6 on the chest wall and 4 on the limbs. Each lead looks at the same electrical impulse from a different angle. A positive deflection is recorded when the electrical wave front moves toward the exploring electrode.
The standard 12-lead ECG comprises:
- 6 limb leads: I, II, III (Einthoven's bipolar) + aVR, aVL, aVF (Goldberger's augmented unipolar) - called frontal plane leads
- 6 precordial (chest) leads: V1, V2, V3, V4, V5, V6 - called precordial leads
The ECG Waves and What They Mean
| Wave / Segment | Electrical Event |
|---|---|
| P wave | Atrial depolarization (atria contracting) |
| PR interval | Conduction from atria to ventricles (through AV node) |
| QRS complex | Ventricular depolarization (ventricles contracting) |
| ST segment | Early ventricular repolarization |
| T wave | Ventricular repolarization (ventricles recovering) |
| U wave | Possibly Purkinje fiber repolarization (not always seen) |
| J point | End of QRS, beginning of ST segment |
Note: Atrial repolarization is buried under the QRS complex and is not visible on a normal ECG.
Normal Intervals (from Harrison's / Goldman's textbooks)
| Parameter | Normal Range |
|---|---|
| Heart Rate | 50-100 beats per minute |
| P wave duration | < 0.12 sec (120 ms) |
| PR interval | 0.09-0.20 sec (3-5 small boxes) |
| QRS duration | 0.075-0.11 sec (< 3 small boxes) |
| QTc | Males: 390-450 ms / Females: 390-460 ms |
| QRS axis | -30° to +90° |
The ECG paper: Standard speed is 25 mm/sec. Each small box = 0.04 sec (40 ms). Each large box = 0.20 sec (200 ms).
Systematic Approach to Reading an ECG
Harrison's Principles recommends analyzing 14 parameters in every ECG:
1. Calibration and Technical Features
Check lead placement, paper speed (25 mm/sec standard), and rule out artifacts. Standard calibration = 10 mm = 1 mV.
2. Heart Rate
- Method 1 (Regular rhythm): Count large boxes between two R waves → divide 300 by that number (e.g., 4 boxes = 75 bpm)
- Method 2 (Any rhythm): Count QRS complexes in a 10-second strip × 6
- Formula: HR = 60,000 / RR interval (in ms)
3. Rhythm
- Is there a P wave before every QRS?
- Is every P wave followed by a QRS?
- Are the intervals regular?
- Normal sinus rhythm: regular P waves at 60-100 bpm, P before every QRS, PR 0.12-0.20 sec
4. P Wave Morphology
- Should be upright in leads I, II, aVF; inverted in aVR
- Duration < 120 ms, height < 2.5 mm
- Biphasic P in V1 is normal; wide notched P suggests left atrial enlargement; peaked P (>2.5 mm) in II suggests right atrial enlargement
5. PR Interval
- 0.12-0.20 sec (3-5 small boxes)
- Short PR (< 0.12): Pre-excitation (WPW), junctional rhythm
- Long PR (> 0.20): First-degree AV block
6. QRS Complex
- Duration < 0.12 sec (3 small boxes)
- Wide QRS (> 0.12): Bundle branch block, ventricular rhythm, or aberrant conduction
- Q waves: normal if < 0.04 sec wide and < 25% of R wave height; pathological Q waves suggest old MI
7. QRS Axis
Determined by looking at leads I (0°) and aVF (90°):
| Lead I | aVF | Axis |
|---|---|---|
| Positive | Positive | Normal (-30° to +90°) |
| Positive | Negative | Left axis deviation (LAD) |
| Negative | Positive | Right axis deviation (RAD) |
| Negative | Negative | Extreme axis deviation |
- LAD causes: LVH, left anterior fascicular block, inferior MI
- RAD causes: RVH, pulmonary hypertension, PE, left posterior fascicular block
8. Precordial R-Wave Progression
- R wave should grow progressively from V1 to V5-V6
- Transition (R = S) normally occurs at V3-V4
- Poor R-wave progression: anterior MI, LBBB, LVH
9. QRS Voltages
- LVH: S in V1 + R in V5 or V6 > 35 mm (Sokolow-Lyon criteria)
- RVH: R > S in V1, right axis deviation
10. ST Segment
- Should be isoelectric (flat, at baseline)
- ST elevation: transmural ischemia/injury, pericarditis, Brugada
- ST depression: subendocardial ischemia, digoxin effect
11. T Waves
- Should be upright in I, II, V3-V6; inverted in aVR; variable in V1-V2
- T-wave inversion: ischemia, ventricular hypertrophy, PE (V1-V4), RBBB
- Tall peaked T waves: hyperkalemia, early MI
12. QT / QTc Interval
- Rate-corrected QTc: use Bazett's formula - QTc = QT / √RR
- Prolonged QTc: risk of Torsades de Pointes (drugs, electrolyte disturbances, congenital syndromes)
13. Abnormal Q Waves
- Pathological Q: > 1 small box wide (40 ms), depth > 25% of R wave
- Indicate prior myocardial infarction in the corresponding territory
14. U Waves
- Small deflection after T wave, best seen in V2-V3
- Prominent U waves: hypokalemia, bradycardia, LVH
Lead Territories (for localizing pathology)
| Leads | Territory | Artery |
|---|---|---|
| II, III, aVF | Inferior wall | RCA |
| I, aVL, V5-V6 | Lateral wall | LCx |
| V1-V4 | Anterior wall | LAD |
| V1-V2 (reciprocal) | Posterior wall | RCA or LCx |
Key Takeaway
As Harrison's states: "Many mistakes in ECG interpretation are errors of omission. Therefore, a systematic approach is essential." Always compare to previous ECGs whenever available, and always interpret findings in the context of the patient's clinical status.
Sources: Harrison's Principles of Internal Medicine 22E; Goldman's Cecil Medicine; Guyton & Hall Medical Physiology; Tintinalli's Emergency Medicine
This is a shared conversation. Sign in to Orris to start your own chat.