
Diabetes mellitus diagnosticcriteria , classification , patjogenesis , micro vs marcovascular , dm1vs dm2 , complications refer robbins add flowcharts and tabulations along with textual answer
/textbooks/9780443264528/9780443264528_block11.md. Now I'll read the Robbins DM section and simultaneously search for complications and images.diabetes mellitus pathogenesis type 1 type 2 islet pathology
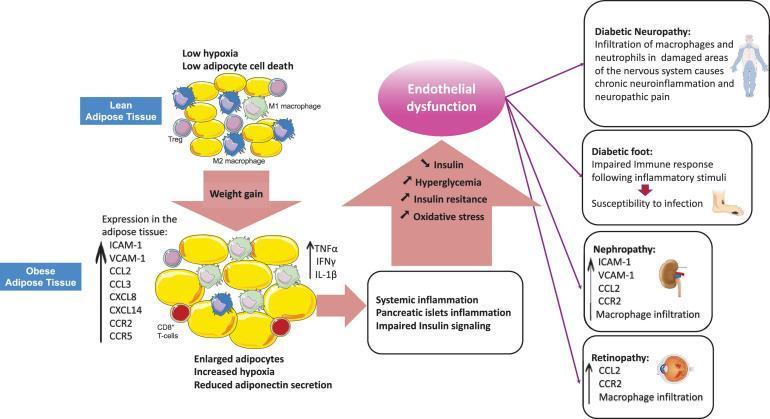
A pathophysiology diagram illustrating the progression from obesity-induced adipose tissue inflammation to Type 2 Diabetes Mellitus (T2DM) and its vascular complications. The visual compares 'Lean Adipose Tissue'—characterized by small adipocytes, low hypoxia, and anti-inflammatory M2 macrophages and Regulatory T-cells (Tregs)—with 'Obese Adipose Tissue' following weight gain. The obese state shows hypertrophied (enlarged) adipocytes, increased hypoxia, and a shift toward a pro-inflammatory environment featuring M1 macrophages, CD8+ T-cells, and elevated expression of cytokines (TNFα, IFNγ, IL-1β), chemokines (CCL2, CXCL8), and adhesion molecules (ICAM-1, VCAM-1). A central pathway illustrates how this local inflammation leads to systemic inflammation, pancreatic islet dysfunction, and impaired insulin signaling. This results in a cascade of hyperglycemia, oxidative stress, and insulin resistance, culminating in endothelial dysfunction. The right side of the diagram maps these physiological changes to specific clinical complications: Diabetic Neuropathy (macrophage/neutrophil infiltration), Diabetic Foot (impaired immune response), Nephropathy (macrophage infiltration and increased CCR2/CCL2), and Retinopathy. The illustration serves as an educational tool for understanding the immunometabolic drivers of chronic diabetic vascular damage.
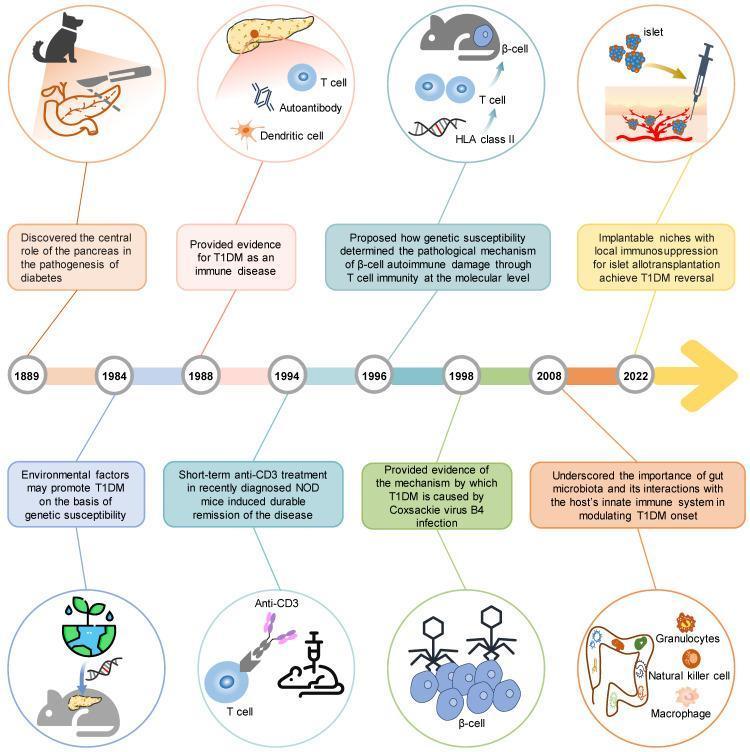
An educational infographic timeline illustrating a century of scientific milestones in Type 1 Diabetes Mellitus (T1DM) research, focusing on pathogenesis and therapeutic interventions. The diagram transitions from the discovery of the pancreas's role in 1889 (depicted by a surgical pancreatectomy icon) to modern strategies like implantable niches in 2022. Key educational concepts include the autoimmune nature of T1DM, represented by circular insets showing T-cell, autoantibody (Y-shaped), and dendritic cell interactions with pancreatic beta-cells. Genetic and molecular mechanisms are highlighted through illustrations of HLA Class II molecules and DNA helices. Clinical advancements featured include environmental triggers (virus-induced autoimmunity via Coxsackie virus B4), immunological therapies (anti-CD3 antibodies in NOD mouse models), and the role of gut microbiota (depicting granulocytes and natural killer cells in the intestine). The visual serves as an overview of how animal models and genetic engineering have elucidated beta-cell destruction and informed transplantation techniques using syringe-mediated islet delivery into engineered microenvironments.
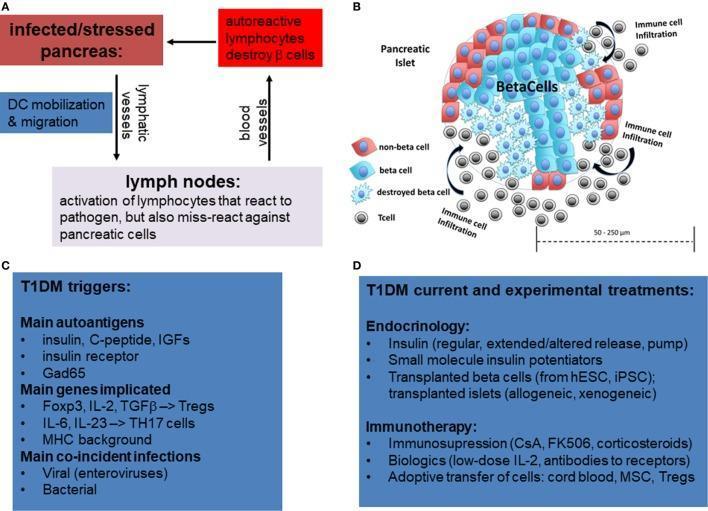
A multi-panel educational graphic illustrating the pathophysiology, triggers, and treatments for Type 1 Diabetes Mellitus (T1DM). Panel A is a flowchart showing the immunological pathway from pancreatic stress to autoreactive lymphocyte-mediated beta cell destruction via dendritic cell (DC) migration to lymph nodes. Panel B provides a pathophysiology diagram of a pancreatic islet (50-250 µm). It depicts immune cell infiltration (insulitis) by T cells (gray), leading to the destruction of central beta cells (blue) while non-beta cells (red) remain at the periphery. Panel C summarizes T1DM triggers, including autoantigens (insulin, GAD65), genetic factors (Foxp3, MHC background), and co-incident infections (enteroviruses). Panel D lists current and experimental treatments, categorizing endocrinology approaches (insulin pumps, islet transplantation from hESCs/iPSCs) and immunotherapy strategies (corticosteroids, biologics like IL-2, and adoptive cell transfers including Tregs and MSCs). The graphic serves as a comprehensive overview of T1DM etiology and clinical management.
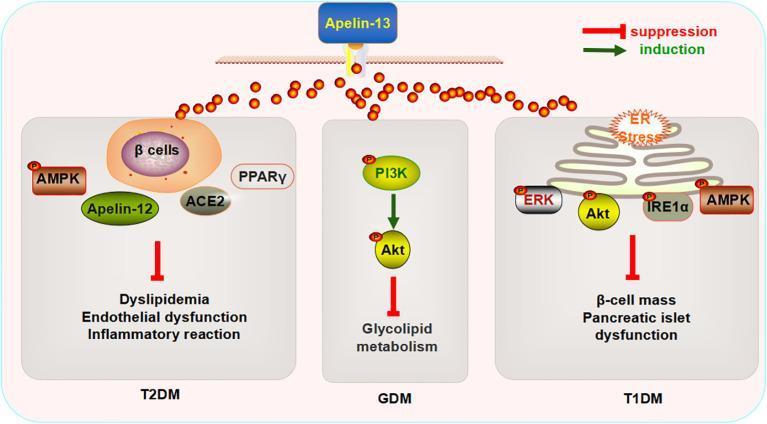
This pathophysiology diagram illustrates the regulatory mechanisms of Apelin-13 across three types of Diabetes Mellitus: Type 2 (T2DM), Gestational (GDM), and Type 1 (T1DM). At the top, Apelin-13 interacts with a cell membrane receptor, triggering signaling cascades represented in three distinct panels. The legend indicates that green arrows signify induction and red flat-headed arrows signify suppression. In T2DM, Apelin-13 influences beta-cell function and pathways involving AMPK, Apelin-12, ACE2, and PPAR̳ to suppress dyslipidemia, endothelial dysfunction, and inflammatory reactions. In the GDM panel, Apelin-13 induces a PI3K/Akt signaling pathway (indicated by phosphorylation symbols 'P') to modulate glycolipid metabolism. In T1DM, the diagram shows the suppression of ER stress and molecules like ERK, Akt, IRE1̑, and AMPK, ultimately counteracting the loss of beta-cell mass and pancreatic islet dysfunction. This visual summarizes the therapeutic potential of the apelin signaling system in metabolic homeostasis and diabetic complications.
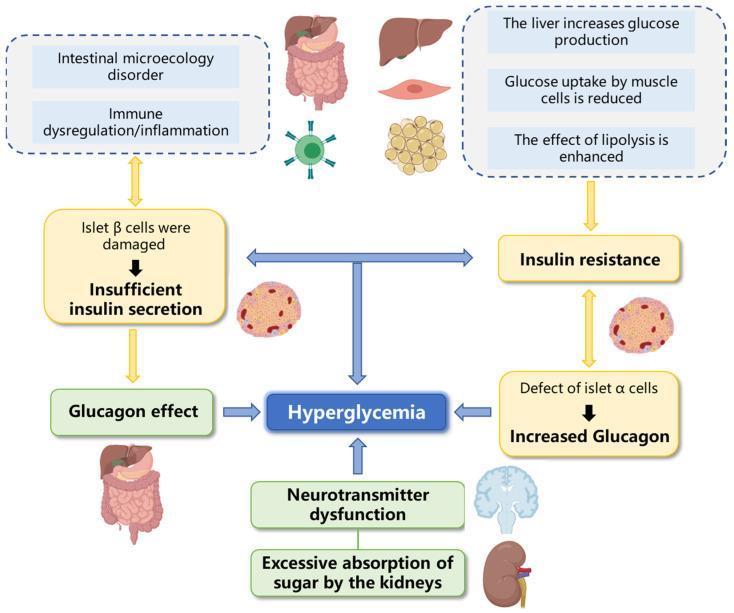
A pathophysiology diagram illustrating the multi-factorial mechanisms leading to hyperglycemia, particularly in the context of Type 2 Diabetes Mellitus. The diagram features a central blue box labeled 'Hyperglycemia' with various upstream contributing pathways. On the left, a pathway originates from 'Intestinal microecology disorder' and 'Immune dysregulation/inflammation,' leading to damage of pancreatic islet β-cells and subsequent 'Insufficient insulin secretion.' On the right, a multi-organ pathway involving the liver (increased glucose production), muscle (reduced glucose uptake), and adipose tissue (enhanced lipolysis) leads to 'Insulin resistance.' Additionally, a 'Defect of islet α-cells' is shown resulting in 'Increased Glucagon.' The bottom of the diagram includes 'Neurotransmitter dysfunction' (represented by a brain icon) and 'Excessive absorption of sugar by the kidneys' (represented by a kidney icon) as further contributing factors. Arrows indicate the flow of physiological dysfunctions that converge to elevate blood glucose levels. The diagram is designed as an educational tool for understanding the metabolic and endocrine drivers of diabetes.
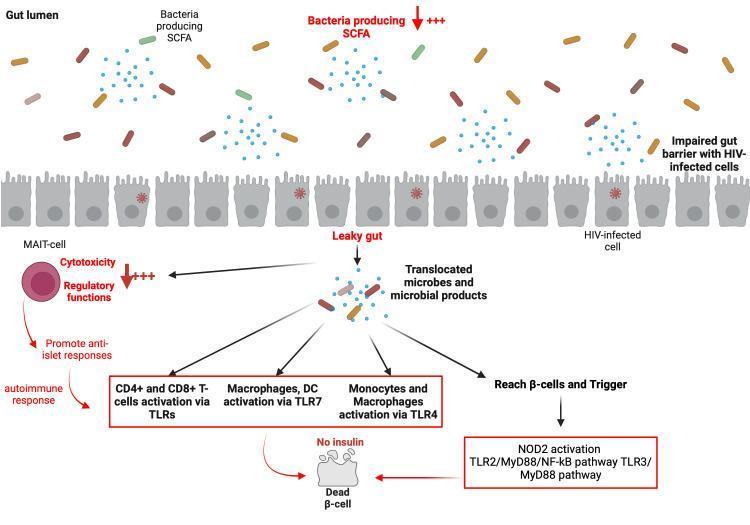
This pathophysiology diagram illustrates the link between HIV-associated gut dysbiosis and the development of Type 1 Diabetes Mellitus (T1DM). The upper section shows the gut lumen with decreased short-chain fatty acid (SCFA)-producing bacteria. An impaired gut barrier is depicted with HIV-infected epithelial cells, leading to a 'leaky gut' and the translocation of microbes and microbial products into the systemic circulation. This translocation triggers two primary pathways: 1) Systemic immune activation via Toll-like receptors (TLRs), involving CD4+/CD8+ T-cells, macrophages, dendritic cells (DCs), and monocytes, which promotes an autoimmune anti-islet response. 2) Direct interaction of microbial products with pancreatic beta cells, triggering intracellular signaling pathways including NOD2, TLR2/MyD88/NF-kB, and TLR3/MyD88. The diagram further highlights the role of Mucosal-Associated Invariant T (MAIT)-cells, which exhibit altered cytotoxicity and regulatory functions under these conditions. The final outcome is pancreatic beta-cell destruction (dead beta-cell) and the cessation of insulin production, illustrating a proposed mechanism for secondary autoimmune diabetes in people living with HIV (PLWH).
diabetic retinopathy nephropathy neuropathy microvascular complications
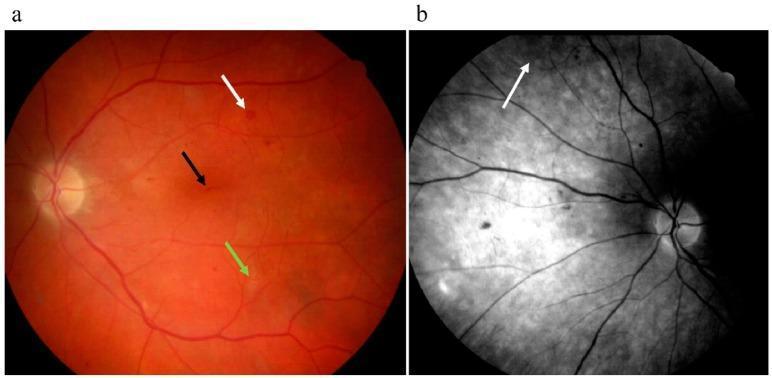
This figure presents two clinical fundus images illustrating severe non-proliferative diabetic retinopathy (DR). Image (a) is a color fundus photograph displaying characteristic retinal microvascular complications. Key visible pathologies include a microaneurysm (black arrow) appearing as a small, focal red dot; an intraretinal hemorrhage (white arrow) shown as a larger, deeper red blot; and a soft exudate or 'cotton-wool spot' (green arrow) appearing as a fuzzy, off-white, ill-defined patch, indicating localized retinal ischemia. Image (b) is a red-free (monochrome) fundus photograph of the same patient, which enhances vascular contrast. It highlights Intraretinal Microvascular Abnormalities (IRMA), indicated by the white arrow, presenting as irregular, tortuous, and branching shunt vessels that represent a transition toward proliferative disease. These findings are clinically significant for the staging and management of diabetic eye disease, demonstrating the progression of vascular permeability and retinal hypoxia in Type 2 diabetic patients.
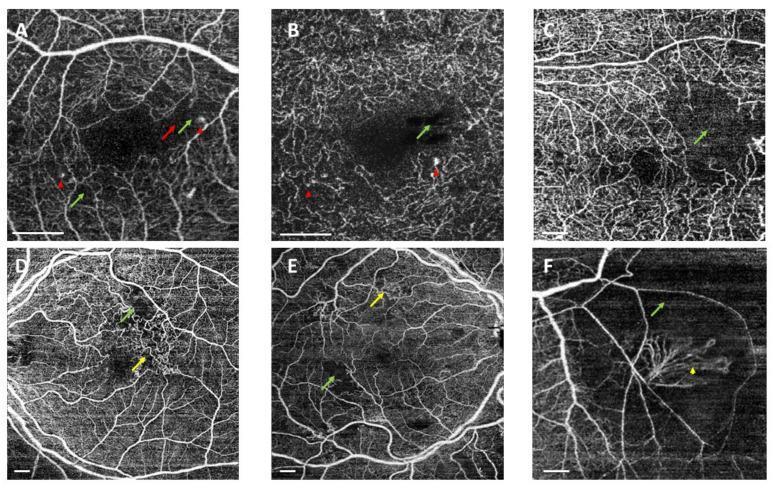
This set of six panels (A-F) presents Swept-Source Optical Coherence Tomography Angiography (SS-OCTA) images of the human retina, illustrating various microvascular complications associated with diabetic retinopathy. Panels A and B display 3x3 mm scans of the superficial and deep capillary plexuses, highlighting an irregular foveal avascular zone (FAZ) (red arrows) and small, hyper-reflective microaneurysms (red arrowheads). Panel C, a 6x6 mm scan, demonstrates significant areas of capillary nonperfusion (green arrows) in the temporal macular region. Panels D and E (9x9 mm and 6x6 mm scans) showcase intraretinal microvascular abnormalities (IRMAs), visible as dilated, looping vessels (yellow arrows) adjacent to areas of impaired perfusion. Panel F illustrates proliferative diabetic retinopathy findings, specifically retinal neovascularization elsewhere (NVE) (yellow arrowhead), appearing as a cluster of fine, abnormal branching vessels originating from a retinal vein. These images serve as educational examples for identifying diagnostic markers such as FAZ remodeling, capillary dropout, and pathologic angiogenesis using non-invasive depth-resolved imaging.
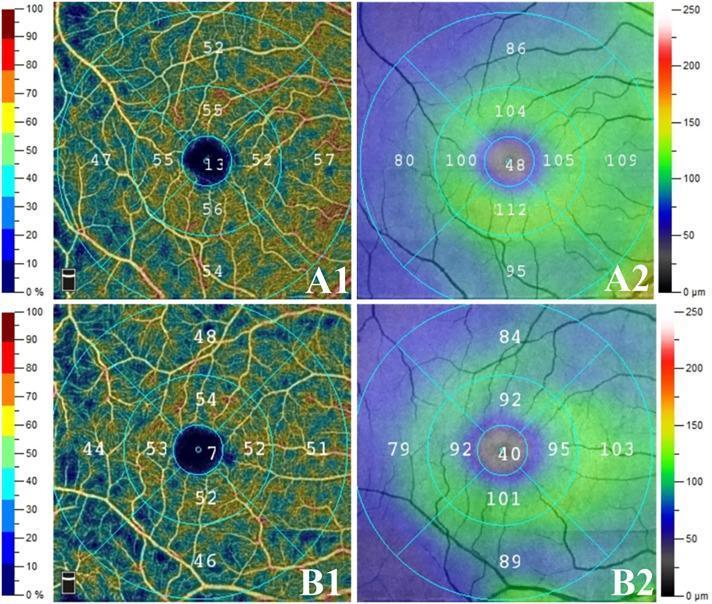
This composite diagnostic image displays Optical Coherence Tomography Angiography (OCTA) scans of the macula, comparing retinal vascular and structural parameters between two clinical states in preclinical diabetic retinopathy. Panels A1 and B1 show heatmaps of the Superficial Capillary Plexus (SCP) vessel density. Panel A1 (Non-Diabetic Nephropathy group) exhibits warmer tones (yellow to orange) and higher numerical density values (e.g., central 13%), indicating a robust microvascular network. Panel B1 (Diabetic Nephropathy group) shows a shift toward cooler blue and green tones with reduced numerical values (e.g., central 7%), signifying microvascular rarefaction. Panels A2 and B2 present Ganglion Cell Complex (GCC) thickness maps. A2 demonstrates thicker tissue (primarily green and yellow hues, values up to 112 µm) compared to B2, which shows thinning of the neurosensory retina indicated by predominant blue hues and lower numerical thickness values (e.g., central 40 µm). Both sets of images utilize an Early Treatment Diabetic Retinopathy Study (ETDRS) grid overlay for regional quantification, highlighting the correlation between diabetic renal status and retinal neurovascular degeneration.
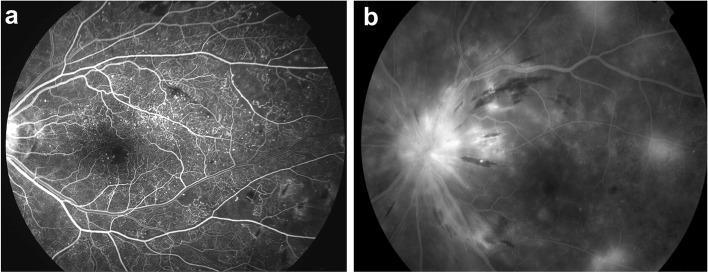
This diagnostic comparison contains two retinal fluorescein angiography (FA) images illustrating vascular complications in diabetic retinopathy. Image (a) depicts diffuse capillary telangiectasis at the posterior pole. It is characterized by widespread, punctate hyperfluorescent spots representing dilated, leaky capillaries and microaneurysms scattered throughout the retinal vascular bed, while larger retinal vessels remain well-defined. Image (b) shows a late-phase angiogram demonstrating significant late disc leakage. This is visualized as intense, blurred hyperfluorescence centered on the optic nerve head, indicating a breakdown of the blood-retinal barrier at the disc. The leakage is accompanied by more generalized, hazy hyperfluorescence across the retina, contrasting with the discrete vascular findings in image (a). These images serve as educational examples of microvascular deterioration and the resulting pathological permeability changes in advanced retinal disease, used to identify prognostic indicators for treatment response.
Diabetes Mellitus - Comprehensive Review (Robbins Pathology)
Robbins, Cotran & Kumar - Pathologic Basis of Disease, pp. 997-1010
1. DEFINITION
- Leading cause of end-stage renal disease in the USA
- Leading cause of adult-onset blindness
- Leading cause of nontraumatic lower extremity amputations
2. DIAGNOSTIC CRITERIA (ADA / WHO)
| Criterion | Diagnostic Threshold |
|---|---|
| Fasting plasma glucose (FPG) | ≥ 126 mg/dL |
| Random plasma glucose (with symptoms) | ≥ 200 mg/dL |
| 2-hr plasma glucose after 75g OGTT | ≥ 200 mg/dL |
| HbA1c | ≥ 6.5% |
All tests except random glucose with symptoms require confirmation on a separate day. If two assays are discordant, the result with greater abnormality is used.
Pre-Diabetes ("Dysglycemia")
| Parameter | Range |
|---|---|
| Fasting plasma glucose | 100-125 mg/dL (Impaired Fasting Glucose) |
| 2-hr OGTT glucose | 140-199 mg/dL (Impaired Glucose Tolerance) |
| HbA1c | 5.7%-6.4% |
3. CLASSIFICATION
DIABETES MELLITUS
├── Type 1 (T1D) — ~5-10% of cases
│     └── Autoimmune β-cell destruction → absolute insulin deficiency
│
├── Type 2 (T2D) — ~90-95% of cases
│     └── Peripheral insulin resistance + relative insulin deficiency
│
├── Monogenic Forms
│     ├── Defects in β-cell function (MODY 1-6, insulin gene mutations)
│     └── Defects in tissue response to insulin (type A insulin resistance,
│         leprechaunism, Rabson-Mendenhall syndrome)
│
└── Secondary / Other
      ├── Gestational diabetes
      ├── Diseases of exocrine pancreas (pancreatitis, CF, hemochromatosis)
      ├── Drug-induced (glucocorticoids, thiazides, antiretrovirals)
      └── Endocrinopathies (Cushing's, acromegaly, pheochromocytoma)
4. PATHOGENESIS
4A. Normal Insulin Physiology (Brief)
Fed state:
  Blood glucose ↑ → Pancreatic β-cells sense glucose
     → ATP production → K⁺ channel closure
     → Membrane depolarization → Ca²⁺ influx
     → Insulin granule exocytosis

Insulin actions:
  ├── Liver: ↑ glycogen synthesis, ↓ gluconeogenesis
  ├── Skeletal muscle: ↑ GLUT4-mediated glucose uptake
  └── Adipose: ↑ triglyceride synthesis, ↓ lipolysis

Fasting state:
  Glucagon → ↑ hepatic glucose output (glycogenolysis + gluconeogenesis)
4B. Pathogenesis of Type 1 Diabetes (T1D)
Flowchart: T1D Pathogenesis
GENETIC SUSCEPTIBILITY
  └── HLA-DR3 / HLA-DR4 (95% of T1D patients)
      HLA-DQ alleles (non-Asp at position 57 of DQβ chain)
      Protective: HLA-DQ with Asp at pos 57 (DQB1*0602)
         ↓
ENVIRONMENTAL TRIGGER
  └── Viral infections (Coxsackievirus B, CMV, rubella, mumps)
      Molecular mimicry: viral antigen resembles β-cell antigen
         ↓
BREAKDOWN OF SELF-TOLERANCE
  └── Autoreactive CD4+ and CD8+ T cells escape thymic deletion
         ↓
INSULITIS
  └── Lymphocytic infiltrate invades islets (CD8+ T cells dominant)
      CD4+ Th1 cells activate macrophages
         ↓
β-CELL DESTRUCTION (multiple mechanisms)
  ├── CD8+ CTLs: perforin/granzyme-mediated cytotoxicity
  ├── CD4+ Th1 cells: Fas-FasL killing
  ├── Cytokines: IL-1, TNF-α, IFN-γ → β-cell apoptosis
  └── Autoantibodies (marker, not pathogenic):
        - Anti-insulin (IAA)
        - Anti-GAD65 (anti-glutamic acid decarboxylase)
        - Anti-islet cell (ICA)
        - Anti-IA-2 (anti-tyrosine phosphatase)
         ↓
PROGRESSIVE LOSS OF β-CELL MASS (90% destruction before symptoms)
         ↓
ABSOLUTE INSULIN DEFICIENCY → DKA, Hyperglycemia
4C. Pathogenesis of Type 2 Diabetes (T2D)
Flowchart: T2D Pathogenesis
GENETIC PREDISPOSITION (polygenic)
  + ENVIRONMENTAL FACTORS (obesity, sedentary lifestyle, high-caloric diet)
         ↓
OBESITY (especially visceral/central)
  └── Adipose tissue releases excess:
      - Free Fatty Acids (FFAs)
      - Adipokines (↑ TNF-α, IL-6, resistin; ↓ adiponectin)
         ↓
PERIPHERAL INSULIN RESISTANCE
  ├── Skeletal muscle: ↓ GLUT4 translocation → ↓ glucose uptake
  ├── Liver: failure of insulin to suppress gluconeogenesis → ↑ hepatic
  │    glucose output
  └── Adipose tissue: unrestrained lipolysis → more FFAs → lipotoxicity
         ↓
COMPENSATORY β-CELL HYPERFUNCTION
  └── β-cells secrete more insulin to maintain euglycemia (hyperinsulinemia)
         ↓
β-CELL EXHAUSTION / DYSFUNCTION (due to):
  ├── Lipotoxicity (excess FFAs)
  ├── Glucotoxicity (chronic hyperglycemia)
  ├── Abnormal incretin effect (↓ GIP, ↓ GLP-1)
  ├── Amyloid (IAPP/amylin) deposition in islets (>90% of long-standing T2D)
  └── Genetic defects in insulin secretion pathways
         ↓
RELATIVE INSULIN DEFICIENCY
         ↓
OVERT T2D (Hyperglycemia)
         ↓
Hyperosmolar Hyperglycemic State (HHS) — not DKA
(residual insulin prevents ketogenesis)
5. TYPE 1 vs TYPE 2 DIABETES - COMPARISON TABLE
| Feature | Type 1 DM | Type 2 DM |
|---|---|---|
| Frequency | 5-10% | 90-95% |
| Age of onset | Usually <20 years (peak 10-14y) | Usually >40 years (now also in children) |
| Body habitus | Normal or thin | Obese (80-90% of cases) |
| Pathogenesis | Autoimmune β-cell destruction | Insulin resistance + relative deficiency |
| Insulin levels | Very low to absent | Normal early, reduced late |
| C-peptide | Absent (no endogenous insulin) | Present (reduced) |
| Ketoacidosis | Common, life-threatening | Rare (residual insulin prevents) |
| Autoantibodies | Present (GAD65, IAA, ICA, IA-2) | Absent |
| HLA association | HLA-DR3, DR4, DQ | Polygenic (no HLA) |
| Concordance (twins) | 30-70% | ~90% |
| Genetics | MHC (HLA) + non-HLA loci (PTPN22, CTLA4, INS) | Polygenic (TCF7L2, KCNJ11, PPARG, etc.) |
| Islet morphology | Insulitis, β-cell loss | Amyloid deposition, ↓ β-cell mass |
| Family history | Less strong | Strong |
| Treatment | Insulin required | Diet, exercise, oral agents ± insulin |
| Acute complication | Diabetic ketoacidosis (DKA) | Hyperosmolar hyperglycemic state (HHS) |
6. MECHANISMS OF HYPERGLYCEMIA-INDUCED TISSUE DAMAGE
HYPERGLYCEMIA
    │
    ├─► ADVANCED GLYCATION END-PRODUCTS (AGEs)
    │     └── Glucose + amino groups → irreversible glycation of proteins
    │         - Cross-link collagen → basement membrane thickening
    │         - Bind RAGE receptors → cytokine release, oxidative stress
    │         - Trap LDL in vessel wall → atherosclerosis
    │
    ├─► POLYOL PATHWAY ACTIVATION
    │     └── Aldose reductase converts glucose → sorbitol (in neurons, lens)
    │         - Sorbitol accumulates → osmotic damage
    │         - ↓ NADPH → ↓ glutathione → oxidative stress
    │         - Contributes to neuropathy, cataracts
    │
    ├─► PROTEIN KINASE C (PKC) ACTIVATION
    │     └── DAG (from excess glucose) activates PKC
    │         - ↑ VEGF → neovascularization (retinopathy)
    │         - ↑ TGF-β → matrix deposition, fibrosis (nephropathy)
    │         - ↑ Endothelin → vasoconstriction
    │         - ↓ NO → endothelial dysfunction
    │
    └─► HEXOSAMINE PATHWAY
          └── Excess glucose → glucosamine → O-GlcNAc modification
              - ↑ TGF-β, PAI-1 → fibrosis, thrombosis
7. MICROVASCULAR vs MACROVASCULAR COMPLICATIONS
Overview Table
| Feature | Microvascular | Macrovascular |
|---|---|---|
| Vessels affected | Capillaries and arterioles | Large/medium muscular arteries |
| Key mechanism | AGEs, PKC, polyol pathway | Accelerated atherosclerosis |
| Specific to DM? | Yes (pathognomonic pattern) | No (but accelerated) |
| Primary lesion | Basement membrane thickening | Atherosclerosis + arteriosclerosis |
| Main manifestations | Retinopathy, Nephropathy, Neuropathy | CAD, stroke, PAD |
| Tight glycemic control | Markedly reduces risk | Partially reduces risk |
| Hypertension effect | Worsens progression | Major accelerant |
7A. MICROVASCULAR COMPLICATIONS
i. Diabetic Nephropathy
Pathological Progression:
  Glomerular hyperfiltration (early) → Microalbuminuria (30-300 mg/day)
  → Proteinuria → Nephrotic syndrome → GFR decline → ESRD

Morphological changes (Robbins):
  ├── Glomerular changes:
  │   ├── Diffuse glomerulosclerosis (most common)
  │   │     Mesangial matrix expansion + GBM thickening
  │   └── Nodular glomerulosclerosis (Kimmelstiel-Wilson lesion)
  │         Pathognomonic — PAS+, ovoid/spherical deposits in mesangium
  │         Associated with "capsular drop" and "fibrin cap" lesions
  ├── Vascular changes: hyaline arteriolosclerosis (afferent AND efferent)
  │     Efferent arteriolar hyalinosis = virtually pathognomonic of DM
  └── Tubular changes: Armanni-Ebstein lesion (glycogen in tubular cells)
ii. Diabetic Retinopathy
NON-PROLIFERATIVE (Background) Retinopathy:
  ├── Microaneurysms (earliest lesion)
  ├── Dot-blot hemorrhages (intraretinal)
  ├── Hard exudates (lipid/protein leakage)
  ├── Soft exudates / cotton-wool spots (nerve fiber infarcts)
  ├── Venous dilation and tortuosity
  └── IRMA (intraretinal microvascular abnormalities)
         ↓ (if untreated/uncontrolled)
PROLIFERATIVE Retinopathy:
  ├── Neovascularization (retinal + disc) — driven by VEGF
  ├── Vitreous hemorrhage
  ├── Fibrous traction bands → tractional retinal detachment
  └── BLINDNESS (most feared outcome)

+ Diabetic Macular Edema (can occur at any stage)
iii. Diabetic Neuropathy
| Type | Description |
|---|---|
| Distal symmetric polyneuropathy | Most common; "glove and stocking" loss |
| Autonomic neuropathy | Gastroparesis, erectile dysfunction, orthostatic hypotension, bladder dysfunction |
| Mononeuropathy | CN III palsy most classic; sudden onset |
| Diabetic amyotrophy | Proximal motor neuropathy |
7B. MACROVASCULAR COMPLICATIONS
ACCELERATED ATHEROSCLEROSIS
  ├── Mechanism:
  │   ├── AGE-modified LDL trapped in vessel wall
  │   ├── Endothelial dysfunction (↓ NO, ↑ oxidative stress)
  │   ├── Platelet hyperaggregability
  │   ├── Dyslipidemia (↑ TG, ↓ HDL, small dense LDL)
  │   └── Insulin resistance → ↑ PAI-1 → pro-thrombotic state
  │
  ├── CORONARY ARTERY DISEASE
  │   └── Leading cause of death in T2D
  │       Silent MIs common (autonomic neuropathy masks angina)
  │
  ├── CEREBROVASCULAR DISEASE
  │   └── 2-4x increased stroke risk
  │       Lacunar infarcts common
  │
  └── PERIPHERAL ARTERY DISEASE
        └── Claudication, rest pain, gangrene
            Diabetic foot: combination of neuropathy + PAD + infection
8. COMPLETE COMPLICATIONS OVERVIEW
CHRONIC COMPLICATIONS OF DM
│
├── MACROVASCULAR (Large vessels - atherosclerosis)
│   ├── Ischemic Heart Disease (MI) ← LEADING CAUSE OF DEATH in T2D
│   ├── Cerebrovascular Disease (Stroke, TIA)
│   └── Peripheral Arterial Disease → gangrene, amputation
│
├── MICROVASCULAR (Small vessels / capillaries)
│   ├── RETINOPATHY → Blindness
│   │   ├── Non-proliferative: microaneurysms, hemorrhages, exudates
│   │   └── Proliferative: neovascularization, vitreous bleed, detachment
│   │
│   ├── NEPHROPATHY → ESRD
│   │   ├── Kimmelstiel-Wilson nodules (nodular glomerulosclerosis)
│   │   ├── Diffuse glomerulosclerosis
│   │   └── Efferent arteriolar hyalinosis
│   │
│   └── NEUROPATHY → Ulcers, Amputation, Autonomic dysfunction
│       ├── Distal symmetric polyneuropathy (most common)
│       ├── Autonomic neuropathy
│       └── Mononeuropathy (CN III)
│
├── DIABETIC FOOT
│   └── Neuropathy + PAD + Infection → ulceration → amputation
│
├── INCREASED SUSCEPTIBILITY TO INFECTION
│   ├── Impaired neutrophil function
│   ├── Mucocutaneous candidiasis
│   ├── TB, UTI, malignant otitis externa (Pseudomonas)
│   └── Rhinocerebral mucormycosis (in DKA)
│
└── METABOLIC COMPLICATIONS (ACUTE)
    ├── DKA (Type 1 predominantly)
    ├── HHS (Type 2)
    └── Hypoglycemia (insulin/sulfonylurea treatment)
9. ACUTE METABOLIC COMPLICATIONS
| Feature | DKA | HHS |
|---|---|---|
| Type | Predominantly T1D | Predominantly T2D (elderly) |
| Mechanism | Absolute insulin deficiency → lipolysis → ketogenesis | Profound dehydration from osmotic diuresis |
| Blood glucose | 250-600 mg/dL | Often >600 mg/dL (can reach 1200) |
| Ketones | +++ | Absent or trace |
| pH | <7.3 (acidosis) | Normal or mildly low |
| Osmolality | Mildly elevated | Markedly elevated (>320 mOsm/kg) |
| Symptoms | Kussmaul breathing, fruity breath, N/V | Polyuria, polydipsia, altered sensorium |
| Mortality | ~1-5% | Higher (15-20%) |
10. DKA Pathophysiology Flowchart (from Robbins)
ABSOLUTE INSULIN DEFICIENCY (T1D trigger: infection, omission, new onset)
         │
    ┌────┴────────────────────────────────┐
    ▼                                     ▼
GLYCOGENOLYSIS &                     LIPOLYSIS (adipose)
GLUCONEOGENESIS ↑                    (hormone-sensitive lipase ↑)
    └── Hyperglycemia                      │
         └── Osmotic diuresis         ↑ Free Fatty Acids
              └── Polyuria/             (reach liver)
                  dehydration                │
                                       β-oxidation → Acetyl-CoA
                                            │
                                       Ketone body synthesis
                                       (acetoacetate, β-hydroxybutyrate)
                                            │
                                    Ketonemia + Ketonuria
                                    → Metabolic acidosis (DKA)
                                    → Kussmaul breathing
                                    → Fruity breath (acetone)
11. MORPHOLOGY SUMMARY (Pancreatic Islets)
| Finding | T1D | T2D |
|---|---|---|
| Islet size | ↓↓ (destruction) | Mildly ↓ |
| Insulitis | Yes (lymphocytic infiltrate) | No |
| Amyloid deposition | No | Yes (>90% in long-standing T2D) |
| β-cell mass | ↓↓↓ (near total loss) | Mildly ↓ (~50%) |
| α cells | Preserved | Preserved or ↑ |
| Fibrosis | Variable | May be present |
12. IMAGES
T2D Pathophysiology: Obesity → Inflammation → Vascular Complications
T1D Pathogenesis: Autoimmune β-cell Destruction
Hyperglycemia → Multiple Contributing Pathways to T2D
Diabetic Retinopathy - Non-proliferative Fundus
SUMMARY FLOWCHART: DM from Risk Factor to Complication
RISK FACTORS
├── T1D: HLA-DR3/DR4, viral trigger, autoimmunity genes
└── T2D: Obesity, sedentary lifestyle, family history, ethnicity
         │
         ▼
PATHOGENESIS
├── T1D: Insulitis → β-cell destruction → absolute insulin lack
└── T2D: Insulin resistance → β-cell exhaustion → relative insulin lack
         │
         ▼
HYPERGLYCEMIA (Chronic)
         │
    ┌────┴────────────────────────┐
    ▼                             ▼
MICROVASCULAR               MACROVASCULAR
(AGEs, PKC, polyol path)    (Accelerated atherosclerosis)
    │                             │
    ├── Retinopathy → Blindness   ├── CAD → MI
    ├── Nephropathy → ESRD        ├── Stroke
    └── Neuropathy →              └── PAD → Gangrene
        ├── Ulcers                      │
        └── Amputation          DIABETIC FOOT
                                (PAD + Neuropathy + Infection)
         │
         ▼
ACUTE COMPLICATIONS
├── DKA (T1D) — ketoacidosis, Kussmaul breathing
└── HHS (T2D) — severe hyperosmolarity, altered sensorium
Key Robbins Points to Remember
- Diagnosis: Any 1 of 4 criteria (FPG ≥126, random ≥200, OGTT 2h ≥200, HbA1c ≥6.5%), confirmed on a second day (except symptomatic random glucose).
- T1D: HLA-linked, autoimmune, CD8+ T cells are the main effectors; autoantibodies are markers, not pathogenic agents.
- T2D: Insulin resistance precedes β-cell failure; amyloid (IAPP) deposition is a hallmark of long-standing disease.
- Kimmelstiel-Wilson nodules = nodular glomerulosclerosis = pathognomonic of diabetic nephropathy.
- Efferent arteriolar hyalinosis = virtually pathognomonic of DM (vs. afferent-only in hypertension).
- Microaneurysms = earliest lesion in diabetic retinopathy.
- Tight glycemic control dramatically reduces microvascular complications (DCCT/UKPDS evidence) but macrovascular benefit requires additional cardiovascular risk reduction.
- DKA vs HHS: DKA = T1D + ketoacidosis; HHS = T2D elderly + severe hyperosmolarity, higher mortality.
Diabetes Mellitus - Complete Robbins Review
Robbins, Cotran & Kumar - Pathologic Basis of Disease, Chapter 24, pp. 997-1010
1. DEFINITION
- Leading cause of end-stage renal disease in the USA
- Leading cause of adult-onset blindness
- Leading cause of nontraumatic lower extremity amputations
- Affects >30 million in the USA (>11% of population); ~422 million worldwide
2. DIAGNOSTIC CRITERIA (ADA / WHO)
| Criterion | Diagnostic Threshold |
|---|---|
| Fasting plasma glucose (FPG) | ≥ 126 mg/dL |
| Random plasma glucose (with symptoms) | ≥ 200 mg/dL |
| 2-hr plasma glucose after 75g OGTT | ≥ 200 mg/dL |
| HbA1c | ≥ 6.5% |
All tests except the random glucose test in a patient with classic symptoms require confirmation on a separate day. When two assays are discordant, the result with the greater degree of abnormality is used.
Pre-Diabetes ("Dysglycemia")
| Parameter | Range |
|---|---|
| Fasting plasma glucose | 100-125 mg/dL (Impaired Fasting Glucose) |
| 2-hr OGTT glucose | 140-199 mg/dL (Impaired Glucose Tolerance) |
| HbA1c | 5.7%-6.4% |
3. CLASSIFICATION
DIABETES MELLITUS
├── Type 1 (T1D) — ~5-10% of cases
│     └── Autoimmune β-cell destruction → ABSOLUTE insulin deficiency
│
├── Type 2 (T2D) — ~90-95% of cases
│     └── Peripheral insulin resistance + RELATIVE insulin deficiency
│
├── Monogenic Forms
│     ├── β-cell function defects (MODY 1-6, insulin gene mutations)
│     └── Tissue response to insulin defects
│           (Type A insulin resistance, leprechaunism,
│            Rabson-Mendenhall syndrome)
│
└── Secondary / Other
      ├── Gestational diabetes
      ├── Diseases of exocrine pancreas
      │     (pancreatitis, CF, hemochromatosis, neoplasia)
      ├── Drug-induced (glucocorticoids, thiazides, antiretrovirals)
      └── Endocrinopathies
            (Cushing's syndrome, acromegaly, pheochromocytoma)
4. PATHOGENESIS
4A. Normal Insulin Physiology
Fed state:
  Blood glucose ↑ → β-cells sense glucose
     → Glycolysis → ATP production → K⁺ channel closure
     → Membrane depolarization → Ca²⁺ influx
     → Insulin granule exocytosis

Insulin actions:
  ├── Liver:  ↑ glycogen synthesis, ↓ gluconeogenesis
  ├── Muscle: ↑ GLUT4-mediated glucose uptake, ↑ glycogen
  └── Adipose: ↑ TG synthesis, ↓ lipolysis

Fasting state:
  Glucagon dominates → ↑ hepatic glucose output
  (glycogenolysis + gluconeogenesis)
4B. Pathogenesis of Type 1 Diabetes
GENETIC SUSCEPTIBILITY
  ├── HLA-DR3, HLA-DR4 (present in ~95% of T1D patients)
  ├── HLA-DQ alleles (non-Asp at position 57 of DQβ → susceptibility)
  ├── Protective: HLA-DQB1*0602 (Asp at position 57)
  └── Non-HLA genes: PTPN22, CTLA4, INS gene region
         ↓
ENVIRONMENTAL TRIGGER
  ├── Viral infections (Coxsackievirus B, CMV, rubella, mumps)
  └── Molecular mimicry: viral antigen cross-reacts with β-cell antigen
         ↓
LOSS OF SELF-TOLERANCE
  └── Autoreactive CD4+ and CD8+ T cells escape thymic deletion
      Or regulatory T cells (Tregs) fail to suppress autoreactivity
         ↓
INSULITIS (lymphocytic infiltration of islets)
  ├── CD8+ cytotoxic T cells (dominant effectors)
  ├── CD4+ Th1 helper cells → activate macrophages
  └── B cells (produce autoantibodies — markers, not pathogenic)
         ↓
β-CELL DESTRUCTION (multiple mechanisms)
  ├── CD8+ CTLs: perforin/granzyme cytotoxicity
  ├── CD4+ Th1 cells: Fas-FasL killing
  ├── Cytokines: IL-1β, TNF-α, IFN-γ → β-cell apoptosis
  └── Autoantibodies (diagnostic markers):
        • Anti-insulin (IAA) — earliest in children
        • Anti-GAD65 (glutamic acid decarboxylase)
        • Anti-islet cell (ICA)
        • Anti-IA-2 (tyrosine phosphatase)
         ↓
PROGRESSIVE β-CELL LOSS
  (>90% must be destroyed before symptoms appear)
         ↓
ABSOLUTE INSULIN DEFICIENCY
  → Classic triad: polydipsia, polyuria, polyphagia
  → DKA (life-threatening)
- Reduced islet size and number
- Insulitis (lymphocytic infiltrate) in early/active disease
- β-cells selectively destroyed; α, δ, PP cells preserved
4C. Pathogenesis of Type 2 Diabetes
GENETIC PREDISPOSITION (polygenic)
  ├── TCF7L2 (transcription factor - insulin secretion)
  ├── KCNJ11 (K⁺-ATP channel in β-cells)
  ├── PPARG (adipocyte differentiation)
  └── Many others (>100 susceptibility loci identified)

+

ENVIRONMENTAL FACTORS
  └── Obesity (especially visceral), sedentary lifestyle,
      high-caloric diet, aging
         ↓
VISCERAL ADIPOSE TISSUE EXCESS
  ├── ↑ Free Fatty Acids (FFAs) in portal circulation
  ├── ↑ Pro-inflammatory adipokines: TNF-α, IL-6, resistin
  └── ↓ Anti-inflammatory adipokines: adiponectin
         ↓
PERIPHERAL INSULIN RESISTANCE
  ├── Skeletal muscle: ↓ GLUT4 translocation → ↓ glucose uptake
  ├── Liver: failure to suppress gluconeogenesis → ↑ glucose output
  │           MASLD (Metabolic-Associated Steatotic Liver Disease)
  └── Adipose tissue: unrestrained lipolysis → ↑↑ FFAs (lipotoxicity)
         ↓
COMPENSATORY β-CELL HYPERFUNCTION
  └── Hyperinsulinemia to maintain euglycemia
         ↓
β-CELL EXHAUSTION / DYSFUNCTION (mechanisms):
  ├── Lipotoxicity (excess FFAs impair β-cell function)
  ├── Glucotoxicity (chronic hyperglycemia damages β-cells)
  ├── Abnormal incretin effect (↓ GIP, ↓ GLP-1 secretion)
  ├── Amyloid (IAPP/amylin) deposition in islets
  │     → Present in >90% of long-standing T2D islets
  └── Genetic defects in insulin secretion pathway
         ↓
RELATIVE INSULIN DEFICIENCY
         ↓
OVERT T2D → Hyperosmolar Hyperglycemic State (HHS), not DKA
- Amyloid deposition (IAPP) - characteristic finding
- Mild-to-moderate reduction in β-cell mass (~50%)
- No insulitis
- Possible mild fibrosis
5. TYPE 1 vs TYPE 2 DM - COMPARISON TABLE
| Feature | Type 1 DM | Type 2 DM |
|---|---|---|
| Frequency | 5-10% | 90-95% |
| Age of onset | Usually <20 yrs (peak 10-14y) | Usually >40 yrs (now in children too) |
| Body habitus | Normal/thin | Obese (80-90%) |
| Pathogenesis | Autoimmune β-cell destruction | Insulin resistance + β-cell failure |
| Insulin levels | Very low to absent | Normal early → reduced late |
| C-peptide | Absent | Present (reduced) |
| Ketoacidosis | Common, life-threatening | Rare |
| Autoantibodies | Present (GAD65, IAA, ICA, IA-2) | Absent |
| HLA association | HLA-DR3, DR4 (95%) | Polygenic (no HLA link) |
| Twin concordance | 30-70% | ~90% |
| Insulitis | Yes | No |
| Islet amyloid | No | Yes (long-standing disease) |
| Acute complication | DKA | HHS |
| Treatment | Insulin required | Diet + exercise + oral agents ± insulin |
| Family history | Moderate | Strong |
6. MECHANISMS OF HYPERGLYCEMIA-INDUCED DAMAGE
HYPERGLYCEMIA (sustained, chronic)
         │
    ┌────┴────────────────────────────────────────┐
    │                                             │
    ▼                                             ▼
AGE PATHWAY                              POLYOL PATHWAY
(Advanced Glycation                      (Sorbitol accumulation)
 End-products)
                                         Glucose + Aldose reductase
Glucose + protein amino                  → Sorbitol (cannot exit cells)
groups → Schiff bases                    → Osmotic damage (lens, nerves)
→ Amadori products                       ↓ NADPH → ↓ Glutathione
→ Irreversible AGEs                      → Oxidative stress
                                         Contributes to: neuropathy,
├── Cross-link collagen                  cataracts
│   → BM thickening
├── Bind RAGE receptors               ──────────────────────────────
│   → Cytokines, ox. stress              PKC PATHWAY
│   → Inflammation                    (Protein Kinase C activation)
└── Trap LDL in vessel wall
    → Atherosclerosis                 Excess glucose → ↑ DAG
                                      → PKC activation
                                      → ↑ VEGF (neovascularization)
                                      → ↑ TGF-β (fibrosis)
                                      → ↑ Endothelin (vasoconstriction)
                                      → ↓ NO (endothelial dysfunction)

    HEXOSAMINE PATHWAY
    Glucose → UDP-GlcNAc
    → O-GlcNAc protein modification
    → ↑ TGF-β, ↑ PAI-1
    → Fibrosis + thrombosis
7. MICROVASCULAR vs MACROVASCULAR COMPLICATIONS
| Feature | Microvascular | Macrovascular |
|---|---|---|
| Vessels affected | Capillaries and arterioles | Large/medium muscular arteries |
| Primary lesion | Basement membrane thickening, pericyte loss | Atherosclerosis (accelerated) |
| Key mechanism | AGEs, PKC, polyol pathway | AGE-modified LDL, endothelial dysfunction, dyslipidemia |
| Specific to DM? | Yes - pattern pathognomonic | No - accelerated general atherosclerosis |
| Main manifestations | Retinopathy, Nephropathy, Neuropathy | CAD, Stroke, PAD |
| Tight glycemic control | Strongly reduces risk (DCCT/UKPDS) | Partial benefit |
| Hypertension | Worsens progression | Major accelerant |
7A. MICROVASCULAR COMPLICATIONS
i. Diabetic Nephropathy
PROGRESSION OF DIABETIC NEPHROPATHY

Early:
  Glomerular hyperfiltration (↑ GFR)
  Glomerular hypertrophy
       ↓
  Microalbuminuria (30-300 mg/day) ← EARLIEST CLINICAL SIGN
       ↓
  Macroalbuminuria (>300 mg/day) / Overt proteinuria
       ↓
  Nephrotic syndrome (heavy proteinuria)
       ↓
  Progressive GFR decline
       ↓
  END-STAGE RENAL DISEASE (ESRD)

MORPHOLOGICAL CHANGES:
  Glomerular:
  ├── Diffuse glomerulosclerosis (MOST COMMON)
  │     - Mesangial matrix expansion
  │     - GBM thickening
  └── Nodular glomerulosclerosis (KIMMELSTIEL-WILSON LESION)
        - PATHOGNOMONIC of diabetic nephropathy
        - PAS-positive ovoid/spherical nodules in mesangium
        - "Capsular drop" and "fibrin cap" lesions

  Vascular:
  └── Hyaline arteriolosclerosis
        - Afferent AND efferent arterioles affected
        - Efferent arteriolar hyalinosis = VIRTUALLY PATHOGNOMONIC of DM
          (hypertension causes only afferent hyalinosis)

  Tubular:
  └── Armanni-Ebstein lesion
        - Glycogen accumulation in tubular cells
        - Seen in poorly controlled T1D
ii. Diabetic Retinopathy
DIABETIC RETINOPATHY PROGRESSION

NON-PROLIFERATIVE (Background) Retinopathy:
  ├── Microaneurysms ← EARLIEST lesion (focal capillary bulges)
  ├── Dot-blot hemorrhages (intraretinal)
  ├── Hard exudates (lipid/protein leakage from leaky vessels)
  ├── Soft exudates / cotton-wool spots (retinal nerve fiber infarcts)
  ├── Venous beading and dilation
  └── IRMA (intraretinal microvascular abnormalities)
         ↓ (without treatment / with poor control)
PROLIFERATIVE Retinopathy:
  ├── Neovascularization (VEGF-driven new vessel formation)
  │     - On retinal surface, optic disc, iris (rubeosis)
  ├── Vitreous hemorrhage (from fragile new vessels)
  ├── Fibrous traction bands → Tractional retinal detachment
  └── BLINDNESS

+ Diabetic Macular Edema (can occur at any stage → central vision loss)
iii. Diabetic Neuropathy
| Type | Features | Mechanism |
|---|---|---|
| Distal symmetric polyneuropathy | Most common; "glove and stocking" sensory loss; pain, paresthesia; reduced DTRs | AGEs in Schwann cells, sorbitol buildup, endoneurial ischemia |
| Autonomic neuropathy | Gastroparesis, erectile dysfunction, orthostatic hypotension, bladder atony, sweating abnormalities | Autonomic nerve fiber damage |
| Mononeuropathy | CN III palsy most classic (ptosis, diplopia, spared pupil); sudden onset, usually reversible | Vascular ischemia of nerve trunk |
| Diabetic amyotrophy | Proximal motor weakness, pain | Lumbosacral plexus ischemia |
7B. MACROVASCULAR COMPLICATIONS
ACCELERATED ATHEROSCLEROSIS IN DM

Mechanisms:
  ├── AGE-modified LDL trapped in arterial intima
  ├── Endothelial dysfunction (↓ NO, ↑ oxidative stress)
  ├── Platelet hyperaggregability
  ├── Dyslipidemia (↑ TG, ↓ HDL, ↑ small dense LDL)
  ├── Insulin resistance → ↑ PAI-1 → pro-thrombotic state
  └── Hypertension (co-existent, accelerates damage)
         │
    ┌────┴──────────────────────────────┐
    ▼                                   ▼                    ▼
CORONARY ARTERY              CEREBROVASCULAR          PERIPHERAL ARTERY
DISEASE                      DISEASE                  DISEASE (PAD)
  │                            │                          │
Leading cause of death       2-4x ↑ stroke risk        Claudication,
in T2D                       Lacunar infarcts           rest pain,
Silent MIs common            TIA                        gangrene,
(autonomic neuropathy)       Vascular dementia          amputation
8. COMPLETE COMPLICATIONS OVERVIEW
CHRONIC COMPLICATIONS OF DIABETES
│
├── MACROVASCULAR (accelerated atherosclerosis in large vessels)
│   ├── Ischemic Heart Disease → MI ← LEADING CAUSE OF DEATH in DM
│   ├── Cerebrovascular Disease → Stroke, TIA, vascular dementia
│   └── Peripheral Arterial Disease → Claudication → Gangrene
│
├── MICROVASCULAR (BM thickening, pericyte loss in capillaries)
│   ├── RETINOPATHY → BLINDNESS (leading cause in adults)
│   │   ├── Non-proliferative: microaneurysms, hemorrhages, exudates
│   │   └── Proliferative: neovascularization, vitreous bleed, detachment
│   │
│   ├── NEPHROPATHY → ESRD (leading cause of dialysis in USA)
│   │   ├── Kimmelstiel-Wilson nodules (pathognomonic)
│   │   ├── Diffuse glomerulosclerosis
│   │   └── Efferent arteriolar hyalinosis
│   │
│   └── NEUROPATHY → Ulcers, Autonomic dysfunction
│       ├── Distal symmetric polyneuropathy (most common)
│       ├── Autonomic neuropathy (gastroparesis, ED, OH)
│       └── Mononeuropathy (CN III palsy)
│
├── DIABETIC FOOT
│   └── Neuropathy + PAD + Infection → Ulceration → Amputation
│       (leading cause of nontraumatic lower limb amputation)
│
├── INCREASED INFECTION SUSCEPTIBILITY
│   ├── Impaired neutrophil function, chemotaxis, phagocytosis
│   ├── Mucocutaneous candidiasis (oral, vaginal)
│   ├── TB, recurrent UTI, pyelonephritis
│   ├── Malignant (necrotizing) otitis externa (Pseudomonas aeruginosa)
│   └── Rhinocerebral mucormycosis (especially during DKA)
│
└── ACUTE METABOLIC COMPLICATIONS
    ├── DKA (predominantly T1D)
    ├── Hyperosmolar Hyperglycemic State (T2D elderly)
    └── Hypoglycemia (insulin/sulfonylurea treatment)
9. ACUTE METABOLIC COMPLICATIONS - COMPARISON
| Feature | DKA | HHS |
|---|---|---|
| Type | T1D predominantly | T2D elderly patients |
| Mechanism | Absolute insulin deficiency → lipolysis → ketogenesis | Profound dehydration from sustained osmotic diuresis |
| Blood glucose | 250-600 mg/dL | Often >600 (can reach 1200 mg/dL) |
| Ketones | +++ | Absent or trace |
| pH | <7.3 (metabolic acidosis) | Normal or near-normal |
| Osmolality | Mildly elevated | Markedly elevated (>320 mOsm/kg) |
| Kussmaul breathing | Yes (compensatory) | No |
| Fruity breath | Yes (acetone) | No |
| Clinical setting | Infection, omission of insulin, new T1D | Elderly with infection, stroke, unable to maintain fluid intake |
| Mortality | ~1-5% | ~15-20% (higher) |
DKA Pathophysiology
ABSOLUTE INSULIN DEFICIENCY
  (trigger: infection, omission of insulin, new-onset T1D)
           │
    ┌──────┴──────────────────────────────────────┐
    ▼                                             ▼
↑ Gluconeogenesis &                        ↑ Hormone-sensitive lipase
  Glycogenolysis                             (adipose tissue lipolysis)
    └── HYPERGLYCEMIA                            │
          └── Osmotic diuresis               ↑ Free Fatty Acids
                └── Polyuria,                  (enter hepatic mitochondria)
                    dehydration                    │
                    electrolyte loss           β-oxidation → Acetyl-CoA
                                                   │
                                         KETONE BODY SYNTHESIS
                                         (acetoacetate, β-hydroxybutyrate)
                                                   │
                                         Ketonemia + Ketonuria
                                         → METABOLIC ACIDOSIS
                                         → Kussmaul breathing (deep, labored)
                                         → Fruity odor (acetone)
                                         → Nausea/vomiting, abdominal pain
                                         → Depressed consciousness → COMA
10. ISLET MORPHOLOGY SUMMARY
| Finding | T1D | T2D |
|---|---|---|
| Insulitis | Yes (lymphocytic infiltrate) | No |
| Amyloid deposition | No | Yes (>90% in long-standing DM) |
| β-cell mass | ↓↓↓ (near total loss) | Mildly ↓ (~50%) |
| α-cells | Preserved (relatively ↑) | Preserved or ↑ |
| Islet size | Markedly reduced | Mildly reduced |
| Fibrosis | Variable | May be present |
IMAGES
T2D: Obesity-Driven Pathophysiology to Vascular Complications
T1D: Autoimmune β-cell Destruction
Diabetic Retinopathy - Non-Proliferative Fundus
KEY ROBBINS MEMORY POINTS
- T1D = HLA-DR3/DR4 + autoimmune insulitis + absolute insulin deficiency + DKA
- T2D = obesity + insulin resistance + islet amyloid (IAPP) + relative insulin deficiency + HHS
- Kimmelstiel-Wilson nodules = pathognomonic of diabetic nephropathy
- Efferent arteriolar hyalinosis = virtually pathognomonic of DM (distinguishes from hypertension which affects only afferent)
- Microaneurysms = earliest lesion in diabetic retinopathy
- VEGF drives neovascularization in proliferative retinopathy
- AGEs + PKC activation + polyol pathway + hexosamine pathway = four key mechanisms of microvascular damage
- Amyloid (IAPP) in >90% of long-standing T2D islets
- >90% β-cell destruction required before T1D becomes symptomatic
- Efferent arteriolar hyalinosis = DM | Afferent only = hypertension
Diabetic nephropathy
diabetic nephropathy Kimmelstiel Wilson nodular glomerulosclerosis histology
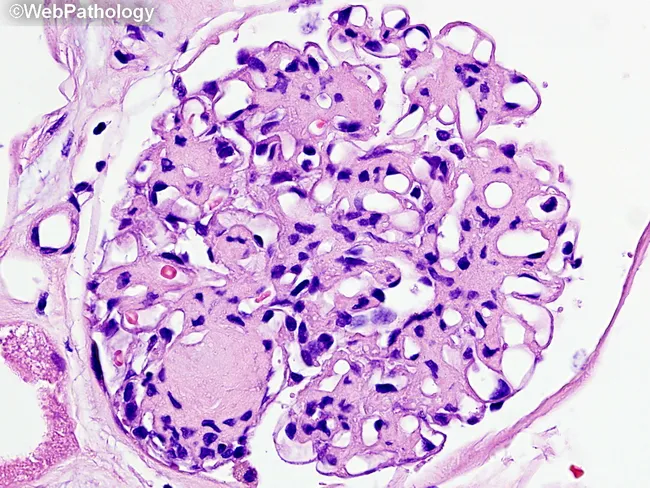
This is a renal biopsy histology slide examined under brightfield light microscopy. The primary subject is diabetic nephropathy with nodular glomerulosclerosis (Kimmelstiel-Wilson nodules) and diffuse mesangial sclerosis within the glomerular tuft of a renal cortex specimen. The glomerulus shows nodular mesangial expansion forming rounded, eosinophilic nodules that disrupt capillary loops, together with diffuse increased mesangial matrix. Capillary lumina are variably compressed, and arterioles frequently exhibit hyaline thickening consistent with diabetic microangiopathy. The cellular morphology is characterized by expanded mesangial cells with increased extracellular matrix and relatively sparse inflammatory infiltrate. The basement membrane appears thickened in cross-sectional elements. In this image, Masson’s trichrome is not visible; a subsequent stain would color collagen in blue, highlighting fibrotic remodeling. Clinically, these histologic features correlate with progressive proteinuria and reduced glomerular filtration rate in long-standing diabetes. Diagnostic significance rests on the combination of nodular sclerosis (Kimmelstiel-Wilson nodules) and diffuse mesangial sclerosis as hallmarks of diabetic nephropathy. Differential considerations include focal segmental glomerulosclerosis and hypertensive nephrosclerosis, but the nodular pattern is characteristic. This image is valuable for pathology education, nephrology training, and research into diabetic kidney disease progression and glycemic control effects. Representative for teaching clinics, this image supports correlating histology with clinical nephrology.
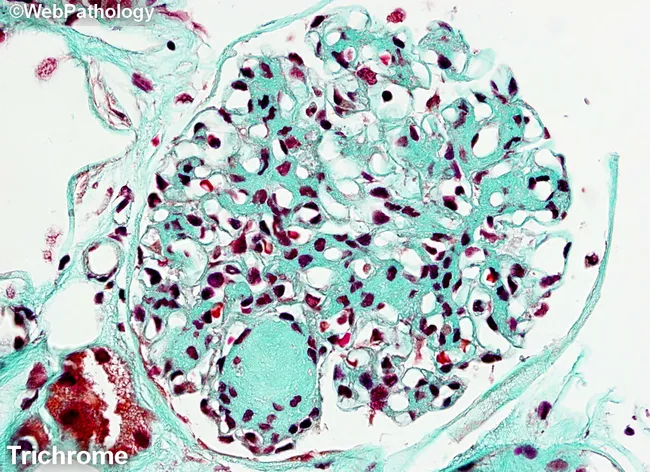
Masson's trichrome-stained renal cortex histology imaged at light microscopy reveals nodular glomerulosclerosis characteristic of diabetic nephropathy. The glomerulus shows circumscribed Kimmelstiel-Wilson nodules-eosinophilic mesangial nodules that expand the tuft and encroach on capillary loops. Diffuse mesangial sclerosis is evident as widespread mesangial matrix expansion, with increased basophilic mesangial tissue and accentuated blue-green collagen deposition in the extracellular matrix on Masson stain. The stain differentiates collagen (blue/green) from cytoplasm and nuclei (red/purple), highlighting the fibrotic nodules and mesangial expansion. Within the mesangium, there is progressive accumulation of matrix with variable cellularity; some capillary lumina appear narrowed due to nodular compression. The surrounding tubulointerstitial tissue may show mild chronic changes, consistent with chronic diabetic nephropathy. The overall pattern is typical of long-standing diabetes mellitus with nephropathy and correlates with progressive proteinuria, reduced glomerular filtration rate, and eventual renal insufficiency. Clinically, this finding supports diagnosis of diabetic kidney disease (diabetic nephropathy) and is essential for grading disease stage and guiding management. Differential diagnoses include nodular glomerulosclerosis due to amyloidosis or hypertensive nephrosclerosis, but the classic KW nodules and mesangial expansion favor diabetes. This image is valuable for medical education, pathology training, and research into diabetic renal pathology.
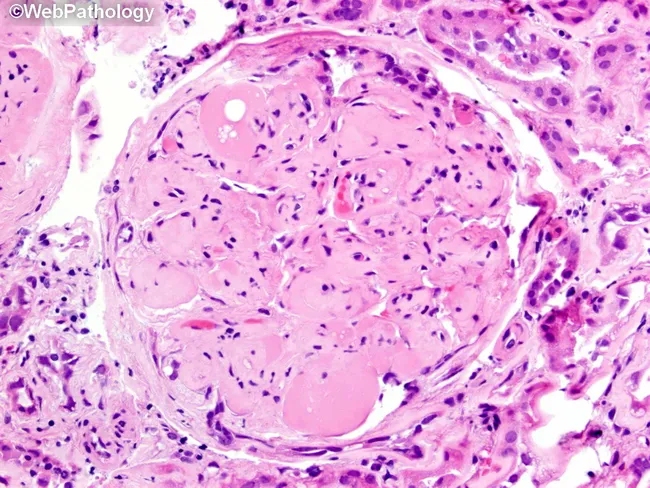
Imaging modality: brightfield histopathology. This slide shows a renal glomerulus from a biopsy specimen of diabetic nephropathy. The mesangial matrix is markedly expanded, producing round to nodular consolidations within the tuft. Several Kimmelstiel‑Wilson nodules are evident as acellular, hyaline nodules that distend the mesangial stalks and encroach on capillary loops. The glomerular basement membranes appear thickened on corresponding PAS‑positive and silver‑stained sections (referenced in adjacent images), consistent with nodular diabetic glomerulosclerosis. The surrounding cortex exhibits mild chronic interstitial changes and arteriolar hyalinosis in keeping with chronic diabetic kidney disease. The glomerulus displays relatively extensive mesangial deposition with focally patent capillary lumina, creating a characteristic nodular pattern. Overall, the morphology is diagnostic for diabetic microangiopathy with progressive nodular sclerosis. Clinically, these findings correlate with long‑standing hyperglycemia, proteinuria, and reduced GFR. Pathological significance: KW nodules indicate advanced disease and higher risk of progression to end‑stage renal disease. Differential considerations include non‑diabetic nodular glomerulosclerosis and other glomerulopathies, but the classic KW nodules and mesangial expansion strongly support diabetic nephropathy. This image is valuable for education, pathology review, and correlating histology with clinical diabetes management. It highlights key features for learners: mesangial expansion, KW nodules, PAS positivity, and altered capillary luminal flow in practice.
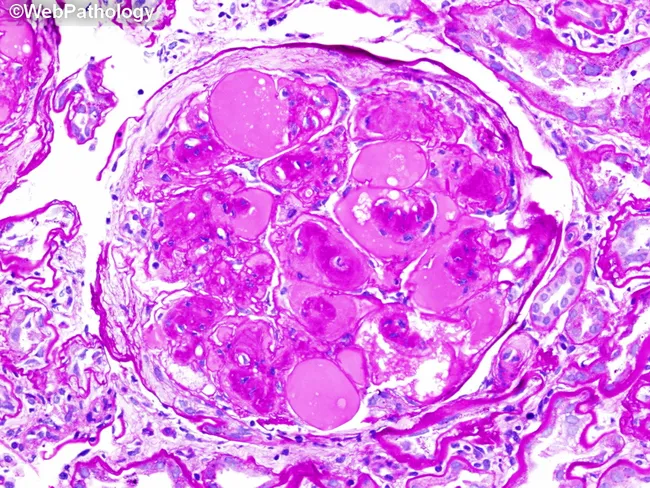
This is a renal biopsy histology slide prepared with Periodic acid–Schiff (PAS) stain and imaged by light microscopy at high magnification. The primary structure is a renal glomerulus within the renal cortex. The specimen shows nodular glomerulosclerosis characteristic of advanced diabetic nephropathy. Mesangial matrix is markedly expanded, producing discrete, rounded nodules (Kimmelstiel-Wilson nodules) that project into the glomerular tuft. The nodules are PAS-positive and appear eosinophilic, encroaching on capillary loops and occasionally compressing the capillary lumina. Surrounding glomerular capillary walls may display mild thickening and subtle fragmentation of the basement membrane. The peripheral cortex and interstitium show variable inflammatory cells and sclerosis consistent with chronic injury. Overall, the architecture is distorted by nodular sclerosis with a waxy, hyaline appearance within mesangial areas. The pattern is highly suggestive of diabetic nephropathy with nodular (Kimmelstiel-Wilson) glomerulosclerosis; differential includes focal segmental glomerulosclerosis, amyloidosis, and hypertensive nephrosclerosis. Clinically, such findings correlate with long-standing hyperglycemia, progressive proteinuria, and declining glomerular filtration rate. Immunofluorescence would typically be non-specific for this lesion, while electron microscopy would show thickened basement membranes and mesangial expansion. This image is valuable for educational illustration of diabetic renal pathology and differential diagnosis in nephrology.
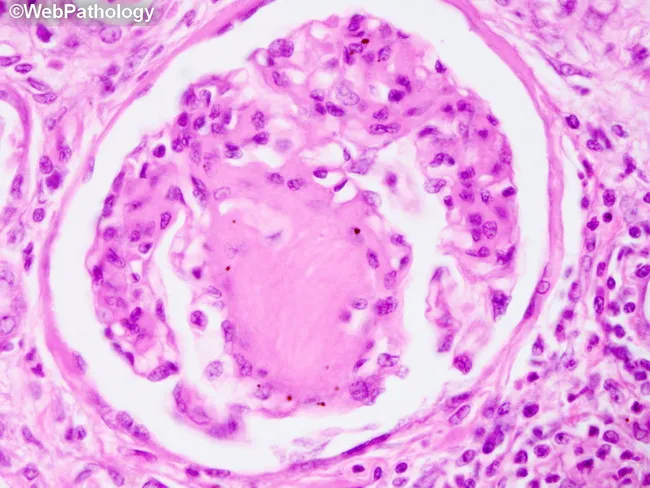
This renal histopathology image depicts nodular glomerulosclerosis, the hallmark Kimmelstiel-Wilson lesion of diabetic nephropathy. In this glomerulus, discrete round to oval nodules of eosinophilic mesangial matrix anchor the periphery of the tuft, creating a laminated, nodular architecture that expands the mesangial compartment and distorts capillary loops. The nodules are acellular or hypocellular and are readily identified with standard stains: Periodic acid–Schiff (PAS) staining yields strong positivity of the nodular deposits; silver staining (Jones silver) highlights mesangial matrix and basement membrane components; Congo red is negative, excluding amyloid; Masson trichrome stain characteristically colors the nodules blue, reflecting fibrous mesangial expansion. The surrounding capillary loops may remain patent or become markedly dilated, and disruption of the capillary-mesangial interface can predispose to capillary microaneurysm formation. This pattern results from increased synthesis and decreased degradation of mesangial matrix proteins with prolonged hyperglycemia (often >15 years) and is strongly associated with diabetic nephropathy progression. While KW nodules are characteristic, similar nodular deposits may be seen in light chain deposition disease, amyloidosis, hypertensive nephrosclerosis, or history of smoking without diabetes. Clinically, presence of KW nodular glomerulosclerosis correlates with proteinuria, reduced GFR, and prognosis of diabetic kidney disease, guiding therapeutic decisions including glycemic control, renin-angiotensin system blockade, and cardiovascular risk management.
diabetic nephropathy GBM thickening electron microscopy renal biopsy
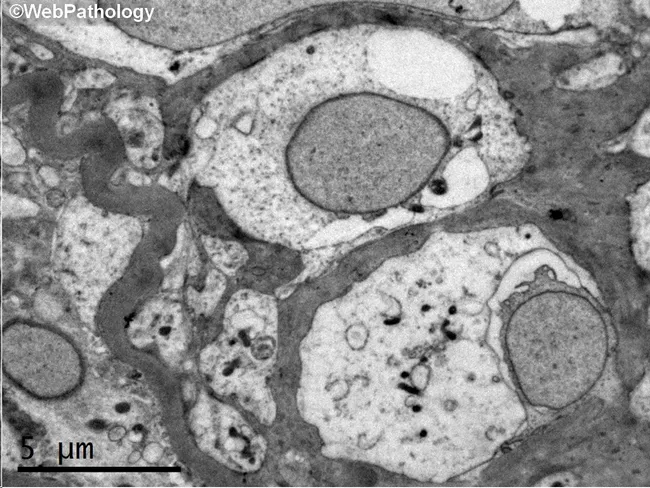
This Transmission Electron Microscopy (TEM) image of a renal glomerulus demonstrates diffuse thickening of the glomerular basement membrane (GBM), an ultrastructural hallmark of diabetic nephropathy. The sample is a renal biopsy from a patient with type 1 diabetes mellitus, illustrating early intraglomerular microangiopathy within approximately two years of disease onset. In TEM, the GBM appears markedly thickened, with increased electron density and reduced capillary luminal space; podocyte foot processes may show effacement, though not clearly identifiable in this static field. The specimen is oriented in the glomerular capillary loops within the renal cortex; scale bar indicates 5 μm, reflecting ultrastructural resolution. Clinically, GBM thickening correlates with progression to overt proteinuria and chronic kidney disease; however, nodular sclerosis (Kimmelstiel-Wilson lesions) and overt glomerulosclerosis develop later. This image underscores the value of electron microscopy for early detection of diabetic microangiopathy when light microscopy may be less sensitive. Diagnostic significance lies in confirming diabetic nephropathy in the appropriate clinical context, differentiating from other glomerulopathies where GBM thickening may occur, such as membranous nephropathy or hypertensive nephrosclerosis. Potential uses include educational illustration of early diabetic kidney disease, research into ultrastructural changes in diabetes, and aiding pathology concordance with clinical diabetes management and nephrology planning.
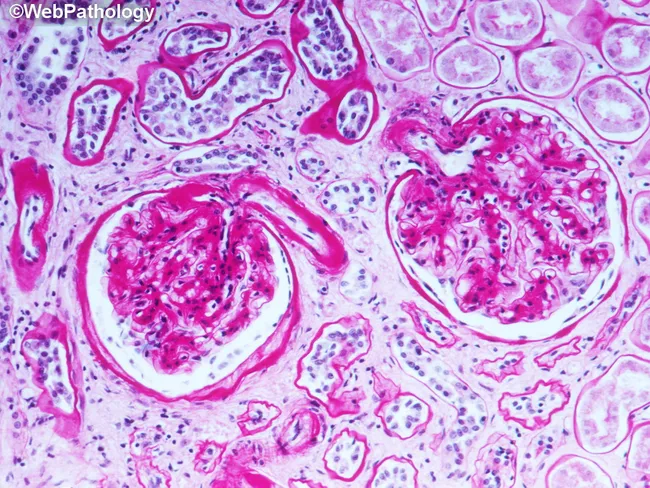
High-resolution light microscopic image of a Periodic acid–Schiff (PAS) stained renal biopsy section illustrating diabetic nephropathy microangiopathy. The specimen is renal cortex containing glomeruli with thickened glomerular basement membranes (GBM) and widened mesangial matrix. PAS positivity highlights hyaline material deposited in the glomerular capillary walls, Bowman’s capsule, and both afferent and efferent arterioles. The mesangial matrix shows expansion with increased PAS-stainable material; Bowman’s space remains patent but encroached by hyaline deposits. The overall pattern is consistent with early diabetic glomerulosclerosis, sometimes termed nodular sclerosis potential, though nodules are not clearly shown in this field. The image emphasizes microangiopathy changes associated with type 1 diabetes mellitus, which can appear within two years of onset and contribute to progressive proteinuria and renal impairment. The described glycosylated protein accumulation, decreased proteolysis, and trapped plasma proteins describe factors promoting PAS-positive deposition. Electron microscopy would better demonstrate GBM thickening, but the light micrograph suffices to identify diagnostic context. Clinically, these features underlie diabetic nephropathy and are used to stage renal involvement, guide glycemic and blood pressure control, and predict progression to overt nephropathy. In educational use, this image aids recognition of PAS-positive hyaline deposition in glomeruli, arterioles, and tubulointerstitial compartments for pathology students and clinicians.
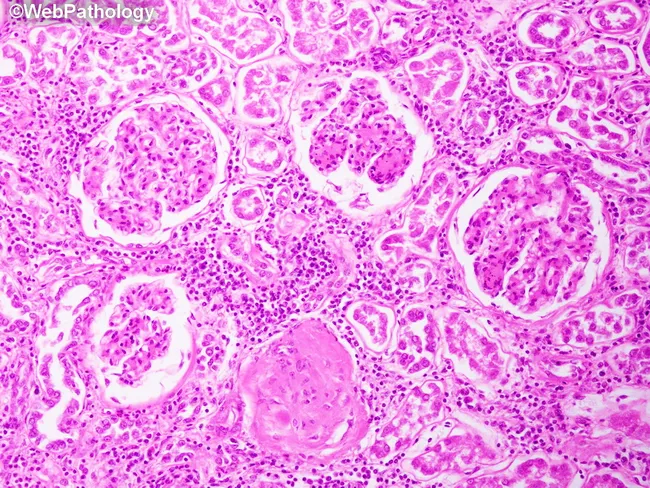
This is a light microscopy image of a renal biopsy from a patient with diabetes mellitus, stained with Hematoxylin and Eosin, viewed at high magnification (approximately 400x). The section comprises renal cortex with multiple glomeruli. Hallmarks of diabetic nephropathy are present: increased mesangial matrix with mesangial expansion surrounding capillary tufts, and one glomerulus showing global sclerosis consistent with advanced disease. The glomerular basement membranes appear thickened in the affected areas (as described in classic diabetic changes), though the image primarily highlights mesangial and sclerotic changes. Interstitium displays a chronic inflammatory infiltrate, indicating tubulointerstitial involvement associated with long-standing diabetes. Collectively these features reflect the triad of diabetic microvascular injury: mesangial expansion, GBM thickening, and arteriolar hyalinosis, contributing to progressive glomerulosclerosis and renal impairment. The observed pathology confirms diabetic glomerulopathy and provides diagnostic significance in evaluating proteinuria, decreased glomerular filtration, and CKD risk. In clinical practice, such histology supports staging of DN, guides management aimed at optimizing glycemic control, reducing hypertension, and preventing further renal decline. This image serves educational purposes for understanding pathophysiology of diabetic nephropathy, correlating morphological lesions with clinical severity, and illustrating typical glomerular sclerosis and interstitial inflammatory response in advanced disease.