
Kidney full detail
kidney anatomy nephron diagram cross section
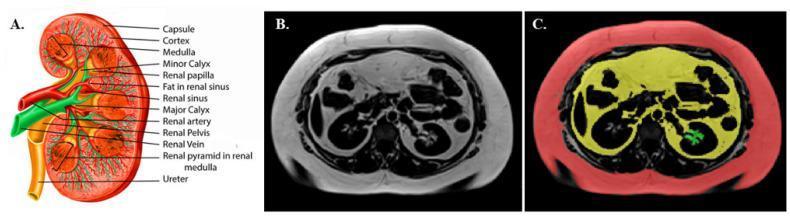
This composite educational image illustrates renal anatomy and abdominal fat segmentation. Panel A is an anatomical diagram of a human kidney in cross-section, detailing the outer renal capsule, cortex, and inner medulla containing renal pyramids and papillae. The collecting system is shown with minor and major calyces, the renal pelvis, and the ureter, alongside the renal artery and vein. Panels B and C demonstrate diagnostic imaging of the abdomen. Panel B is a transverse MRI slice at the level of the kidneys showing standard grayscale tissue contrast. Panel C displays the same MRI slice with manual color-coded segmentation for body composition analysis: red highlights subcutaneous adipose tissue (SAT), yellow denotes visceral adipose tissue (VAT), and green identifies renal sinus fat (RSF) localized within the medial aspect of the kidney. This visual comparison integrates gross anatomy with clinical imaging techniques used to quantify ectopic fat depots and their metabolic implications.
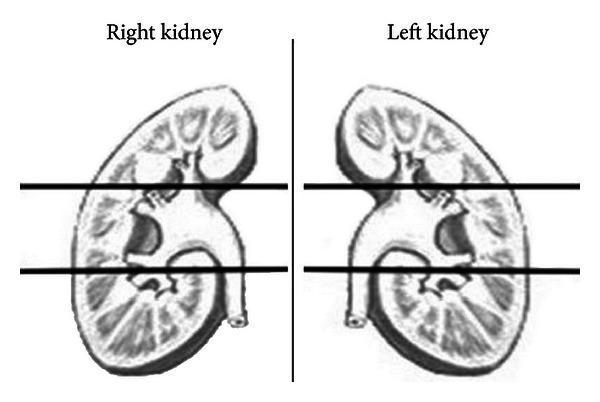
This anatomical diagram illustrates a coronal cross-section of both the right and left kidneys, designed to demonstrate the standardized protocol for evaluating renal function using DMSA scintigraphy. The image shows the internal macrostructure of each kidney, including the renal cortex, medulla with renal pyramids, and the renal pelvis leading to the proximal ureters. A vertical line separates the two organs. Crucially, the diagram features two horizontal black lines intersecting both kidneys to delineate three distinct functional zones or 'paired poles': the upper pole, the middle pole, and the lower pole. This schematic representation is used clinically to facilitate the comparative analysis of regional tracer uptake, allowing for a quantitative assessment of differential renal function across specific anatomical segments. The visual format is tailored for educational purposes in nuclear medicine and urology, particularly for understanding post-surgical evaluations like those following percutaneous nephrolithotomy (PCNL).
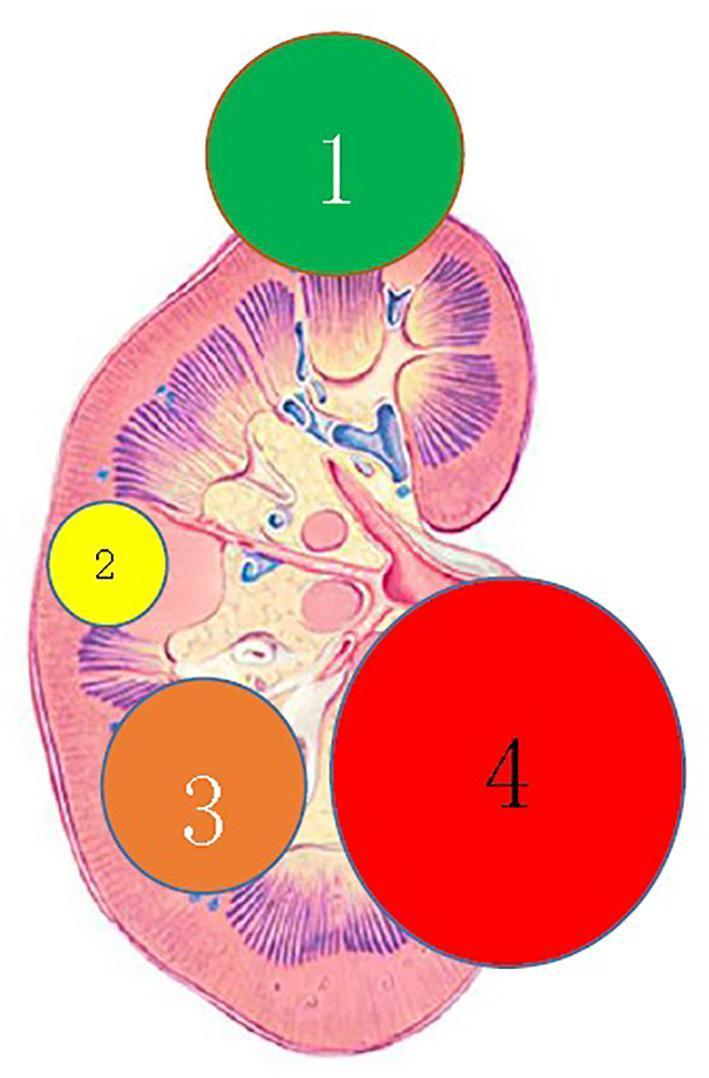
Anatomical diagram of a human kidney in cross-section illustrating a clinical classification system for complex renal cystic lesions based on their spatial location. The diagram uses four color-coded and numbered circles to represent different lesion types: 1) Extra-renal type (green circle), located at the superior pole and protruding significantly beyond the outer renal parenchyma surface; 2) Centrally located type (yellow circle), situated laterally within the renal parenchyma without external protrusion; 3) Renal sinus type (orange circle), located inferiorly within the parenchyma and extending toward the inner collecting system; and 4) Renal hilum type (red circle), shown as the largest lesion located medially at the renal hilum, adjacent to the renal vessels and pelvis. The underlying illustration depicts the renal cortex, medulla, pyramids, calyces, and renal pelvis, providing anatomical context for surgical planning and radiological assessment. This diagram is designed for medical training in urology and radiology to standardize the nomenclature of renal cysts relative to the kidney's structural landmarks.
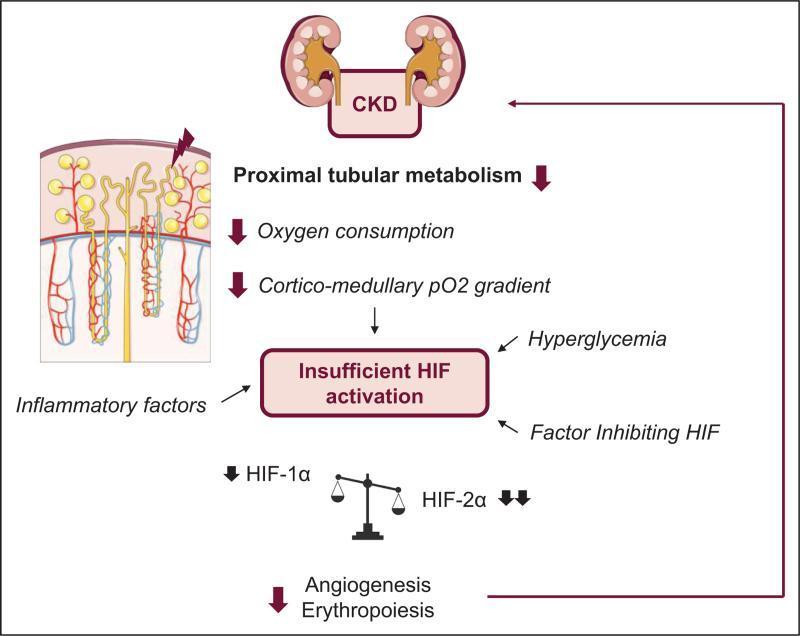
A pathophysiology diagram illustrating the proposed mechanism for insufficient Hypoxia-Inducible Factor (HIF) activation in the context of Chronic Kidney Disease (CKD). At the top, a graphic depicts bilateral kidneys labeled 'CKD'. Below this, a vertical pathway demonstrates how altered renal physiology—specifically decreased proximal tubular metabolism, reduced oxygen consumption, and a diminished cortico-medullary pO2 gradient—leads to the central node of 'Insufficient HIF activation'. This central node is further influenced by external contributors including inflammatory factors (represented by an anatomical nephron cross-section), hyperglycemia, and the presence of 'Factor Inhibiting HIF' (FIH). Beneath the central activation node, a balance scale compares HIF-1α and HIF-2α levels, showing a relative decrease in both subunits, with HIF-2α notably more reduced. The pathway terminates at the bottom, indicating that suppressed HIF signaling results in downregulated angiogenesis and erythropoiesis, contributing to the clinical progression of renal disease.
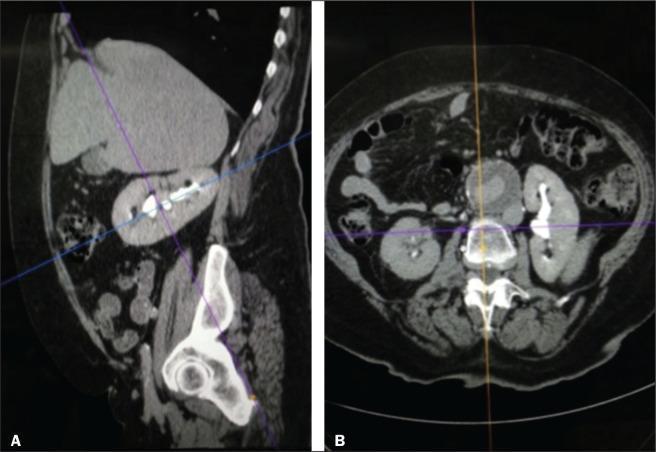
This medical image displays contrast-enhanced computerized tomography (CT) reconstructions of the kidney in two planes: sagittal (A) and axial (B). View A shows a sagittal reconstruction aligned with the renal longitudinal axis, illustrating the bean-shaped profile of the kidney and the natural rotation of the organ relative to the vertical spinal axis. In this view, the upper pole is positioned more medially and posteriorly than the lower pole. The renal parenchyma and hyperdense contrast-filled collecting system are visible. View B shows an axial cross-section of the abdomen, demonstrating the bilateral renal anatomy, the renal cortex, and the collecting system in relation to the vertebral body and abdominal aorta. These reconstructions are used in clinical practice to accurately define renal anatomy for nephrometry scoring systems (such as RENAL or PADUA), which assist in preoperative planning for nephron-sparing surgery. The alignment highlights the importance of using the renal axis rather than the spinal axis for precise anatomical localization of renal masses.
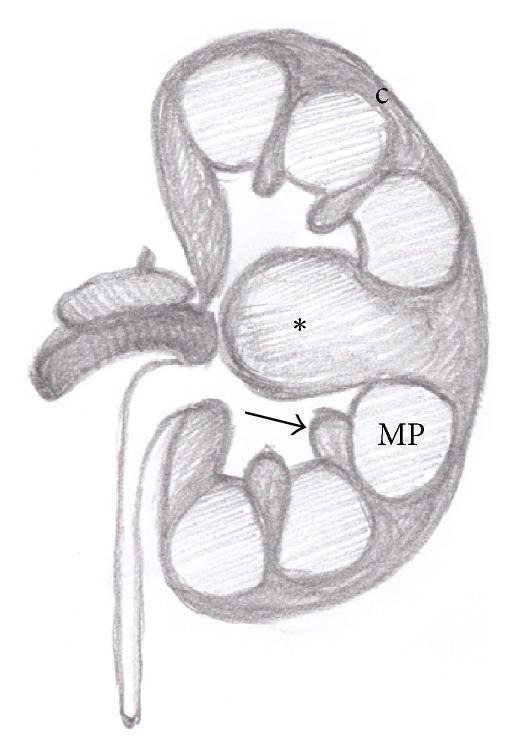
This medical illustration is an anatomical diagram of a longitudinal cross-section of a human kidney, specifically demonstrating a common anatomical variant known as a hypertrophied column of Bertin. The diagram highlights several key structures: the outer renal cortex (labeled 'c'), multiple medullary pyramids (labeled 'MP'), and the renal columns located between these pyramids. A black arrow points to a normal-sized renal column, providing a baseline for comparison. In contrast, an asterisk (*) marks a hypertrophied column of Bertin, which appears as a significant, mass-like enlargement of cortical tissue extending deeply between the medullary pyramids. The illustration serves as an educational tool for distinguishing this benign pseudotumor from infiltrative solid renal lesions by showing its continuous nature with the surrounding cortex. The diagram also depicts the renal hilum, showing the entry/exit points for the renal vasculature and the proximal ureter.
nephron structure glomerulus tubule filtration
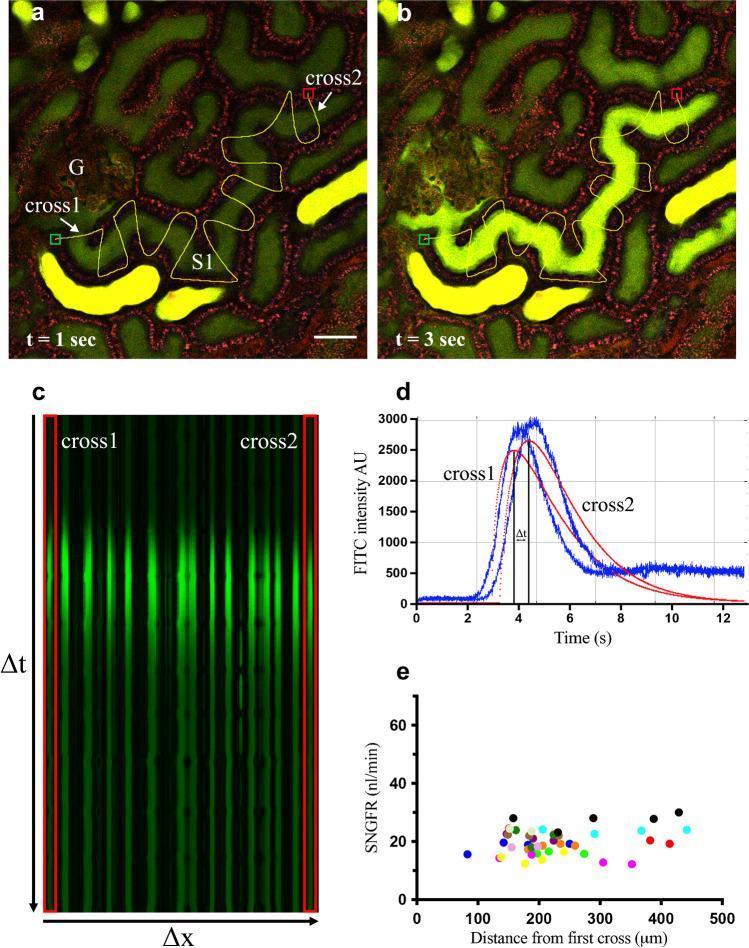
This composite educational image illustrates the 'linescan method' for in vivo measurement of single-nephron glomerular filtration rate (SNGFR). Panels (a) and (b) are multiphoton microscopy (MPM) frames showing the filtration of a green fluorescent dye (FITC-dextran, 3–5 kDa) from a glomerulus (G) into the early proximal tubule (S1) at t=1 second and t=3 seconds. The image demonstrates the temporal progression of the fluorescent bolus along the tubular lumen. Panel (c) displays the resulting x–t (space-time) linescan plot, where vertical green lines represent the dye crossing hand-drawn perpendicular paths (cross1 and cross2). The downward shift of peak fluorescence intensity along the y-axis (time) indicates the velocity of fluid movement. Panel (d) shows quantitative fluorescence intensity curves over time for two selected crossings, used to calculate the time delay (ΔT) between peak bolus concentrations. Panel (e) is a scatter plot validating the consistency of SNGFR measurements (nl/min) across varying distances from the glomerulus, demonstrating the method's precision in assessing renal physiology and filtration dynamics.
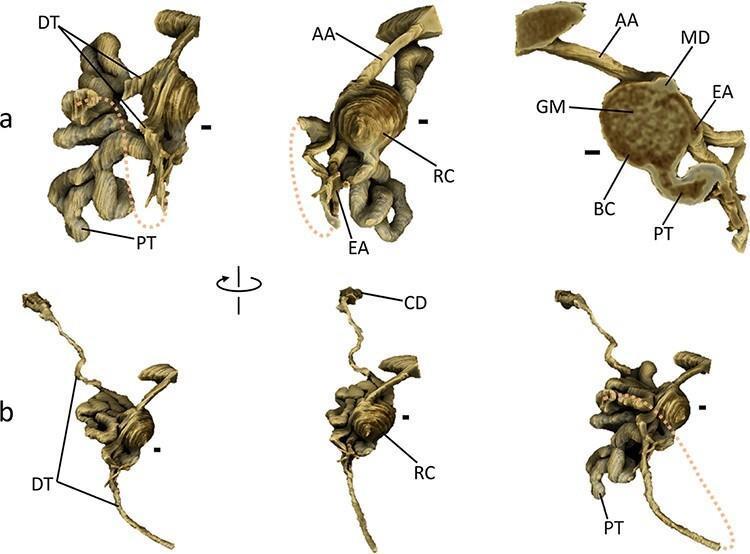
Anatomical diagram featuring high-resolution 3D renderings of a single mouse nephron, highlighting renal microstructure and spatial arrangement. Panel (a) provides detailed views of the renal corpuscle (RC), demonstrating the spherical Bowman's capsule (BC) and internal glomerulus (GM). It clearly illustrates the vascular pole with the afferent arteriole (AA), efferent arteriole (EA), and the macula densa (MD) of the distal tubule (DT) forming a v-shaped contact point. The tubular pole shows the exit of the highly convoluted proximal tubule (PT). Panel (b) illustrates the longitudinal progression from the renal corpuscle through the PT and DT to the collecting duct (CD). The rendering distinguishes between the intensely convoluted segments near the corpuscle and the straighter distal segments of the tubules. Key educational concepts include the juxtaglomerular apparatus anatomy, the morphology of glomerular filtration components, and the physical relationship between various segments of the nephron and their associated vasculature, essential for understanding renal physiology and pathology.
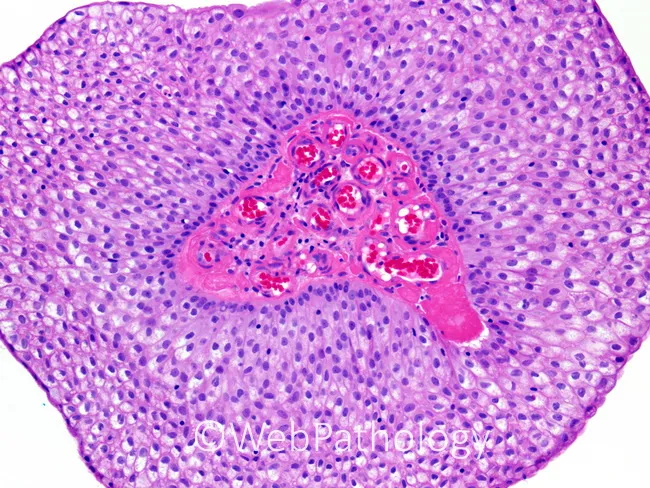
This is a brightfield light microscopy histology image of a renal cortex region, captured after standard hematoxylin and eosin staining. The primary subject is a renal glomerulus embedded in renal cortex, with Bowman's capsule and adjacent proximal/distal tubules visible in the peripheral parenchyma. The glomerular tuft consists of a dense network of capillary loops; erythrocytes appear as circular red cells within the capillary lumina, giving a pink-reddish core. The surrounding mesangial cells and basement membranes are discernible as pink-stained stroma, with purple-nuclei of endothelial and parietal epithelial cells. The tubules exhibit cuboidal epithelium with basophilic nuclei and clear luminal spaces. Overall architecture demonstrates typical renal cortical histology: a lobulated arrangement of tubules around a central tuft, with intact Bowman's capsule juxtaposed to the capillary network. There is no conspicuous sclerosis, crescents, or inflammatory infiltrates; no overt tubular atrophy or interstitial fibrosis evident. This image represents normal renal histology suitable for educational purposes and serves as a reference for pattern recognition. Clinically, it aids in teaching glomerular structure, filtration barrier components (endothelium, basement membrane, podocytes), and nephron organization. Potential use cases include medical education, comparative pathology, and radiology-pathology correlation studies for nephrology and urology training.
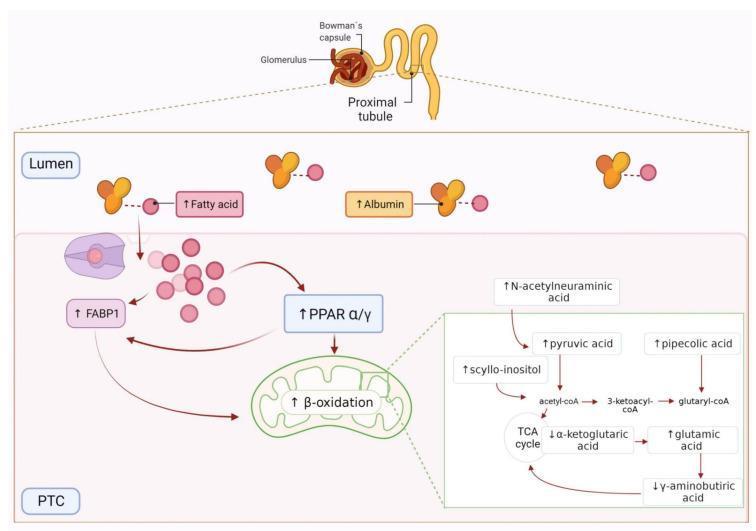
This medical illustration depicts the pathophysiology of fatty acid oxidation (FAO) in renal proximal tubular cells (PTCs). The top panel shows a nephron diagram highlighting the glomerulus, Bowman’s capsule, and proximal tubule. The main panel illustrates the transition from the tubular lumen to the PTC. In the lumen, increased albumin-bound fatty acids are shown entering the PTC via FABP1 (Fatty Acid Binding Protein 1). Intracellularly, there is an upregulation of PPAR ̑/̳, leading to increased mitochondrial ̒-oxidation. A detailed metabolic map within the mitochondrial compartment shows altered metabolite abundance associated with early renal damage. Specifically, it displays increased levels of N-acetylneuraminic acid, scyllo-inositol, pyruvic acid, pipecolic acid, and glutamic acid. Conversely, it shows decreased levels of ̑-ketoglutaric acid and ̳-aminobutyric acid (GABA). These changes are linked to the TCA cycle and acetyl-CoA production. This diagram serves as an educational tool for understanding metabolic reprogramming and cardiorenal risk in the context of normoalbuminuric hypertension.
glomerular filtration barrier podocytes basement membrane endothelium
This is a brightfield light microscopy histology image of a renal cortex region, captured after standard hematoxylin and eosin staining. The primary subject is a renal glomerulus embedded in renal cortex, with Bowman's capsule and adjacent proximal/distal tubules visible in the peripheral parenchyma. The glomerular tuft consists of a dense network of capillary loops; erythrocytes appear as circular red cells within the capillary lumina, giving a pink-reddish core. The surrounding mesangial cells and basement membranes are discernible as pink-stained stroma, with purple-nuclei of endothelial and parietal epithelial cells. The tubules exhibit cuboidal epithelium with basophilic nuclei and clear luminal spaces. Overall architecture demonstrates typical renal cortical histology: a lobulated arrangement of tubules around a central tuft, with intact Bowman's capsule juxtaposed to the capillary network. There is no conspicuous sclerosis, crescents, or inflammatory infiltrates; no overt tubular atrophy or interstitial fibrosis evident. This image represents normal renal histology suitable for educational purposes and serves as a reference for pattern recognition. Clinically, it aids in teaching glomerular structure, filtration barrier components (endothelium, basement membrane, podocytes), and nephron organization. Potential use cases include medical education, comparative pathology, and radiology-pathology correlation studies for nephrology and urology training.
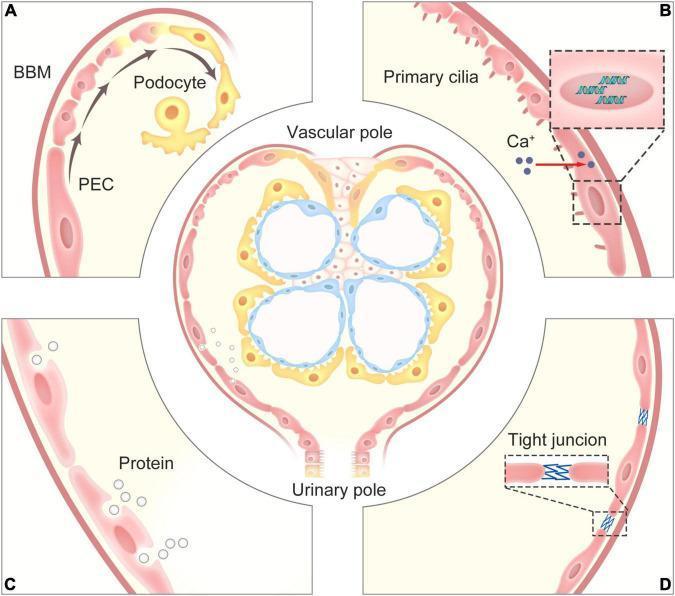
This medical illustration depicts the anatomical structure and physiological functions of Parietal Epithelial Cells (PECs) within the renal Bowman's capsule. A central diagram shows a cross-section of a glomerulus, identifying the vascular pole, urinary pole, and the Bowman’s basement membrane (BBM). Surrounding this are four detailed panels (A-D) highlighting specific cellular mechanisms. Panel A illustrates the progenitor role of PECs, showing their proliferation and differentiation into podocytes within the glomerular tuft. Panel B demonstrates mechanosensation, where primary cilia on PECs detect filtrate flow, triggering intracellular calcium (Ca+) influx and gene expression changes. Panel C shows protein uptake via endocytosis during glomerular ultrafiltrate overload. Panel D highlights the barrier function, showing tight junctions between PECs that prevent protein leakage into the extraglomerular space. The diagram serves as an educational tool for renal physiology and pathophysiology, focusing on the role of the glomerular filtration barrier and the dynamic contributions of the parietal epithelium to kidney homeostasis and repair.
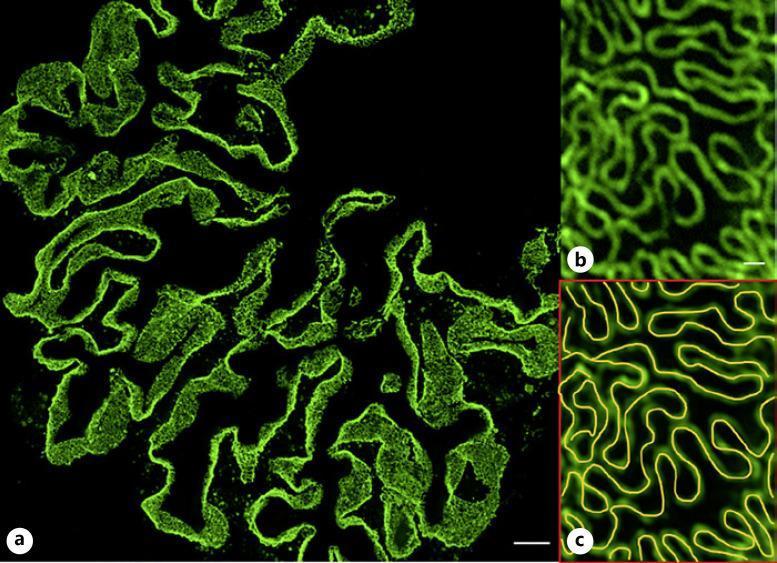
This diagnostic image displays a super-resolved immunofluorescence micrograph of a glomerular cross-section, demonstrating the renal filtration barrier's ultrastructure. Panel (a) shows an overview of the entire glomerulus where capillary loops are outlined by nephrin staining, a critical protein located in the diaphragm of podocyte filtration slits. Panel (b) provides a high-magnification view, resolving the interdigitating morphology of individual podocyte foot processes as bright green, curvilinear patterns. Panel (c) illustrates the application of the Podocyte Exact Morphology Measurement Procedure (PEMP) algorithm, which traces these filtration slits with yellow lines to calculate the filtration slit density (FSD). This quantitative morphometric analysis is used to objectively evaluate foot process effacement in various glomerulopathies. The visualization highlights the intricate relationship between podocyte anatomy and glomerular filtration function, transitioning from low-power architectural orientation to high-resolution quantification of the glomerular basement membrane's epithelial covering. Scale bars: 10 μm (overview), 200 nm (magnification).
The Kidney - Full Detail
1. Overview and Functions
- Filtration - removing metabolic products, toxins, and waste from the blood via urine
- Homeostasis - regulating fluid status, electrolyte balance, and acid-base balance
- Endocrine - producing/activating hormones: erythropoietin (EPO), renin, and calcitriol (active vitamin D)
- Medical Physiology (Boron & Boulpaep), p. 719
2. Gross Anatomy
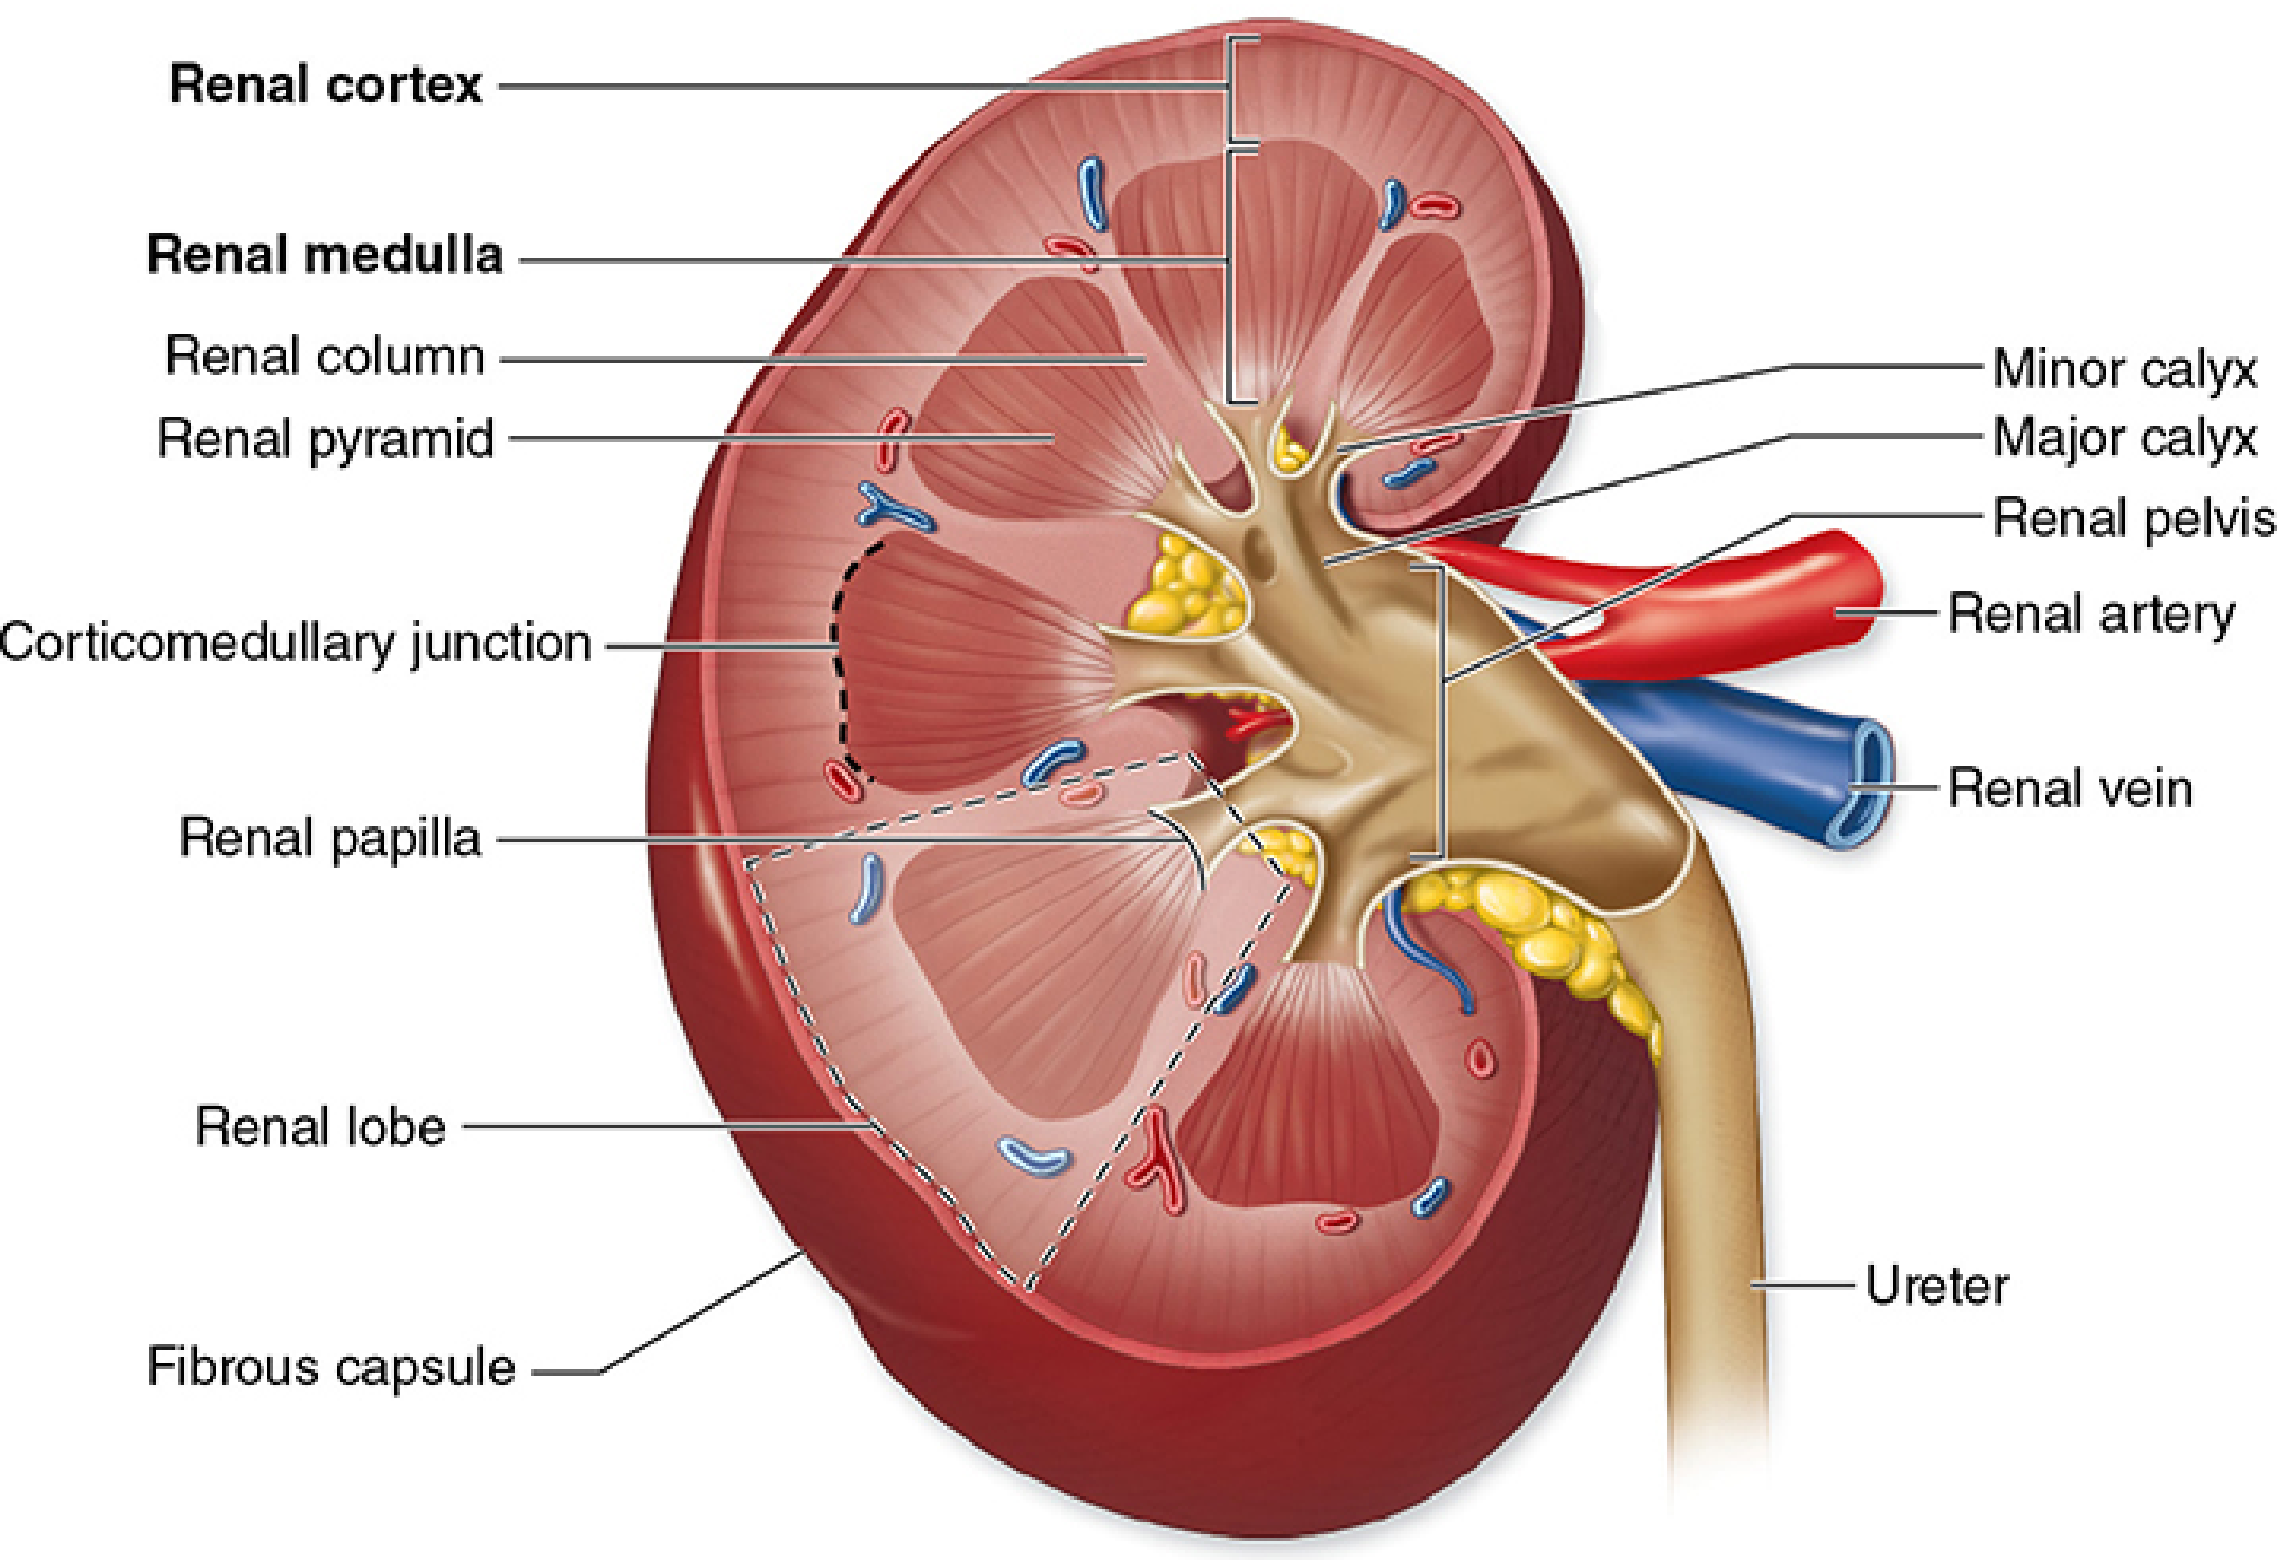
- Paired, retroperitoneal organs located between vertebrae T12 and L3
- Right kidney sits slightly lower than the left (due to the liver)
- Size: ~11-12 cm long, 5.0-7.5 cm wide, 2.5-3.0 cm thick
- Weight: 125-170 g (males), 115-155 g (females)
- Mean volumes by MRI: ~202 mL (men), ~154 mL (women)
- Paranephric (pararenal) fat - posterior and posterolateral fat
- Renal (Gerota's) fascia - encloses kidney and adrenal gland
- Perinephric fat - fills the space between capsule and fascia
- Fibrous capsule - thin tough layer directly covering the kidney (easily removable in health)
- Medial concave surface
- Entry for: renal artery, nerves
- Exit for: renal vein, lymphatics, ureter
- Leads internally to the renal sinus (filled with perinephric fat, calyces, and vessels)
| Zone | Description |
|---|---|
| Renal cortex | Outer ~1 cm; granular appearance due to glomeruli and convoluted tubules; continuous band surrounding medulla |
| Renal medulla | Inner darker region; composed of 8-18 renal pyramids; parallel tubules and vessels |
| Renal columns (of Bertin) | Cortical extensions projecting between pyramids |
| Renal pyramids | Conical; base at corticomedullary junction, apex (papilla) points inward |
| Renal papilla | Apex of pyramid; opens into minor calyx at the area cribrosa |
| Minor calyces | Cup around each papilla; collect urine |
| Major calyces | 2-3 minor calyces unite to form each |
| Renal pelvis | Funnel-shaped expansion of upper ureter; formed by 2-3 major calyces |
- Brenner and Rector's The Kidney, 2-Volume Set; Gray's Anatomy for Students
3. The Nephron - Functional Unit
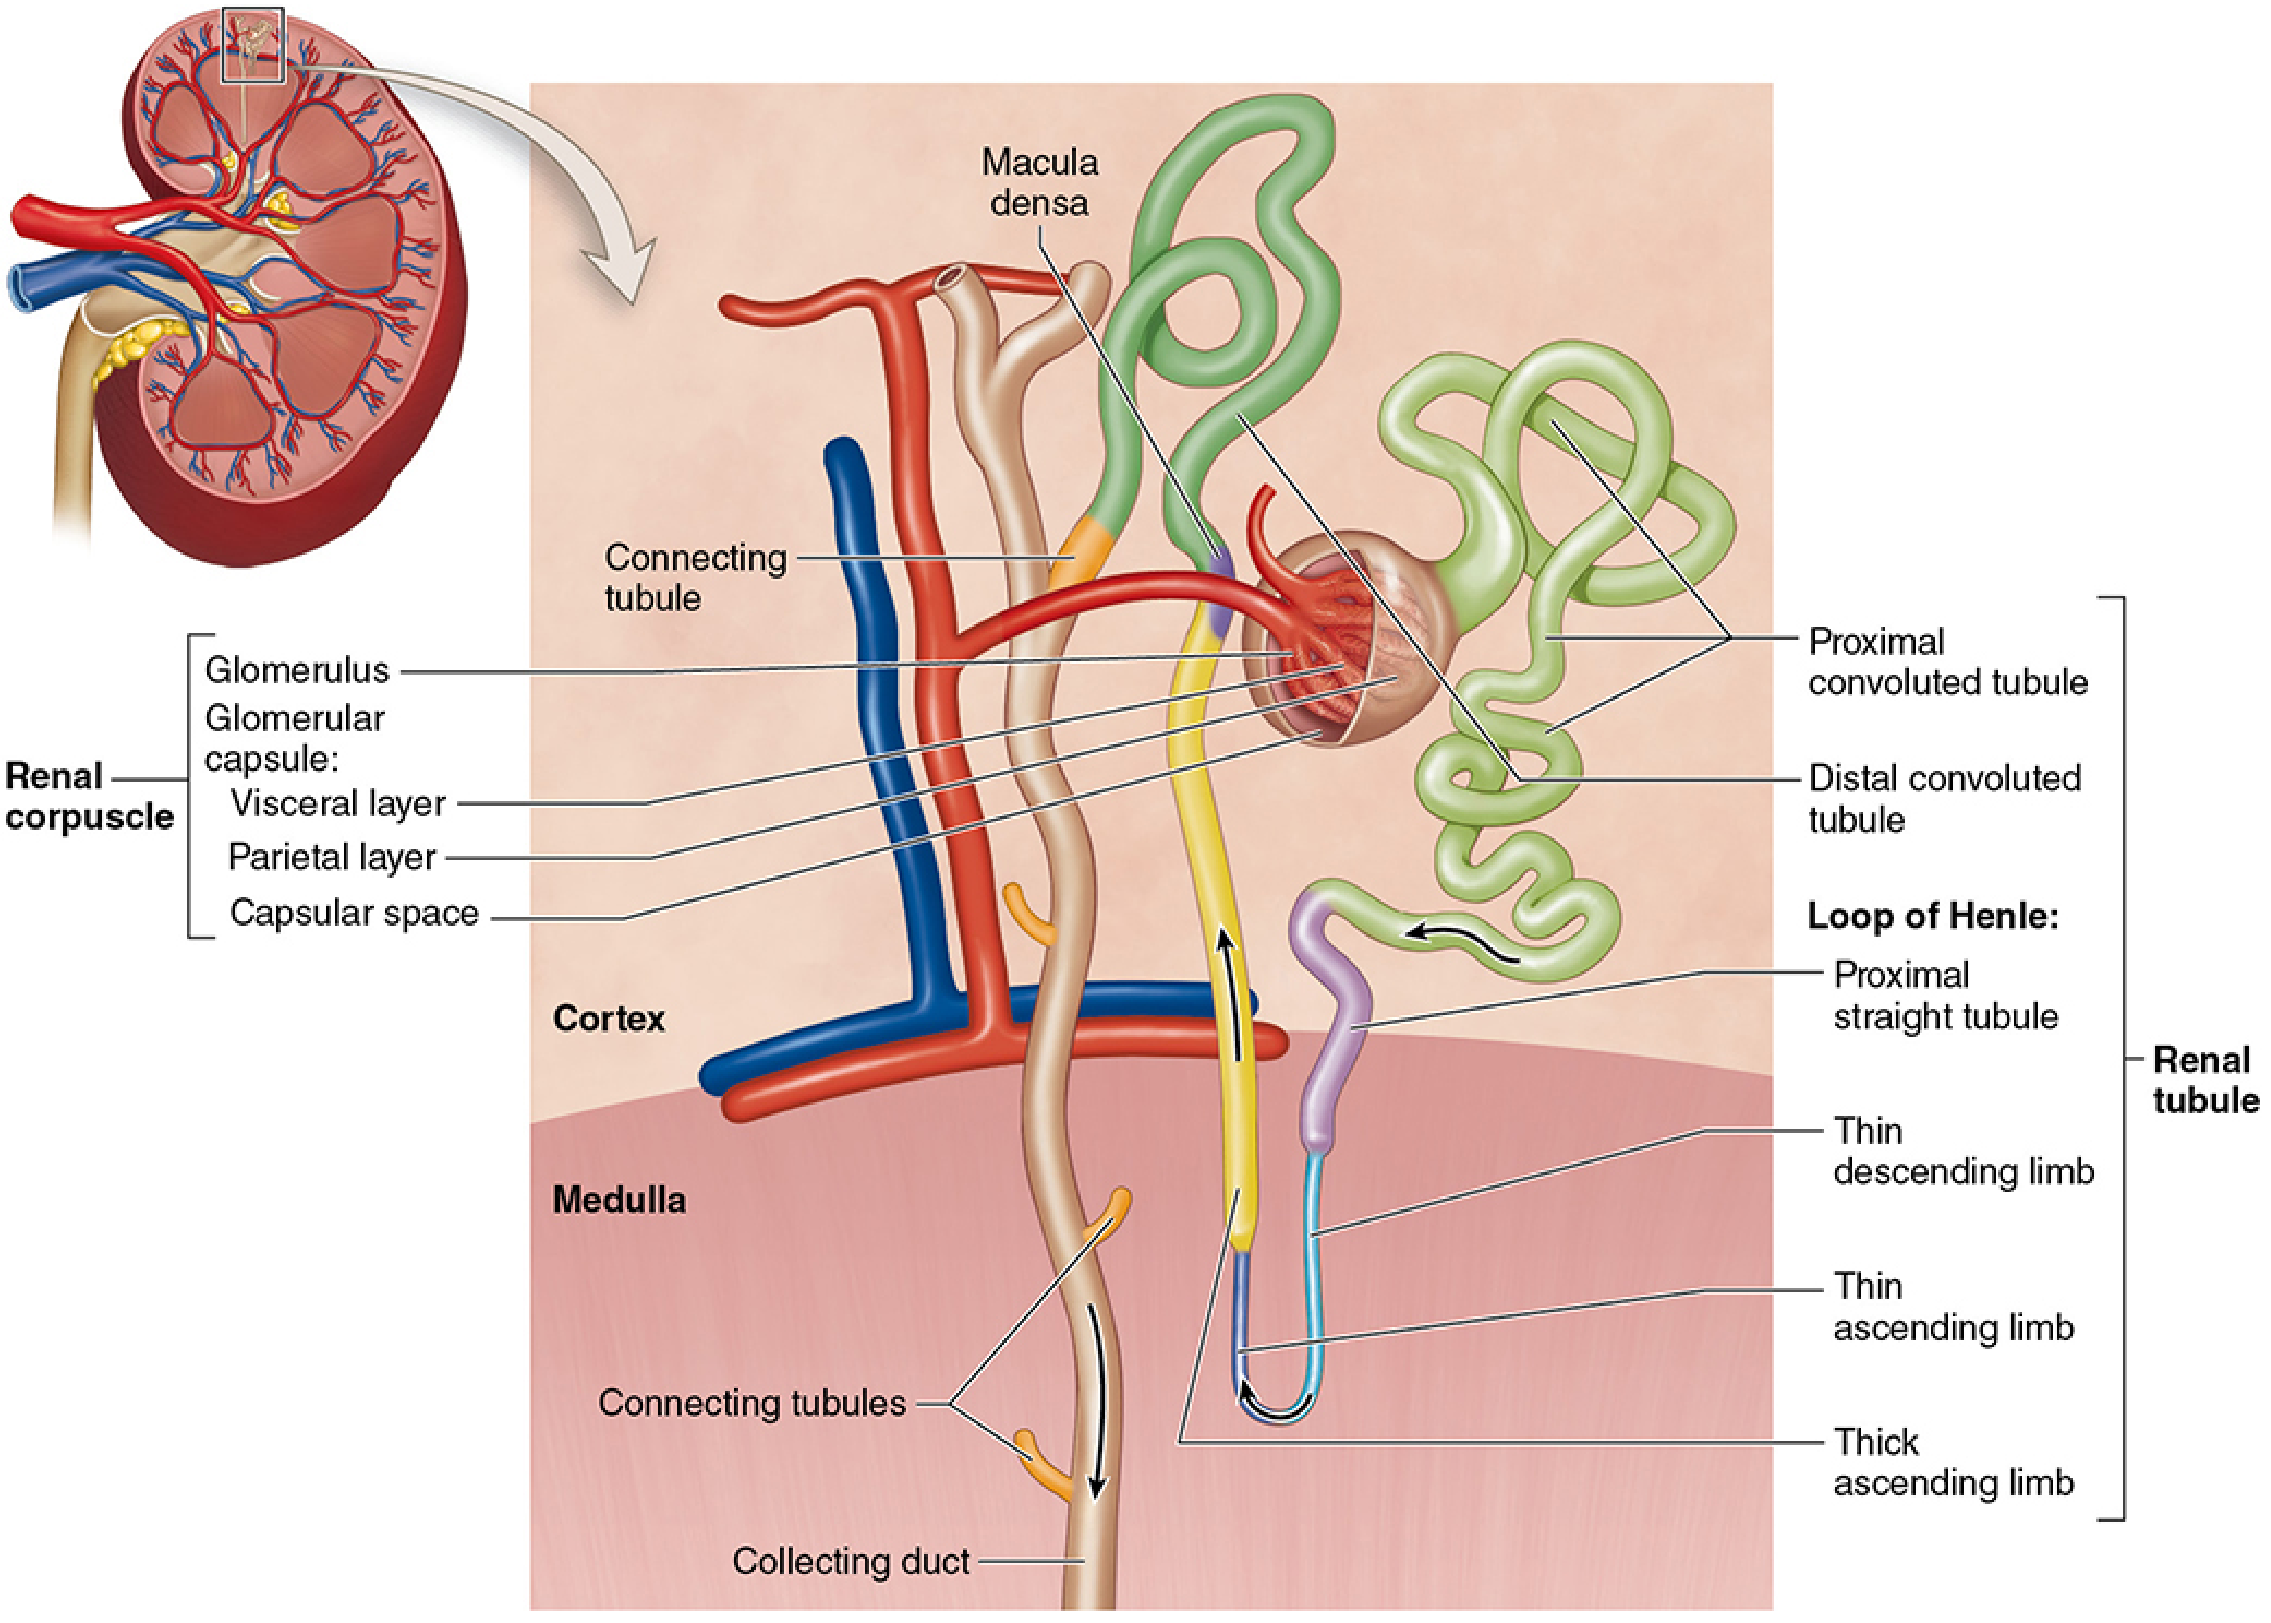
3a. Renal Corpuscle (always in cortex)
- Glomerulus: tuft of capillary loops; site of ultrafiltration
- Bowman's capsule: surrounds the glomerulus
- Visceral layer (podocytes) - closely adheres to capillaries
- Parietal layer - outer epithelial wall
- Capsular (Bowman's) space - between the two layers; receives filtrate
3b. Renal Tubule Segments (in order of fluid flow)
| Segment | Location | Key Function |
|---|---|---|
| Proximal Convoluted Tubule (PCT) | Cortex | Reabsorbs ~65% of filtered Na+, water, glucose, amino acids, HCO3- |
| Proximal Straight Tubule | Outer medulla | Continuation of PCT |
| Thin Descending Limb of Loop of Henle | Medulla | Highly water-permeable; water leaves by osmosis |
| Thin Ascending Limb | Medulla | Impermeable to water; NaCl diffuses out |
| Thick Ascending Limb (TAL) | Medulla/Cortex | Active NaCl reabsorption via NKCC2; impermeable to water (diluting segment) |
| Macula Densa | Junction with afferent arteriole | Chemoreceptors for NaCl; part of juxtaglomerular apparatus |
| Distal Convoluted Tubule (DCT) | Cortex | Na+/Cl- reabsorption via NCC transporter; PTH-regulated Ca2+ reabsorption |
| Connecting Tubule | Cortex | Short segment; links nephron to collecting duct |
| Cortical Collecting Tubule | Cortex | Aldosterone-regulated Na+ reabsorption, K+ secretion |
| Collecting Duct | Cortex → Medulla | ADH-regulated water reabsorption; final urine concentration |
-
Cortical nephrons (~85%): short loop of Henle; mostly in cortex
-
Juxtamedullary nephrons (~15%): long loop extending deep into medulla; critical for concentrating urine
-
Junqueira's Basic Histology, 17e, pp. 949-952
4. The Glomerular Filtration Barrier
Layer 1: Fenestrated Endothelium
- Perforated by thousands of small holes (fenestrae)
- Endothelial proteins carry fixed negative charges - repel anionic plasma proteins
Layer 2: Glomerular Basement Membrane (GBM)
- Meshwork of collagen IV and proteoglycans (laminin, nidogen, agrin)
- Large spaces allow filtration of water and small solutes
- Strongly negatively charged due to proteoglycans (heparan sulfate) - major size and charge barrier
Layer 3: Podocytes (Visceral Epithelium)
- Specialized epithelial cells with long foot-like processes (pedicels) that interdigitate
- Filtration slits between pedicels are bridged by the slit diaphragm (contains nephrin, podocin)
- Mutations in nephrin gene cause absent slit diaphragms → massive proteinuria
Mesangial Cells
- Located between and around glomerular capillaries
- Produce extracellular matrix for structural support
- Have contractile properties (actin/myosin); regulate glomerular surface area
- Phagocytic function
- Guyton and Hall Textbook of Medical Physiology
5. Glomerular Filtration Rate (GFR)
- Normal GFR: ~125 mL/min (180 L/day)
- ~10% lower in women than men
- GFR declines with age (~50% loss from young adulthood to age 70-75)
- Kidneys receive ~20-22% of resting cardiac output despite being <0.5% of body weight
- Filtration fraction = GFR / Renal plasma flow = ~0.2 (20%)
- Of 180 L/day filtered, >99% is reabsorbed; only ~1-1.5 L excreted as urine
-
Glomerular capillary hydrostatic pressure (~60 mmHg) → promotes filtration
-
Bowman's capsule hydrostatic pressure (~18 mmHg) → opposes filtration
-
Glomerular capillary oncotic pressure (~32 mmHg) → opposes filtration
-
Net filtration pressure ≈ 10 mmHg
-
Guyton and Hall Textbook of Medical Physiology, pp. 335-337
6. Renal Blood Supply
- The kidney has two capillary beds in series (unique): glomerular capillaries (high-pressure filtration) and peritubular capillaries (low-pressure reabsorption)
- ~90% of renal blood flow perfuses the cortex; ~10% goes to medulla
- Vasa recta: thin-walled capillaries running parallel to loops of Henle; maintain the medullary osmotic gradient (countercurrent exchange)
- Segmental arteries are end arteries - no collateral circulation; occlusion causes segmental infarction
- Brenner and Rector's The Kidney; Medical Physiology (Boron & Boulpaep)
7. Tubular Reabsorption and Secretion
Proximal Convoluted Tubule (PCT)
- Reabsorbs ~65% of filtered Na+, Cl-, K+, water, HCO3-
- Reabsorbs virtually 100% of glucose and amino acids (via secondary active transport)
- Secretes organic acids (uric acid, drugs, toxins) via OAT transporters
- Brush border (microvilli) greatly increases surface area
- Isosmotic reabsorption (no osmotic gradient established)
Loop of Henle
- Descending limb: water permeable, solute impermeable → fluid becomes hyperosmotic
- Ascending limb: water impermeable, NaCl reabsorbed → fluid becomes hypo-osmotic
- The NKCC2 cotransporter in thick ascending limb is the target of loop diuretics (furosemide)
- Creates the medullary osmotic gradient (up to 1200 mOsm/kg) essential for urine concentration
Distal Convoluted Tubule (DCT)
- NaCl reabsorption via NCC transporter (target of thiazide diuretics)
- PTH increases Ca2+ reabsorption here
- Macula densa monitors NaCl delivery
Collecting Duct
- Principal cells: reabsorb Na+ (via ENaC, stimulated by aldosterone), secrete K+
- Intercalated cells: regulate acid-base (type A secrete H+; type B secrete HCO3-)
- ADH/Vasopressin inserts aquaporin-2 (AQP2) channels → water reabsorption → concentrated urine
Hormonal Control of Tubular Reabsorption
| Hormone | Site of Action | Effect |
|---|---|---|
| Aldosterone | Collecting tubule/duct | ↑ NaCl, H2O, HCO3- reabsorption; ↑ K+ and H+ secretion |
| Angiotensin II | PCT, TAL, DCT, collecting tubule | ↑ NaCl, H2O, HCO3- reabsorption; ↑ H+ secretion |
| ADH (Vasopressin) | DCT/Collecting tubule and duct | ↑ H2O reabsorption (aquaporin insertion) |
| Atrial Natriuretic Peptide (ANP) | DCT/Collecting tubule and duct | ↓ NaCl reabsorption |
| Parathyroid Hormone (PTH) | PCT, TAL, DCT | ↓ PO43- reabsorption; ↑ Ca2+ reabsorption |
- Guyton and Hall Textbook of Medical Physiology, p. 363
8. Juxtaglomerular Apparatus (JGA)
- Macula densa: specialized DCT cells sensing luminal NaCl concentration
- Juxtaglomerular (granular) cells: modified smooth muscle cells in afferent arteriole wall; secrete renin
- Extraglomerular mesangial cells (Lacis cells): between the arterioles
- Tubuloglomerular feedback: ↑ NaCl at macula densa → afferent arteriole constriction → ↓ GFR (autoregulation)
- Renin release: ↓ NaCl delivery, ↓ blood pressure, or sympathetic stimulation → renin secretion → activates RAAS
9. Urine Concentration Mechanism
- Establishes progressively increasing osmolarity from cortex (300 mOsm) to deep medulla (1200 mOsm)
- NaCl pumped out of ascending limb raises medullary interstitial osmolarity
- Urea recycling from collecting duct contributes ~40% of the medullary gradient
- Preserves the medullary gradient by equilibrating solutes as blood flows in and out
- Prevents "washout" of the gradient
10. Acid-Base Regulation
- Bicarbonate reabsorption: nearly all filtered HCO3- reabsorbed (primarily in PCT via H+ secretion + carbonic anhydrase)
- Ammonium (NH4+) excretion: synthesized in PCT from glutamine; critical during chronic acidosis
- Titratable acid excretion: H+ secreted combined with urinary buffers (mainly HPO42-)
- Net acid excretion = NH4+ excretion + titratable acid - HCO3- lost in urine
11. Endocrine Functions
| Hormone | Site of Production | Stimulus | Action |
|---|---|---|---|
| Erythropoietin (EPO) | Peritubular fibroblasts (cortex/outer medulla) | Hypoxia, anemia | Stimulates red blood cell production in bone marrow |
| Renin | JG cells of afferent arteriole | ↓ BP, ↓ Na+, sympathetic stimulation | Cleaves angiotensinogen → angiotensin I → RAAS activation |
| Calcitriol (1,25-(OH)2 Vit D3) | Proximal tubule (1α-hydroxylase) | PTH, hypocalcemia | ↑ intestinal Ca2+/phosphate absorption; bone mineralization |
| Prostaglandins | Medullary interstitial cells | Ischemia, angiotensin II | Vasodilate afferent arterioles; natriuresis |
12. Renal Innervation
- Sympathetic fibers from T10-L1 via the renal plexus accompany renal vessels
- Sympathetic stimulation: ↓ RBF and GFR, ↑ renin release, ↑ tubular Na+ reabsorption
- No significant parasympathetic innervation
13. Lymphatics
- Cortical lymphatics drain into hilar lymph nodes
- Contain high concentrations of renal proteins
- Play a role in immune surveillance and fluid balance
14. Embryological Development
- Pronephros (week 4) - rudimentary, degenerates
- Mesonephros (weeks 4-8) - functions transiently; contributes to male reproductive structures
- Metanephros (week 5 onward) - permanent kidney; develops from:
- Ureteric bud (from mesonephric duct) → ureter, renal pelvis, calyces, collecting ducts
- Metanephric mesoderm (blastema) → nephrons (glomerulus through distal tubule)
15. Key Clinical Correlations
| Condition | Key Feature |
|---|---|
| Chronic Kidney Disease (CKD) | Progressive nephron loss, ↓ GFR, ↑ creatinine; causes anemia (↓ EPO), bone disease (↓ calcitriol), hypertension |
| Acute Kidney Injury (AKI) | Rapid ↓ GFR; prerenal (↓ perfusion), intrinsic (tubular necrosis, glomerulonephritis), postrenal (obstruction) |
| Nephrotic syndrome | Damage to filtration barrier → proteinuria >3.5 g/day, hypoalbuminemia, edema |
| Nephritic syndrome | Glomerular inflammation → hematuria, proteinuria, hypertension, ↓ GFR |
| Polycystic kidney disease | Inherited; multiple fluid-filled cysts from nephron epithelium → renal enlargement and failure |
| Renal calculi | Crystallization of oxalate, urate, struvite, or cystine; obstruct calyces or ureter |
| Renal artery stenosis | ↓ renal perfusion → ↑ renin → renovascular hypertension |
| Diabetic nephropathy | Most common cause of ESRD; glomerular basement membrane thickening, mesangial expansion, Kimmelstiel-Wilson nodules |