
Balanced diet for apm mbbs university exm oriented ans from park text book
Balanced Diet - Park's Textbook of Preventive and Social Medicine
Definition
A balanced diet has become an accepted means to safeguard a population from nutritional deficiencies.
Principles of Constructing a Balanced Diet
| Priority | Nutrient | Proportion of Daily Energy Intake |
|---|---|---|
| (a) First | Protein | 10-15% of daily energy intake |
| (b) Second | Fat | 15-30% of daily energy intake |
| (c) Third | Carbohydrates (rich in natural fibre) | Remaining food energy |
- Micronutrient requirements (vitamins and minerals per RDA Tables) must also be met.
Dietary Guidelines (Exam-Important Points)
Special conditions: Diet should be adapted to the special needs of growth, pregnancy, lactation, physical activity, and medical disorders (e.g., diabetes).
The Food Guide Pyramid
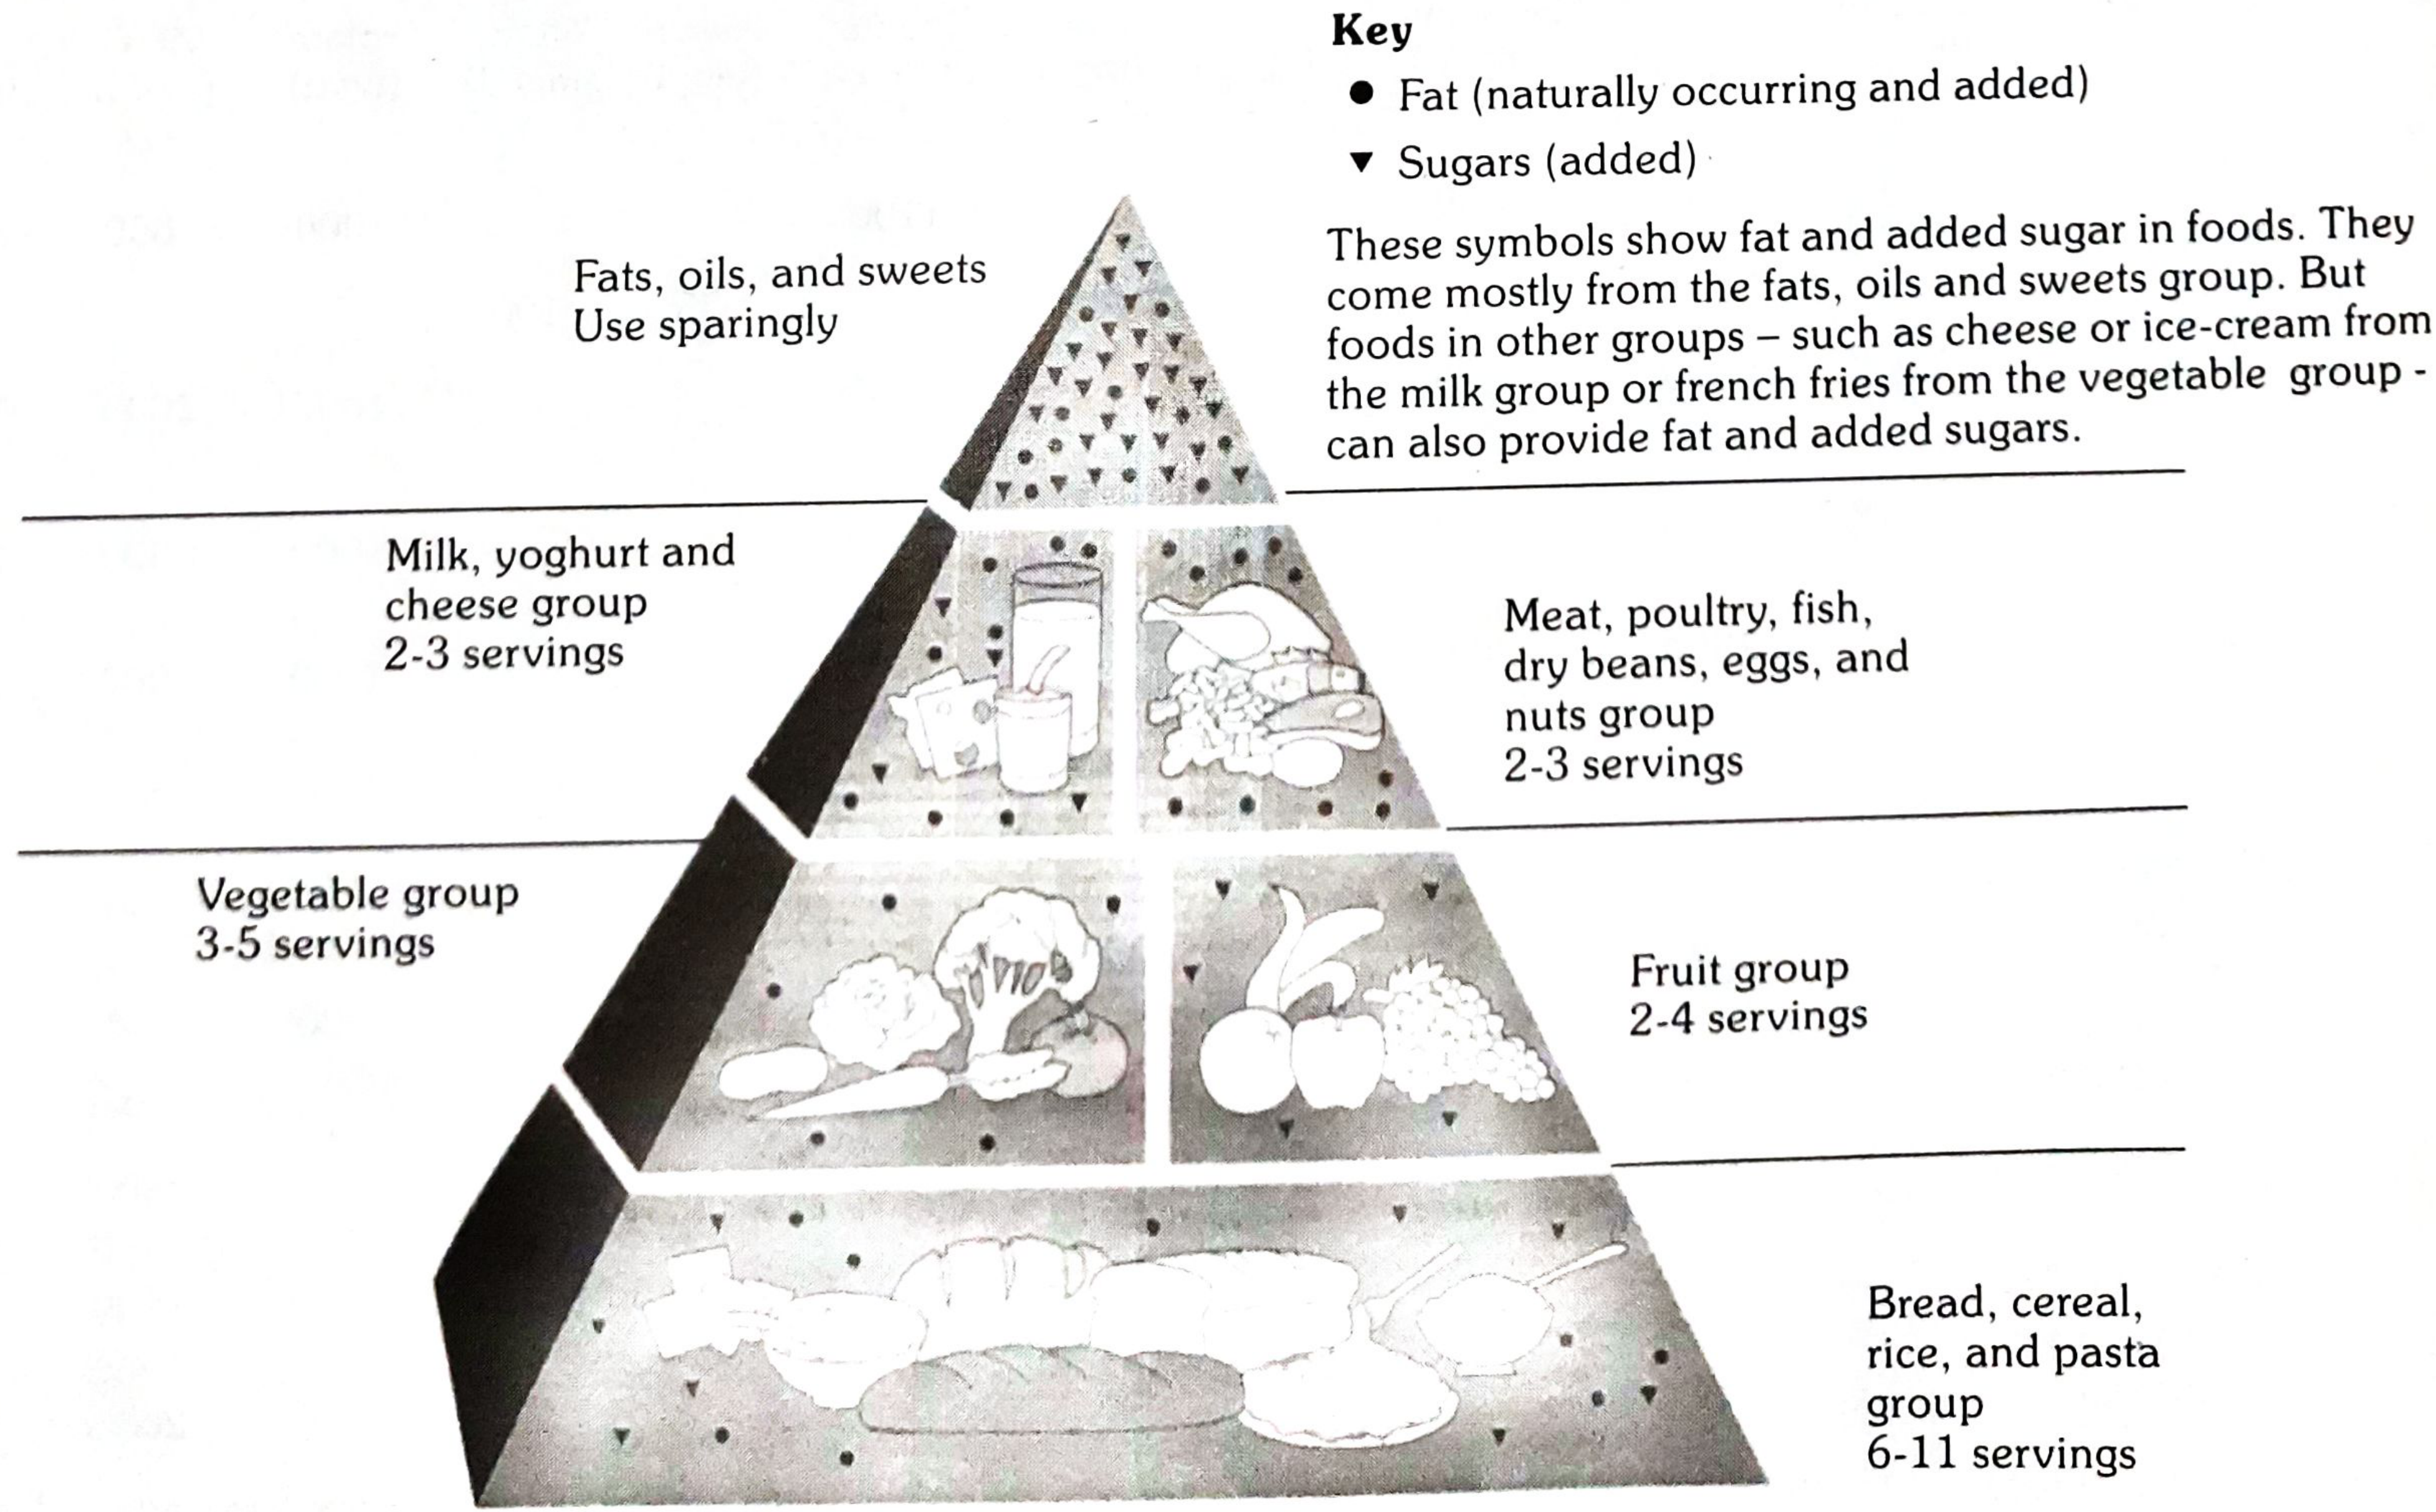
| Level | Food Group | Servings/Day |
|---|---|---|
| Base (largest) | Bread, cereal, rice, pasta | 6-11 servings |
| 2nd | Vegetables | 3-5 servings |
| 2nd | Fruits | 2-4 servings |
| 3rd | Milk, yoghurt, cheese | 2-3 servings |
| 3rd | Meat, poultry, fish, dry beans, eggs, nuts | 2-3 servings |
| Apex (smallest) | Fats, oils, sweets | Use sparingly |
RDA for Indians - 2020 (Table 28, Park's) - High-Yield for Exams
Adult Men (Moderate work, 65 kg body weight):
| Nutrient | RDA |
|---|---|
| Protein | 54.0 g/day |
| Dietary Fibre | 41 g/day |
| Calcium | 1000 mg/day |
| Magnesium | 440 mg/day |
| Iron | 19 mg/day |
| Zinc | 17 mg/day |
| Iodine | 150 μg/day |
| Thiamine (B1) | 1.8 mg/day |
| Riboflavin (B2) | 2.5 mg/day |
| Niacin (B3) | 18 mg/day |
| Vitamin B6 | 2.4 mg/day |
| Folate | 300 μg/day |
| Vitamin B12 | 2.2 μg/day |
| Vitamin C | 80 mg/day |
| Vitamin A | 1000 μg/day |
| Vitamin D | 600 IU/day |
Adult Women (Moderate work, 55 kg):
| Nutrient | RDA |
|---|---|
| Protein | 46.0 g/day |
| Dietary Fibre | 32 g/day |
| Calcium | 1000 mg/day |
| Iron | 29 mg/day (higher than men) |
| Zinc | 13 mg/day |
| Vitamin A | 840 μg/day |
Pregnant Women (Additional requirements):
- Protein: +9.5 g/day (2nd trimester), +22.0 g/day (3rd trimester)
- Calcium: 1000 mg/day
- Iron: 27 mg/day
- Folate: 500 μg/day
- Vitamin D: 600 IU/day
Key Exam One-Liners
- Balanced diet definition - variety of foods meeting all nutrient needs + small provision for leanness
- Protein % in balanced diet = 10-15% of daily energy
- Fat % in balanced diet = 15-30% of daily energy
- Salt - not more than 5 g/day (India average is 15 g/day)
- Fruits & vegetables - minimum 400 g/day
- Food pyramid base = Bread/cereal/rice/pasta (6-11 servings)
- RDA iron - women > men due to menstrual losses (29 mg vs 19 mg)
- Junk foods supply empty calories - should be reduced
Give me diagrama for my university exm on major nutrition health programs in India from park text boo
A comprehensive, exam-oriented medical diagram titled "Major Nutrition Health Programmes in India" based on Park's Textbook of Preventive and Social Medicine. The diagram should be a well-organized flowchart/mind-map style on a clean white background suitable for MBBS university exam revision. Central box at top: "NUTRITION PROGRAMMES IN INDIA (Park's Table 38)" in bold dark blue. Below it, two main branches: Left branch labeled "MINISTRY OF HEALTH & FAMILY WELFARE" (red header) containing three program boxes: 1. "1. Vitamin A Prophylaxis Programme (1970)" - details: 200,000 IU oral every 6 months, children 9 months–5 years, prevents nutritional blindness 2. "2. Prophylaxis Against Nutritional Anaemia (4th Five Year Plan)" - details: Iron + Folic Acid (IFA) tablets to pregnant women & children 1-12 yrs, via PHC/MCH/ICDS 3. "3. Iodine Deficiency Disorders Control Programme" - details: National Goitre Control Programme 1962, renamed IDD Control Programme 1986, Universal iodization of salt Right branch labeled "MINISTRY OF SOCIAL WELFARE" (green header) containing three program boxes: 4. "4. Special Nutrition Programme (1970)" - details: Children <6 yrs, pregnant & nursing mothers, urban slums/tribal/rural, 300 kcal + 10-12g protein/child/day 5. "5. Balwadi Nutrition Programme (1970)" - details: Children 3-6 yrs rural areas, 300 kcal + 10g protein/child/day, being phased out due to ICDS 6. "6. ICDS Programme (1975)" - details: Beneficiaries: children <6 yrs, adolescent girls 11-18 yrs, pregnant & lactating mothers, delivered via Anganwadi workers Bottom center: "MINISTRY OF EDUCATION" (orange header) with one large box: 7. "7. Mid-Day Meal Programme (1961) / School Lunch Programme" - details: School children, ≥1/3 total energy + ½ protein need, minimum 250 feeding days/year, locally available foods Below that, a separate colored box: "NATIONAL NUTRITION POLICY 1993" with two columns: - Left: "Direct Interventions (Short-term): ICDS, IFA supplementation, Vit A, growth monitoring, food fortification, micronutrient control" - Right: "Indirect Policy Instruments (Long-term): Food security 215 kg/person/year, land reforms, PDS, nutrition surveillance, women education" At the very bottom, a highlighted box: "ANAEMIA MUKT BHARAT STRATEGY - 6 Interventions: 1) IFA supplementation 2) Deworming 3) Behaviour change communication 4) Testing & treatment 5) Fortified foods in govt programmes 6) Non-nutritional anaemia management" Use color coding, clear arrows, bold headings, clean fonts, and leave enough white space for readability. Make it look like a professional medical study diagram.
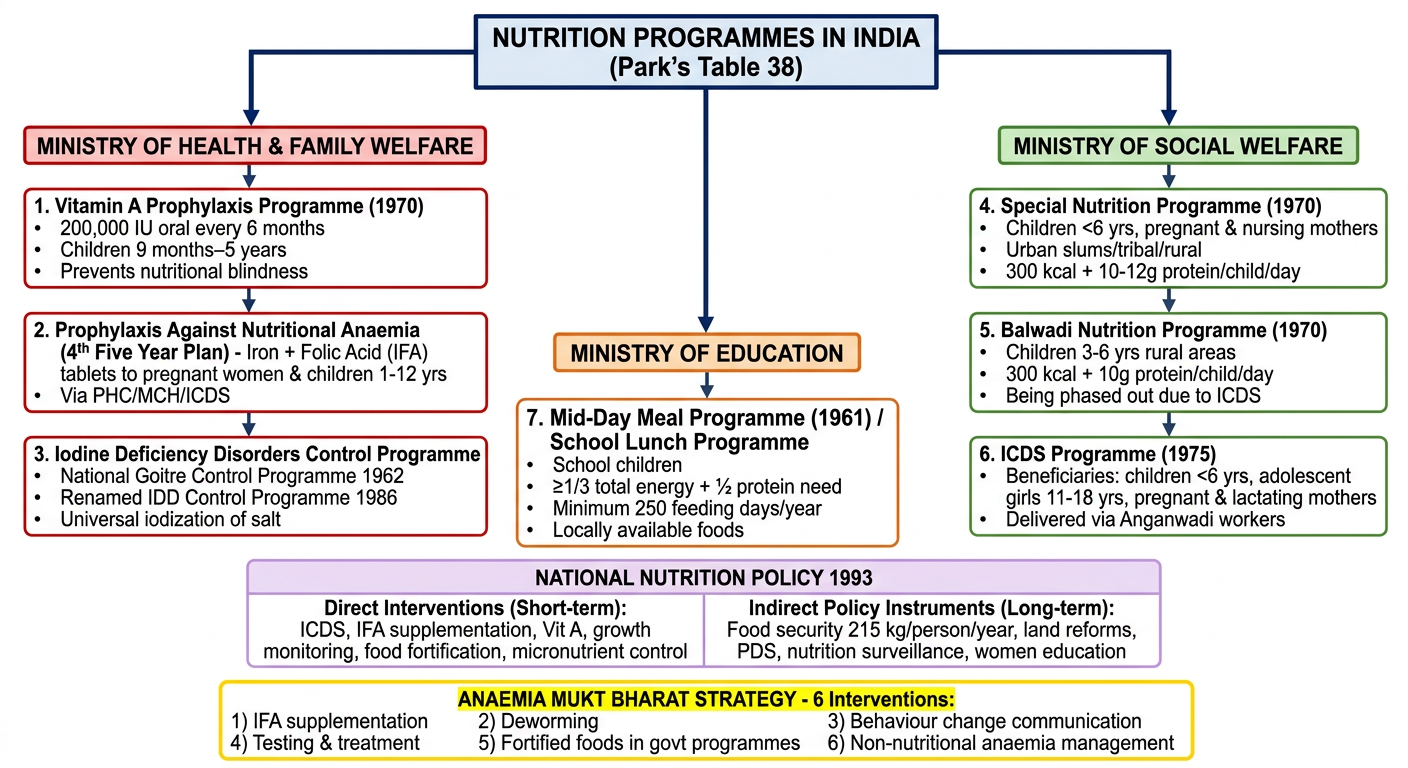
Nutrition Programmes in India - Quick Revision Table
| # | Programme | Ministry | Year | Target Group | Key Details |
|---|---|---|---|---|---|
| 1 | Vitamin A Prophylaxis | Health & FW | 1970 | Children 9 months - 5 years | 200,000 IU orally every 6 months; 1st dose 100,000 IU with measles vaccine at 9 months |
| 2 | Prophylaxis Against Nutritional Anaemia | Health & FW | 4th Five Year Plan | Pregnant women & children 1-12 yrs | IFA (Iron + Folic Acid) tablets; via PHC/MCH/ICDS |
| 3 | IDD Control Programme | Health & FW | 1962 (as National Goitre Control); 1986 renamed | General population | Universal iodization of salt; 145 million at risk |
| 4 | Special Nutrition Programme | Social Welfare | 1970 | Children <6 yrs, pregnant & nursing mothers | 300 kcal + 10-12 g protein/child/day; 500 kcal + 25 g protein/mother/day; 300 days/year |
| 5 | Balwadi Nutrition Programme | Social Welfare | 1970 | Children 3-6 yrs (rural) | 300 kcal + 10 g protein/child/day; being phased out due to ICDS |
| 6 | ICDS Programme | Social Welfare | 1975 | Children <6 yrs, adolescent girls 11-18 yrs, pregnant & lactating mothers | Anganwadi workers; Mahila Mandals; supervised by CDPO |
| 7 | Mid-Day Meal Programme | Education / HRD | 1961 | School children | ≥1/3 total energy + 1/2 protein need; min. 250 days/year |
High-Yield Exam One-Liners
- ICDS started: 1975 (National Policy for Children)
- Anganwadi coverage: 400-800 population per unit; mini-anganwadi: 150-400
- ICDS worker at village level: Anganwadi Worker; supervised by Mukhyasevika; CDPO oversees field
- Mid-day meal also called: School Lunch Programme (since 1961)
- Vitamin A 1st dose: 100,000 IU with measles vaccine at 9 months
- Special Nutrition Programme: being merged into ICDS
- Balwadis: being phased out due to universalization of ICDS
- Anaemia Mukt Bharat: 6 interventions including IFA, deworming, delayed cord clamping (3 minutes)
- National Nutrition Policy: 1993; direct (short-term) + indirect (long-term) strategies
Types of epidemic and epidemic curve from park for knruhs university exm for 3rd year mbbs student
A detailed, exam-oriented medical study diagram for MBBS 3rd year students titled "TYPES OF EPIDEMIC & EPIDEMIC CURVE" from Park's Textbook of Preventive and Social Medicine, designed for KNRUHS university exam. Clean white background, professional medical textbook style with clear sections, bold headings, color-coded boxes, and labeled graphs. LAYOUT (top to bottom): --- TOP SECTION: CLASSIFICATION --- Large bold title at top: "TYPES OF EPIDEMIC (Park's Textbook - PSM)" A central classification tree branching into THREE main types: BOX A (blue, left): "A. COMMON-SOURCE EPIDEMICS" Two sub-boxes below it: - "(a) Single Exposure / POINT-SOURCE epidemic" - Example: Food poisoning, Bhopal gas tragedy - "(b) Continuous / Multiple Exposure epidemic" - Example: Legionnaire's disease 1976 Philadelphia, contaminated well water BOX B (green, center): "B. PROPAGATED EPIDEMICS" Three sub-boxes below it: - "(a) Person-to-person" - Example: Hepatitis A, Polio - "(b) Arthropod vector" - Example: Malaria, Dengue - "(c) Animal reservoir" - Example: Rabies, Plague BOX C (orange, right): "C. SLOW (MODERN) EPIDEMICS" One sub-box: - "Non-infectious chronic diseases" - Example: Obesity, Diabetes, Cancer, CVD --- MIDDLE SECTION: EPIDEMIC CURVES (3 side-by-side graphs) --- Section title: "EPIDEMIC CURVE = Graph of time distribution of cases (No. of Cases vs. Time)" Graph 1 (left, blue-bordered): Title: "Point-Source / Common-Source Epidemic" Draw a bell-shaped curve: starts at zero, rises sharply after a vertical arrow labeled "Exposure", reaches ONE single sharp peak, then falls rapidly back to zero. Label: "X-axis = Time, Y-axis = No. of Cases" Key features list below graph: - Single sharp peak - Explosive onset - All cases within ONE incubation period - Rapid rise AND fall - No secondary waves Graph 2 (center, green-bordered): Title: "Propagated / Person-to-Person Epidemic" Draw multiple peaks: starts low, then shows a small first hump, then larger second hump, then even larger third hump, gradually tailing off slowly to the right - like a series of successively taller waves (each separated by one incubation period interval). Key features list below graph: - Gradual rise - Multiple peaks (each = one incubation period apart) - Slow tail-off over LONG period - Ends when susceptibles depleted - e.g., Hepatitis A, Measles Graph 3 (right, orange-bordered): Title: "Continuous/Prolonged Common-Source Epidemic" Draw an irregular, jagged fluctuating line that starts, rises irregularly without a single sharp peak, persists over a wide time span, with no secondary waves but extended plateau-like appearance. Key features below: - No explosive onset - Irregular or extended pattern - Continues beyond one incubation period - No person-to-person spread - e.g., Contaminated water supply, Legionnaire's disease --- BOTTOM SECTION: KEY EXAM POINTS BOX --- A highlighted yellow box titled "HIGH-YIELD EXAM FACTS (Park's)" Bullet points: - Epidemic = occurrence of disease in excess of normal expectancy - Epidemic curve = graph of time distribution of cases - Median incubation period = time for 50% of cases to occur after exposure (used in point-source) - Point-source: cases all within ONE incubation period - Propagated: spread depends on herd immunity, contact opportunities, secondary attack rate - Mixed epidemic: starts as common-source, continues as propagated (e.g., water-borne cholera) - Slow epidemics: non-communicable diseases e.g. obesity, CVD, cancer Make text large enough to read clearly, use arrows and labels on graphs, color-code each type consistently throughout.
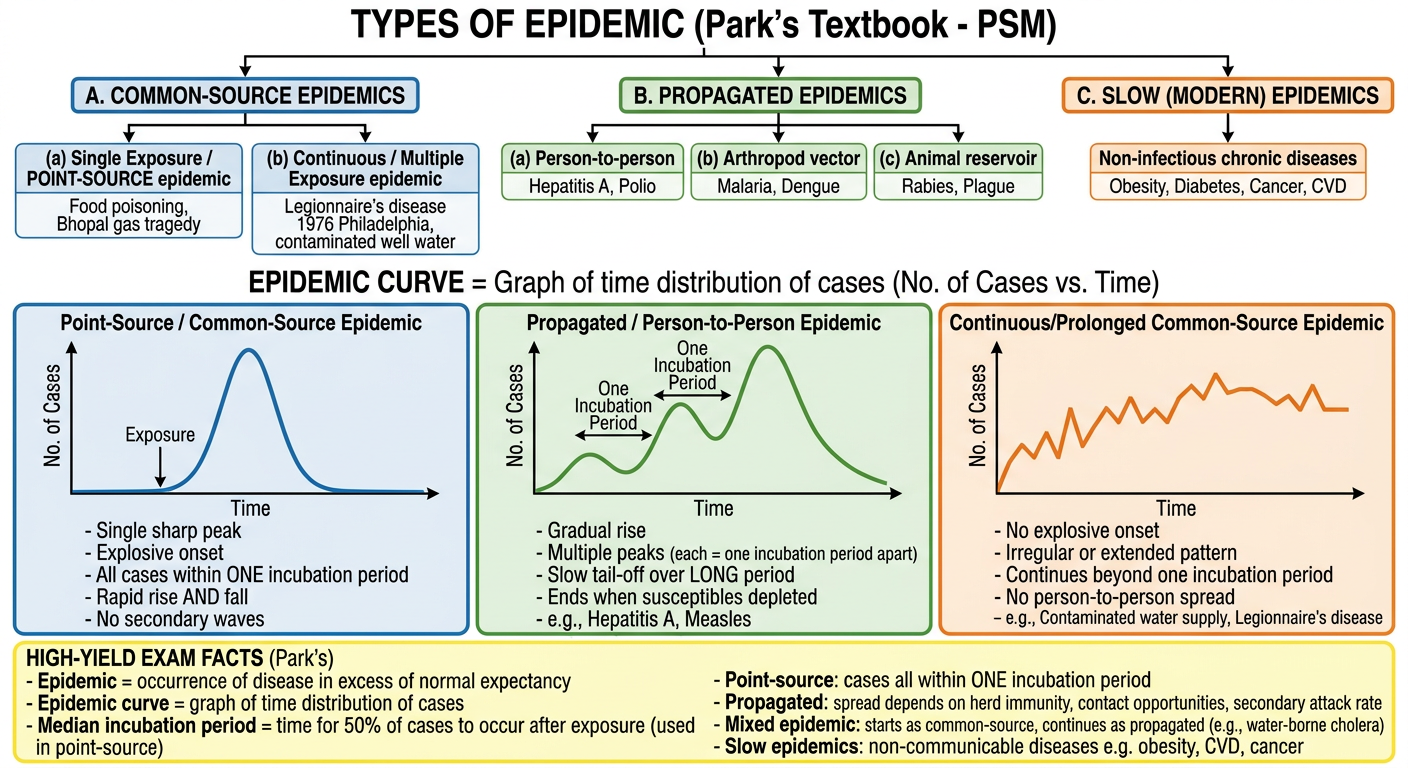
TYPES OF EPIDEMIC - Park's PSM
Definition of Epidemic
Classification (3 Major Types - Park's)
A. COMMON-SOURCE EPIDEMICS
(a) Single Exposure / POINT-SOURCE Epidemic
- Exposure to disease agent is brief and essentially simultaneous
- All cases develop within ONE incubation period
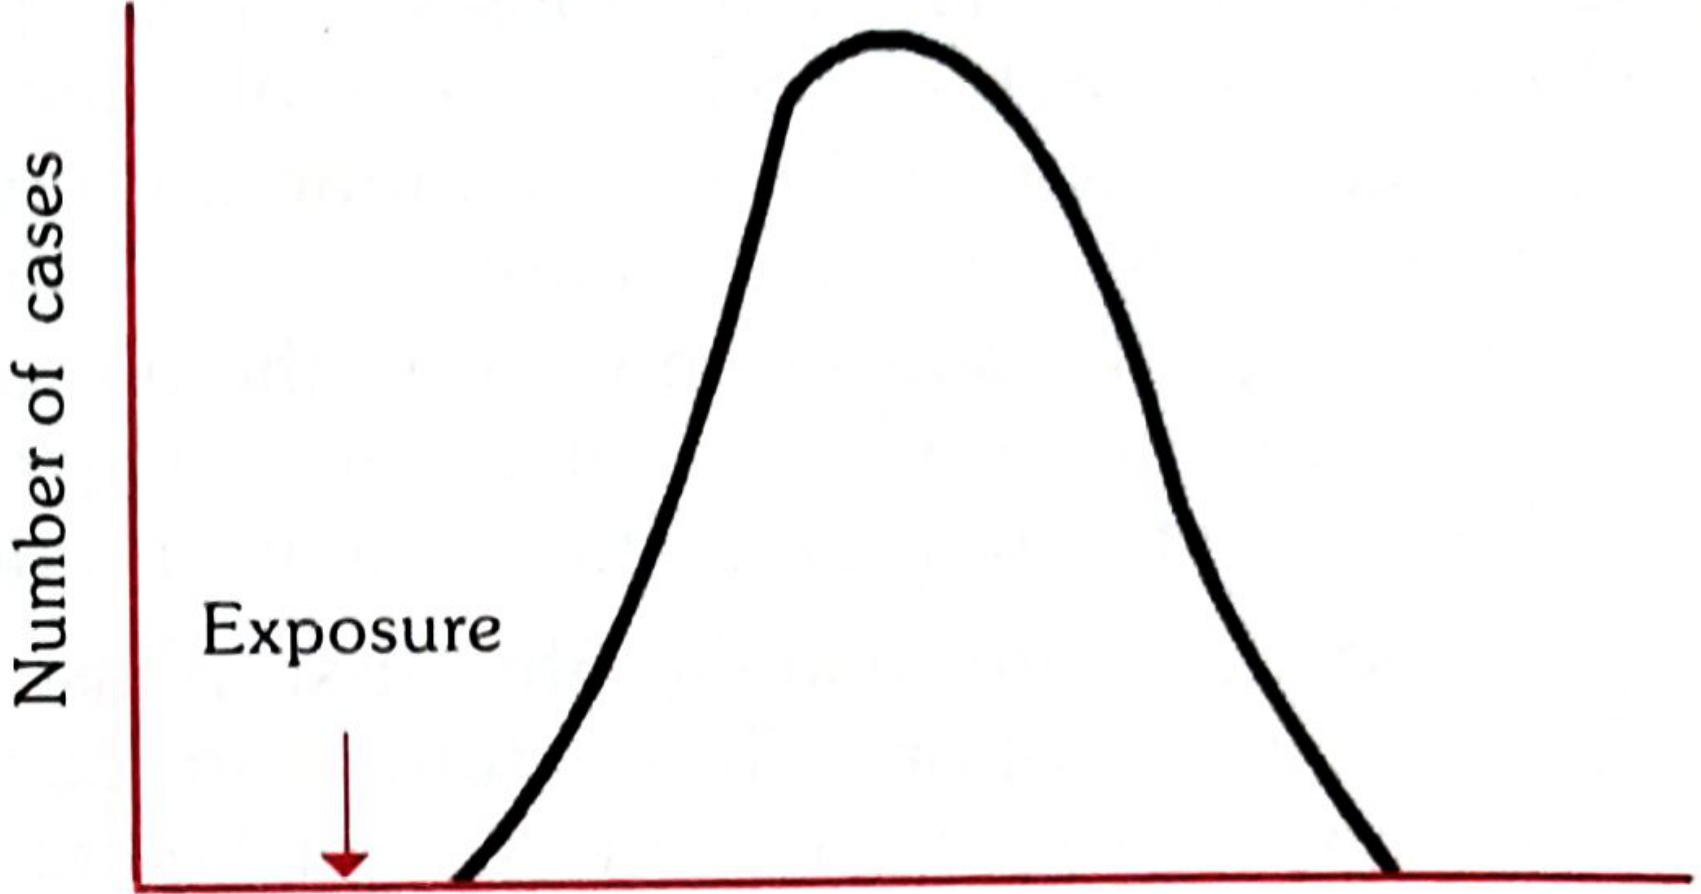
- Epidemic curve: Single sharp bell-shaped peak, rises and falls rapidly
- No secondary waves
- Example: Food poisoning, Bhopal gas tragedy, Minamata disease (methyl mercury in fish)
- Epidemic curve rises and falls rapidly with no secondary waves
- Epidemic is explosive - cases cluster within a narrow time interval
- All cases develop within one incubation period
(b) Continuous / Multiple Exposure Epidemic
- Exposure from same source is prolonged, repeated, or intermittent
- Epidemic is more extended or irregular
- Continues beyond range of ONE incubation period
- No secondary cases from person-to-person contact
- Examples: Legionnaire's disease (Philadelphia, 1976), contaminated well, nationally distributed food/vaccine
B. PROPAGATED EPIDEMICS
- Results from person-to-person transmission of infectious agent
- Gradual rise, tails off over a much longer period
- Transmission continues until susceptibles are depleted
- Multiple successive peaks, each separated by one incubation period
- Speed of spread depends on:
- Herd immunity
- Opportunities for contact
- Secondary attack rate
- More likely where large numbers of susceptibles are aggregated
- Examples: Hepatitis A, Polio
- (a) Person-to-person
- (b) Arthropod vector (malaria, dengue)
- (c) Animal reservoir (rabies, plague)
C. SLOW (MODERN) EPIDEMICS
- Non-infectious, non-communicable diseases
- Examples: Obesity, Diabetes, Cardiovascular disease, Cancer
- Spread slowly over decades across populations
EPIDEMIC CURVE - Summary Table
| Feature | Point-Source | Propagated | Continuous Common-Source |
|---|---|---|---|
| Onset | Explosive | Gradual | Extended/irregular |
| Peak | Single sharp peak | Multiple successive peaks | Irregular plateau |
| Duration | Within 1 incubation period | Spans multiple incubation periods | Prolonged |
| Secondary waves | None | Present | None |
| Person-to-person spread | No | Yes | No |
| Example | Food poisoning | Hepatitis A, Polio | Legionnaire's disease |
MIXED EPIDEMIC (Exam Favourite!)
- Starts as common-source, then continues as propagated
- Classic example: Water-borne cholera - reaches a sharp peak, then tails off gradually
Original Fig. 4 from Park's (Common-Source / Point-Source Epidemic Curve)
High-Yield One-Liners for KNRUHS
- Epidemic curve = graph of time distribution of epidemic cases
- Point-source = all cases in ONE incubation period, single peak
- Propagated = multiple peaks, slow rise, slow fall
- Median incubation period = time for 50% of cases after exposure
- Legionnaire's disease = continuous common-source epidemic
- Water-borne cholera = mixed epidemic (common-source + propagated)
- Slow epidemics = obesity, CVD, diabetes, cancer
- Propagated epidemic ends when susceptibles are depleted
A perfect 5 marks ans on Xeropthalmia from park text book with headings for university exm and 2 nenat and simple diagrams to draw for exm
A clean, exam-oriented medical diagram for MBBS university exam titled "WHO CLASSIFICATION OF XEROPHTHALMIA" from Park's Textbook of Preventive and Social Medicine. Simple, easy to draw in exam, black and white with minimal color. Show a vertical flowchart / ladder diagram with the title at top. The diagram shows a progression from mild to severe, arranged as a ladder/steps going DOWN (top = mild, bottom = severe): CONJUNCTIVAL SIGNS (label on left side): Step 1 box: "XN - Night Blindness (Nyctalopia)" - First sign, impaired dark adaptation Step 2 box: "X1A - Conjunctival Xerosis" - Dry, lustreless conjunctiva, loss of transparency Step 3 box: "X1B - Bitot's Spots" - Triangular, foamy, white/grey spots on conjunctiva (temporal side) CORNEAL SIGNS (label on left side with an arrow showing progression): Step 4 box: "X2 - Corneal Xerosis" - Dry, hazy, lustreless cornea Step 5 box: "X3A - Corneal Ulceration < 1/3 of cornea" Step 6 box: "X3B - Corneal Ulceration / Keratomalacia ≥ 1/3 of cornea" - IRREVERSIBLE, leads to blindness - mark with RED border SEQUELAE box at bottom: "XS - Corneal Scar (Leucoma)" - Permanent, visible white scar At the right side, a double-headed arrow labeled "REVERSIBLE" pointing to XN through X2, and another arrow labeled "IRREVERSIBLE / BLINDNESS" pointing to X3A, X3B, XS. Below the ladder, a small info box: "Public Health Cut-offs (WHO): - Night blindness > 1% - Bitot's spots > 0.5% - Corneal xerosis/ulcer > 0.01% - Corneal scar > 0.05% - Serum retinol <10 mcg/dl in > 5%" Keep it simple with clear boxes, arrows showing progression, and bold labels. Suitable for hand-drawing in a university exam.
A simple, clean, easy-to-draw-in-exam medical diagram titled "PREVENTION & CONTROL OF XEROPHTHALMIA (WHO Strategy)" for MBBS university exam - Park's Textbook PSM. Show a 3-tier horizontal table/boxes diagram: THREE colored boxes side by side: LEFT BOX (light blue) titled "SHORT-TERM ACTION": Content: - Massive dose Vitamin A supplementation - Oral oily preparation - Vulnerable groups (children 9 months - 5 years) - 1st dose: 100,000 IU with measles vaccine (9 months) - Subsequent doses: 200,000 IU every 6 months up to 5 years - Quick to implement, minimum infrastructure MIDDLE BOX (light green) titled "MEDIUM-TERM ACTION": Content: - Food Fortification with Vitamin A - Dalda/Vanaspati fortification (India) - Sugar, salt, margarine, dried skimmed milk fortification - Promotes regular adequate Vitamin A intake RIGHT BOX (light orange/yellow) titled "LONG-TERM ACTION": Content: - Dietary diversification - Encourage dark green leafy vegetables - Promote breastfeeding - Safe water supply & sanitation - Immunization (especially measles) - Treatment of diarrhoea & infections - Health education of mothers - Primary health care strengthening Below the three boxes, a wide bottom box titled "VITAMIN A PROPHYLAXIS PROGRAMME - India": - Launched: 1970 (Ministry of Health & Family Welfare) - Modified 1992: children 9 months to 3 years - 2006 guidelines: children up to 5 years - Part of RCH Programme under NRHM - Sick children: measles cases get 1 dose if not given in previous 1 month; severe malnutrition gets additional dose Keep clean, readable, bold headings, suitable for hand-drawing in a 5-mark university exam answer. White background, professional medical study style.
429 Too Many Requests. {'message': '{\n "error": {\n "code": 429,\n "message": "Resource exhausted. Please try again later. Please refer to https://cloud.google.com/vertex-ai/generative-ai/docs/error-code-429 for more details.",\n "status": "RESOURCE_EXHAUSTED"\n }\n}\n', 'status': 'Too Many Requests'}
We encountered an error while processing your request. Please try again or reach out to us for help.