
Explain me 10 common heart diseases with ecg changes and ecg images
Reading File
Now let me search the medical library for ECG changes in heart diseases, running parallel queries to cover the major conditions.
Finding Sources
Finding Sources
Searching the Web
10 common heart diseases ECG changes patterns images
Good, I have some leads. Now let me read the key ECG-rich sections from the textbooks, and search for the other conditions in parallel.
Reading File
Finding Sources
Finding Sources
Finding Sources
Excellent. Now let me read key image-rich textbook sections and search for more conditions in parallel.
Reading File
Finding Sources
Finding Sources
Finding Sources
I found some great image URLs and content. Let me now fetch the key ECG images and read the WPW and heart block sections.
Reading File
Reading File
Loading Image
Now let me fetch several more key ECG images in parallel.
Loading Image
Loading Image
Reading File
Reading File
I have rich textbook content. Let me now fetch more key ECG images and get content on the remaining conditions.
Loading Image
Reading File
Reading File
Excellent content! Let me fetch the MI sequence ECG image and a few more key images.
Loading Image
Loading Image
Reading File
I have very rich textbook content and ECG images. Let me now fetch a couple more images - the Wellens T-wave (V1-V4 deep inversions) and get pericarditis/PE ECG content.
Finding Sources
Finding Sources
I've reached my query_library_db limit. Let me read the pericarditis ECG section with the image and compile the full answer.
Reading File
Reading File
Let me fetch the pericarditis ECG image.
Loading Image
I now have comprehensive textbook content and ECG images for the major conditions. Let me compile the complete, detailed answer.
10 Common Heart Diseases: ECG Changes and Images
Sources: Harrison's Principles of Internal Medicine 22E, Tintinalli's Emergency Medicine, Fuster and Hurst's The Heart 15E, Ganong's Review of Medical Physiology, Braunwald's Heart Disease, Goldman-Cecil Medicine
1. ST-Elevation Myocardial Infarction (STEMI)
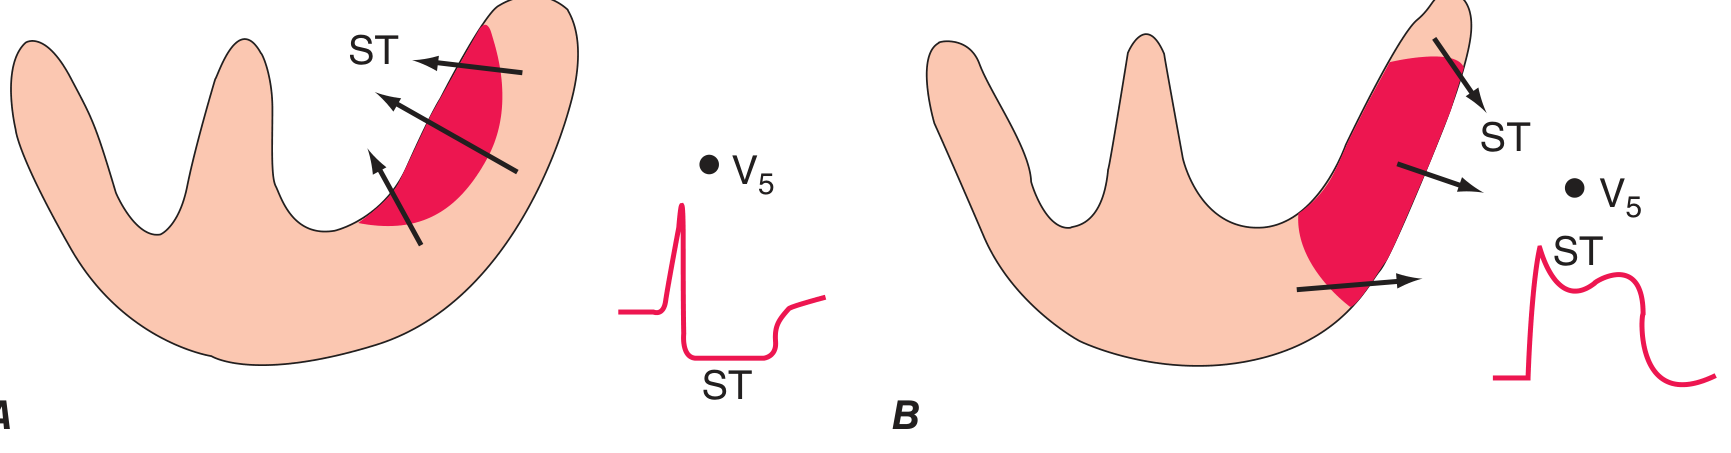
Mechanism: Complete occlusion of a coronary artery causes transmural (full-thickness) ischemia. Infarcted myocytes undergo rapid repolarization, reduced resting membrane potential, and delayed depolarization - all producing "currents of injury" that shift the ST segment upward over the affected zone.
ECG Changes:
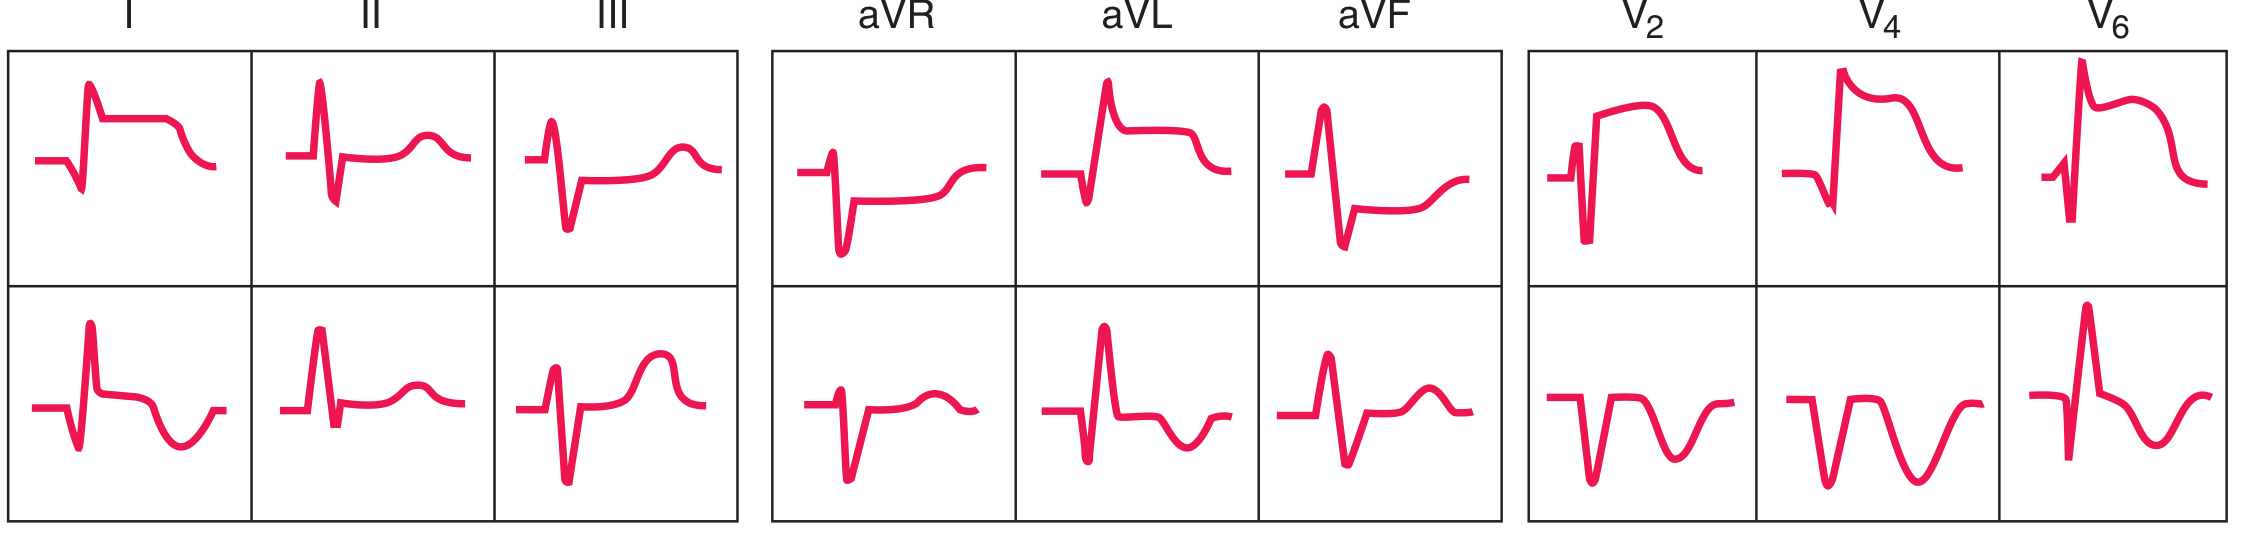
- Hyperacute T waves - earliest finding (tall, broad, peaked T waves within minutes)
- ST elevation - convex (tombstone) morphology; ≥1 mm in limb leads, ≥2 mm in precordial leads
- Reciprocal ST depression in leads opposite the infarct zone (indicates larger injury area and worse prognosis)
- Pathologic Q waves - develop within hours to days (>40 ms wide, >25% of R-wave amplitude); marker of myocardial necrosis
- T-wave inversion - follows ST elevation as infarction evolves
Localisation by leads (Tintinalli's, p. 378):
| Territory | ST Elevation Leads |
|---|---|
| Anterior | V1-V4 |
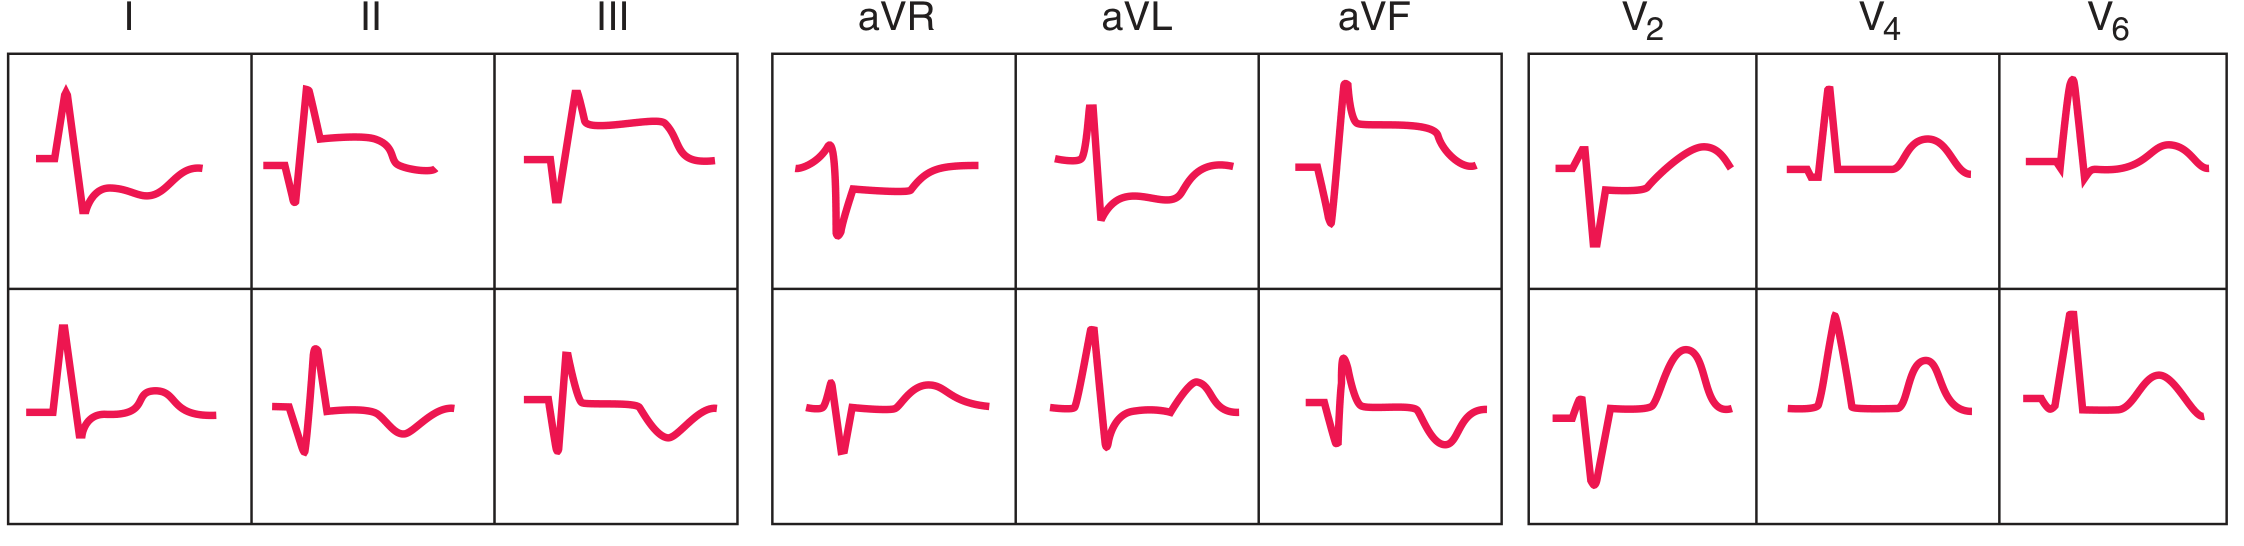
| Inferior | II, III, aVF |
| Lateral | I, aVL, V5-V6 |
| Right ventricle | V3R-V6R |
| Posterior | Tall R in V1-V2 (reciprocal) |
ECG Diagram - Subendocardial vs. Transmural Ischemia (current of injury):
Anterior STEMI ECG sequence (acute → evolving):
Inferior STEMI ECG sequence:
2. NSTEMI / Unstable Angina
Mechanism: Partial coronary occlusion or severe subendocardial ischemia without transmural injury. The ST vector shifts inward (toward the subendocardium), producing ST depression in overlying leads.
ECG Changes:
- ST depression - horizontal or downsloping ≥0.5-1 mm (more specific and worrisome than upsloping)
- T-wave inversion - may be deep or diffuse
- No ST elevation (by definition) and no Q waves in NSTEMI
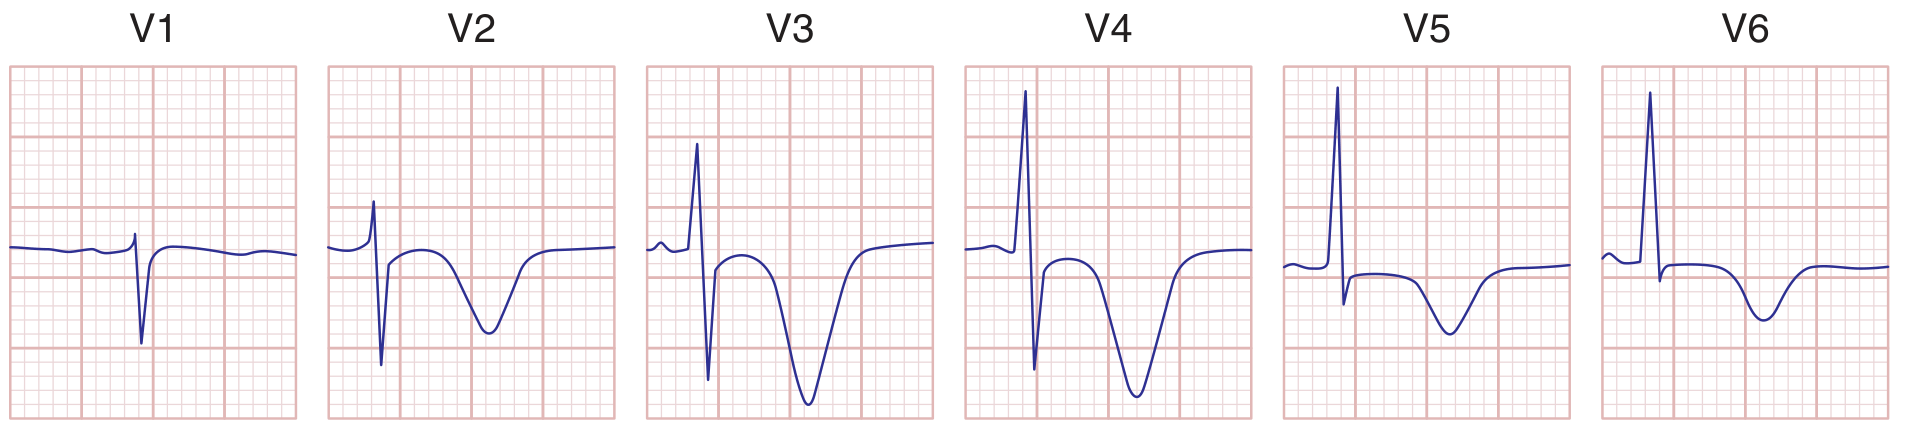
- Wellens sign - deep symmetric T-wave inversions in V1-V4 indicates critical LAD stenosis (even without troponin elevation)
Wellens T-wave pattern (critical LAD stenosis):
3. Atrial Fibrillation (AF)
Mechanism: Chaotic, disorganized atrial electrical activity from multiple reentrant circuits replaces normal sinus node depolarization.
ECG Changes:
- Absent P waves - replaced by irregular fibrillatory baseline ("f waves"), best seen in V1 and lead II
- Irregularly irregular RR intervals - the hallmark finding
- Narrow QRS complexes - unless aberrant conduction or bundle branch block coexists
- Variable ventricular rate - typically 100-160 bpm in uncontrolled AF
- If associated with WPW: wide, irregular, rapid complex tachycardia (very dangerous)
Key points:
- AF with pulmonary hypertension may show right axis deviation and R/S ratio >1 in V1 (Tintinalli's)
- AF with mitral stenosis: left atrial enlargement pattern (bifid P waves in sinus rhythm, then no P waves once AF develops)
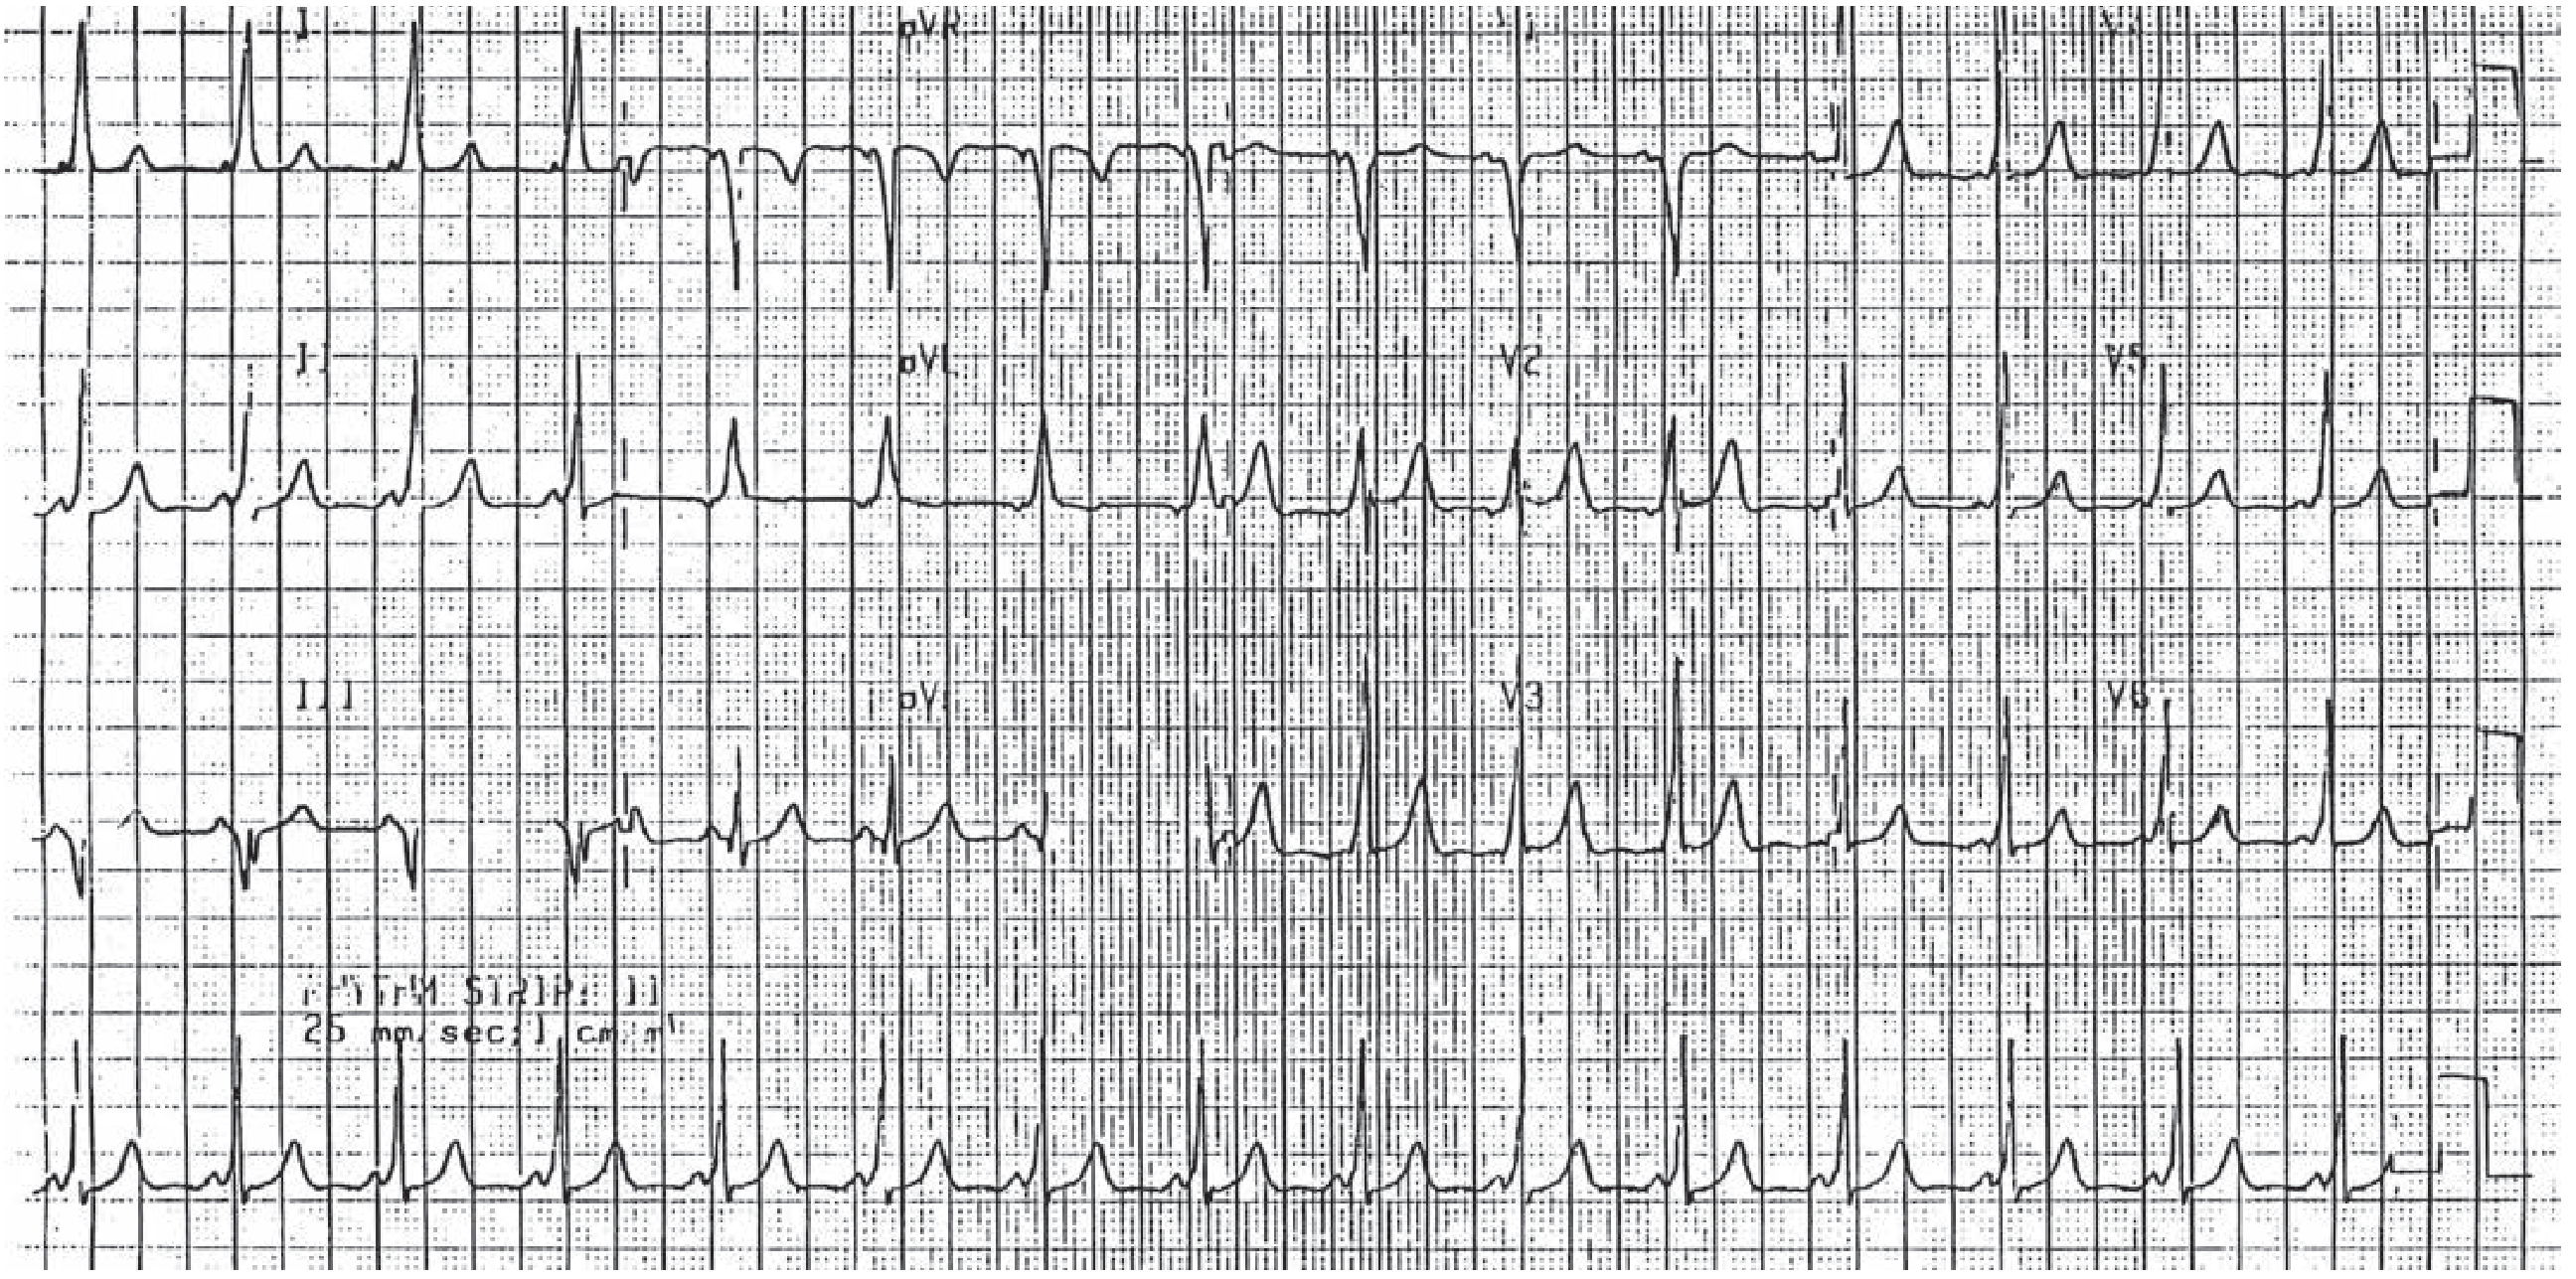
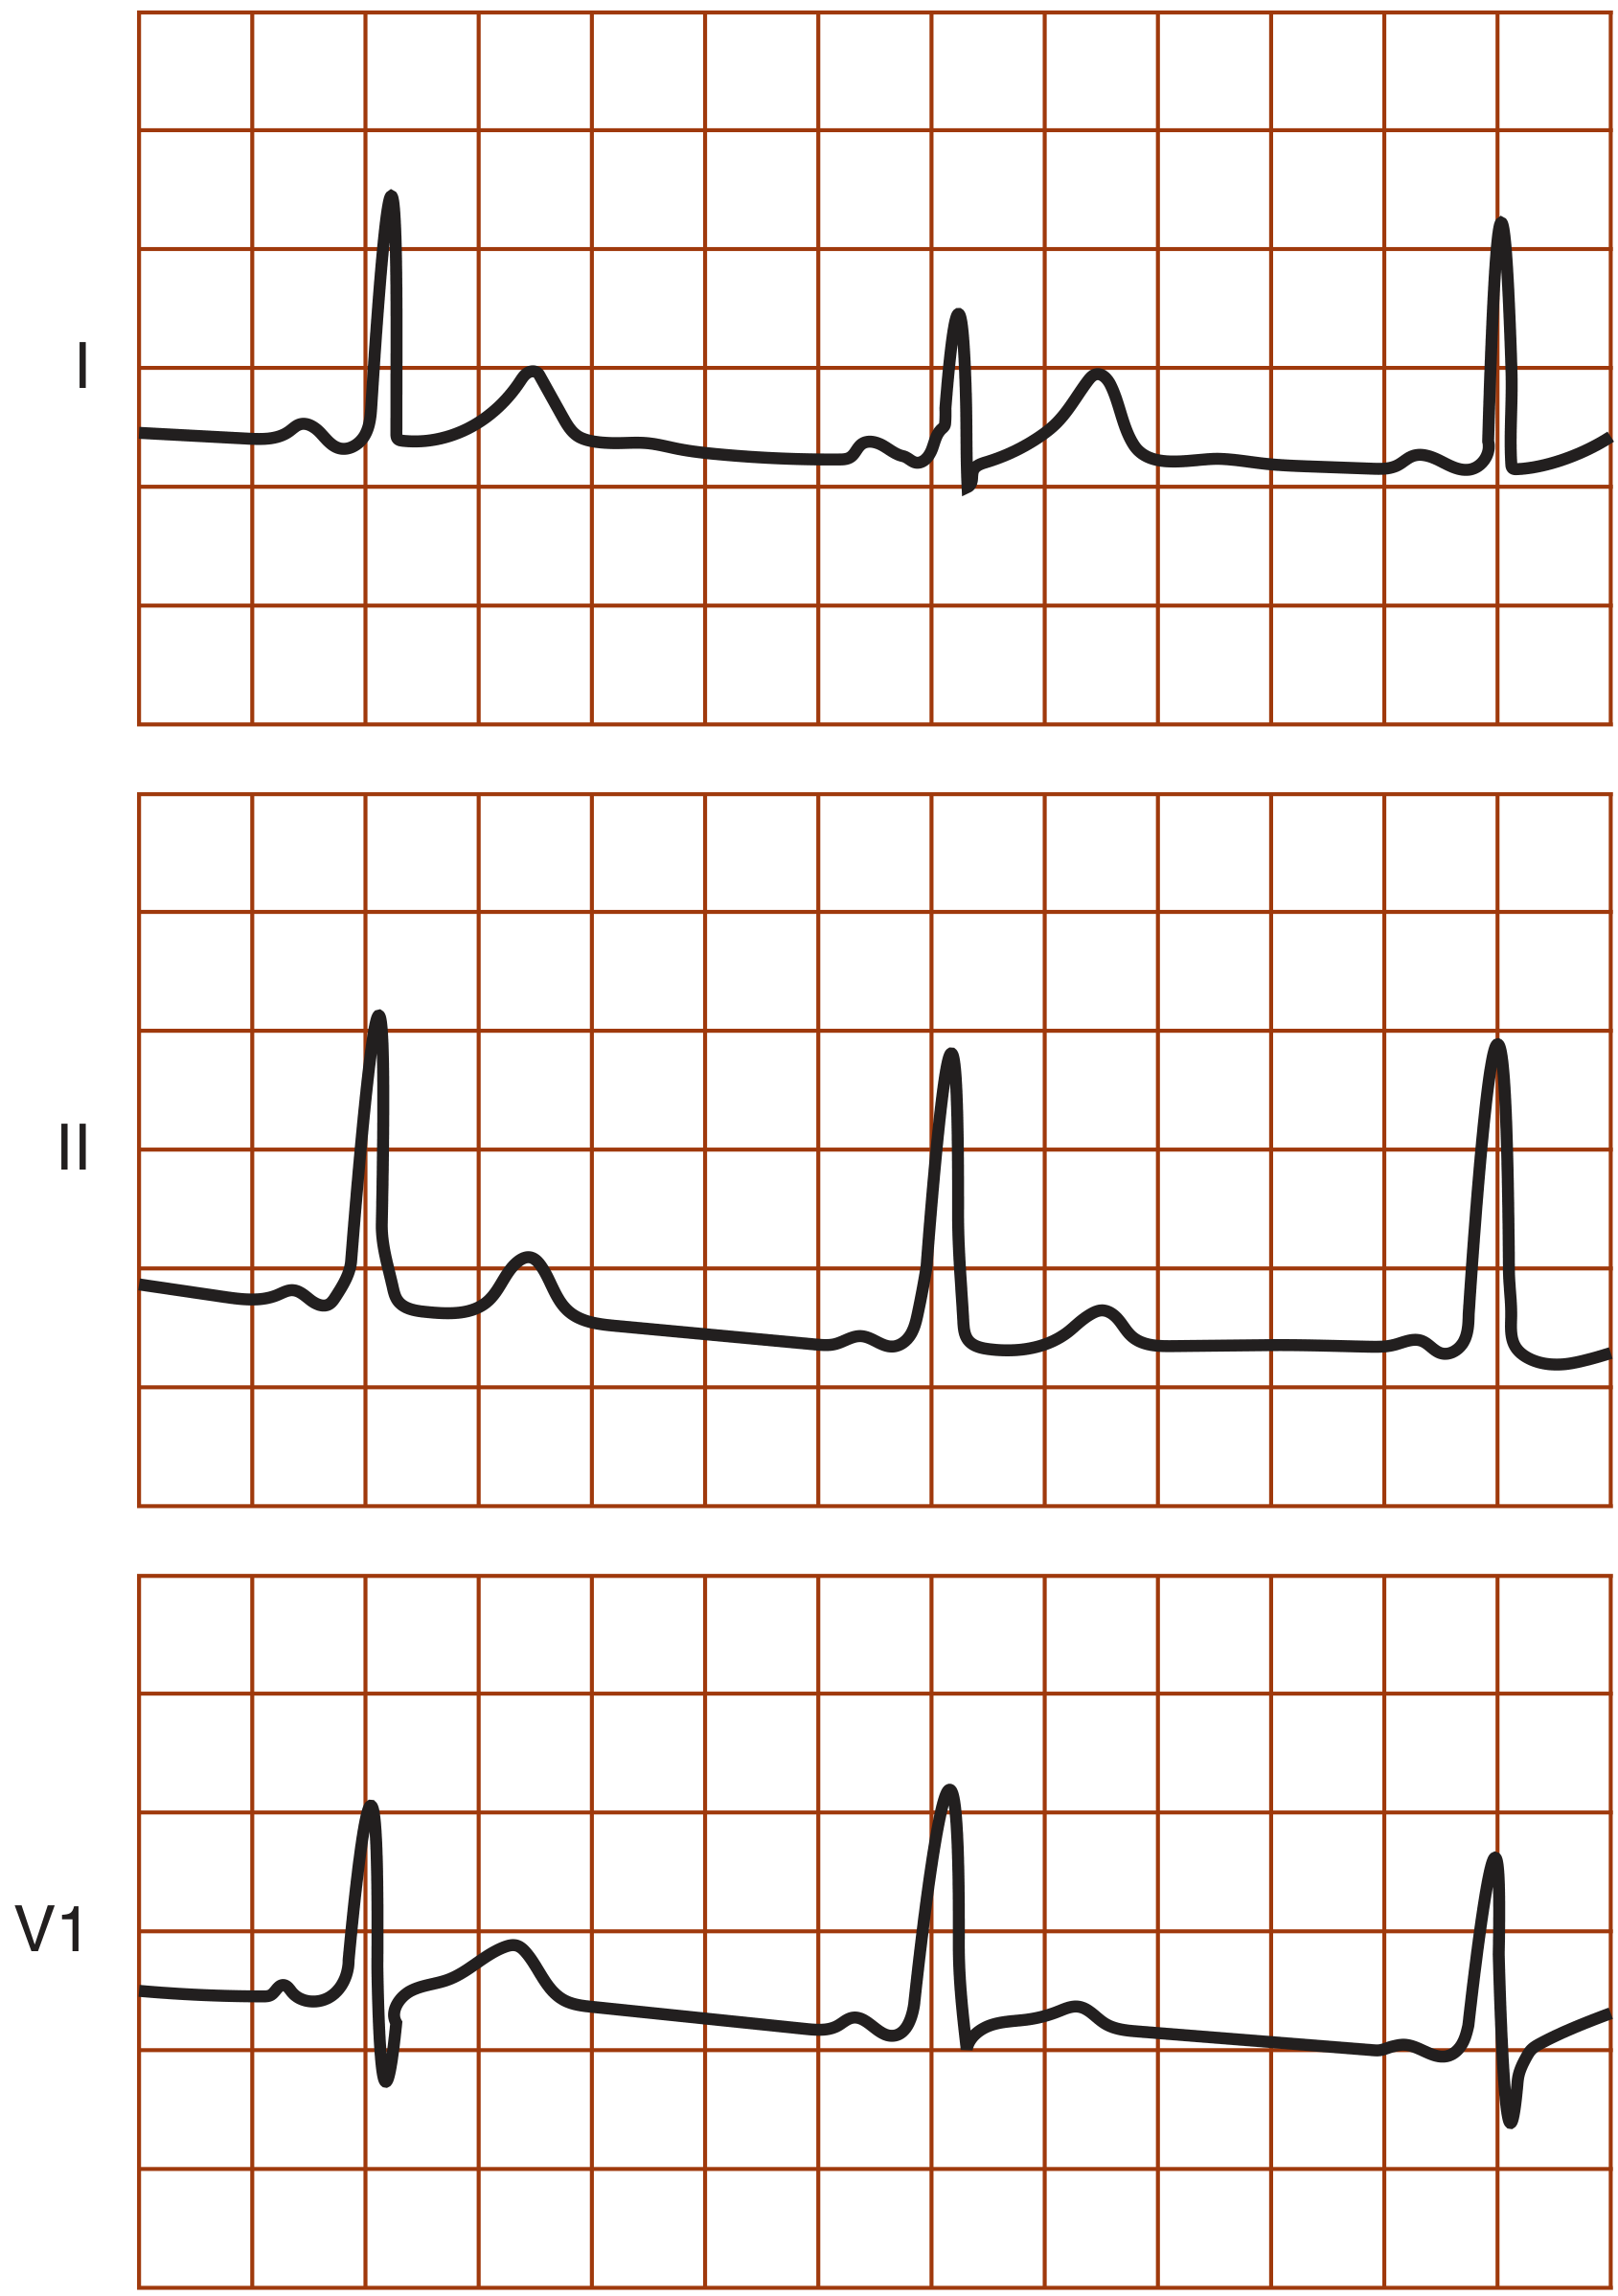
4. Wolff-Parkinson-White (WPW) Syndrome
Mechanism: An accessory pathway (bundle of Kent) bypasses the AV node and pre-excites part of the ventricle before the normal impulse arrives, creating a "delta wave."
ECG Changes (in sinus rhythm):
- Short PR interval (<120 ms) - because the accessory pathway conducts without the AV nodal delay
- Delta wave - slurred upstroke at the beginning of the QRS
- Wide QRS (>120 ms) - from fusion of pre-excited and normally conducted impulses
- Secondary ST-T changes - discordant T waves
During tachycardia:
- Orthodromic AVRT (most common, 65%): narrow-complex tachycardia, no delta waves
- Antidromic AVRT: wide-complex tachycardia mimicking ventricular tachycardia
- AF with WPW: extremely rapid, wide, irregular tachycardia - can degenerate to VF
WPW 12-lead ECG:
WPW single complex detail (Symptom to Diagnosis textbook):
5. Acute Pericarditis
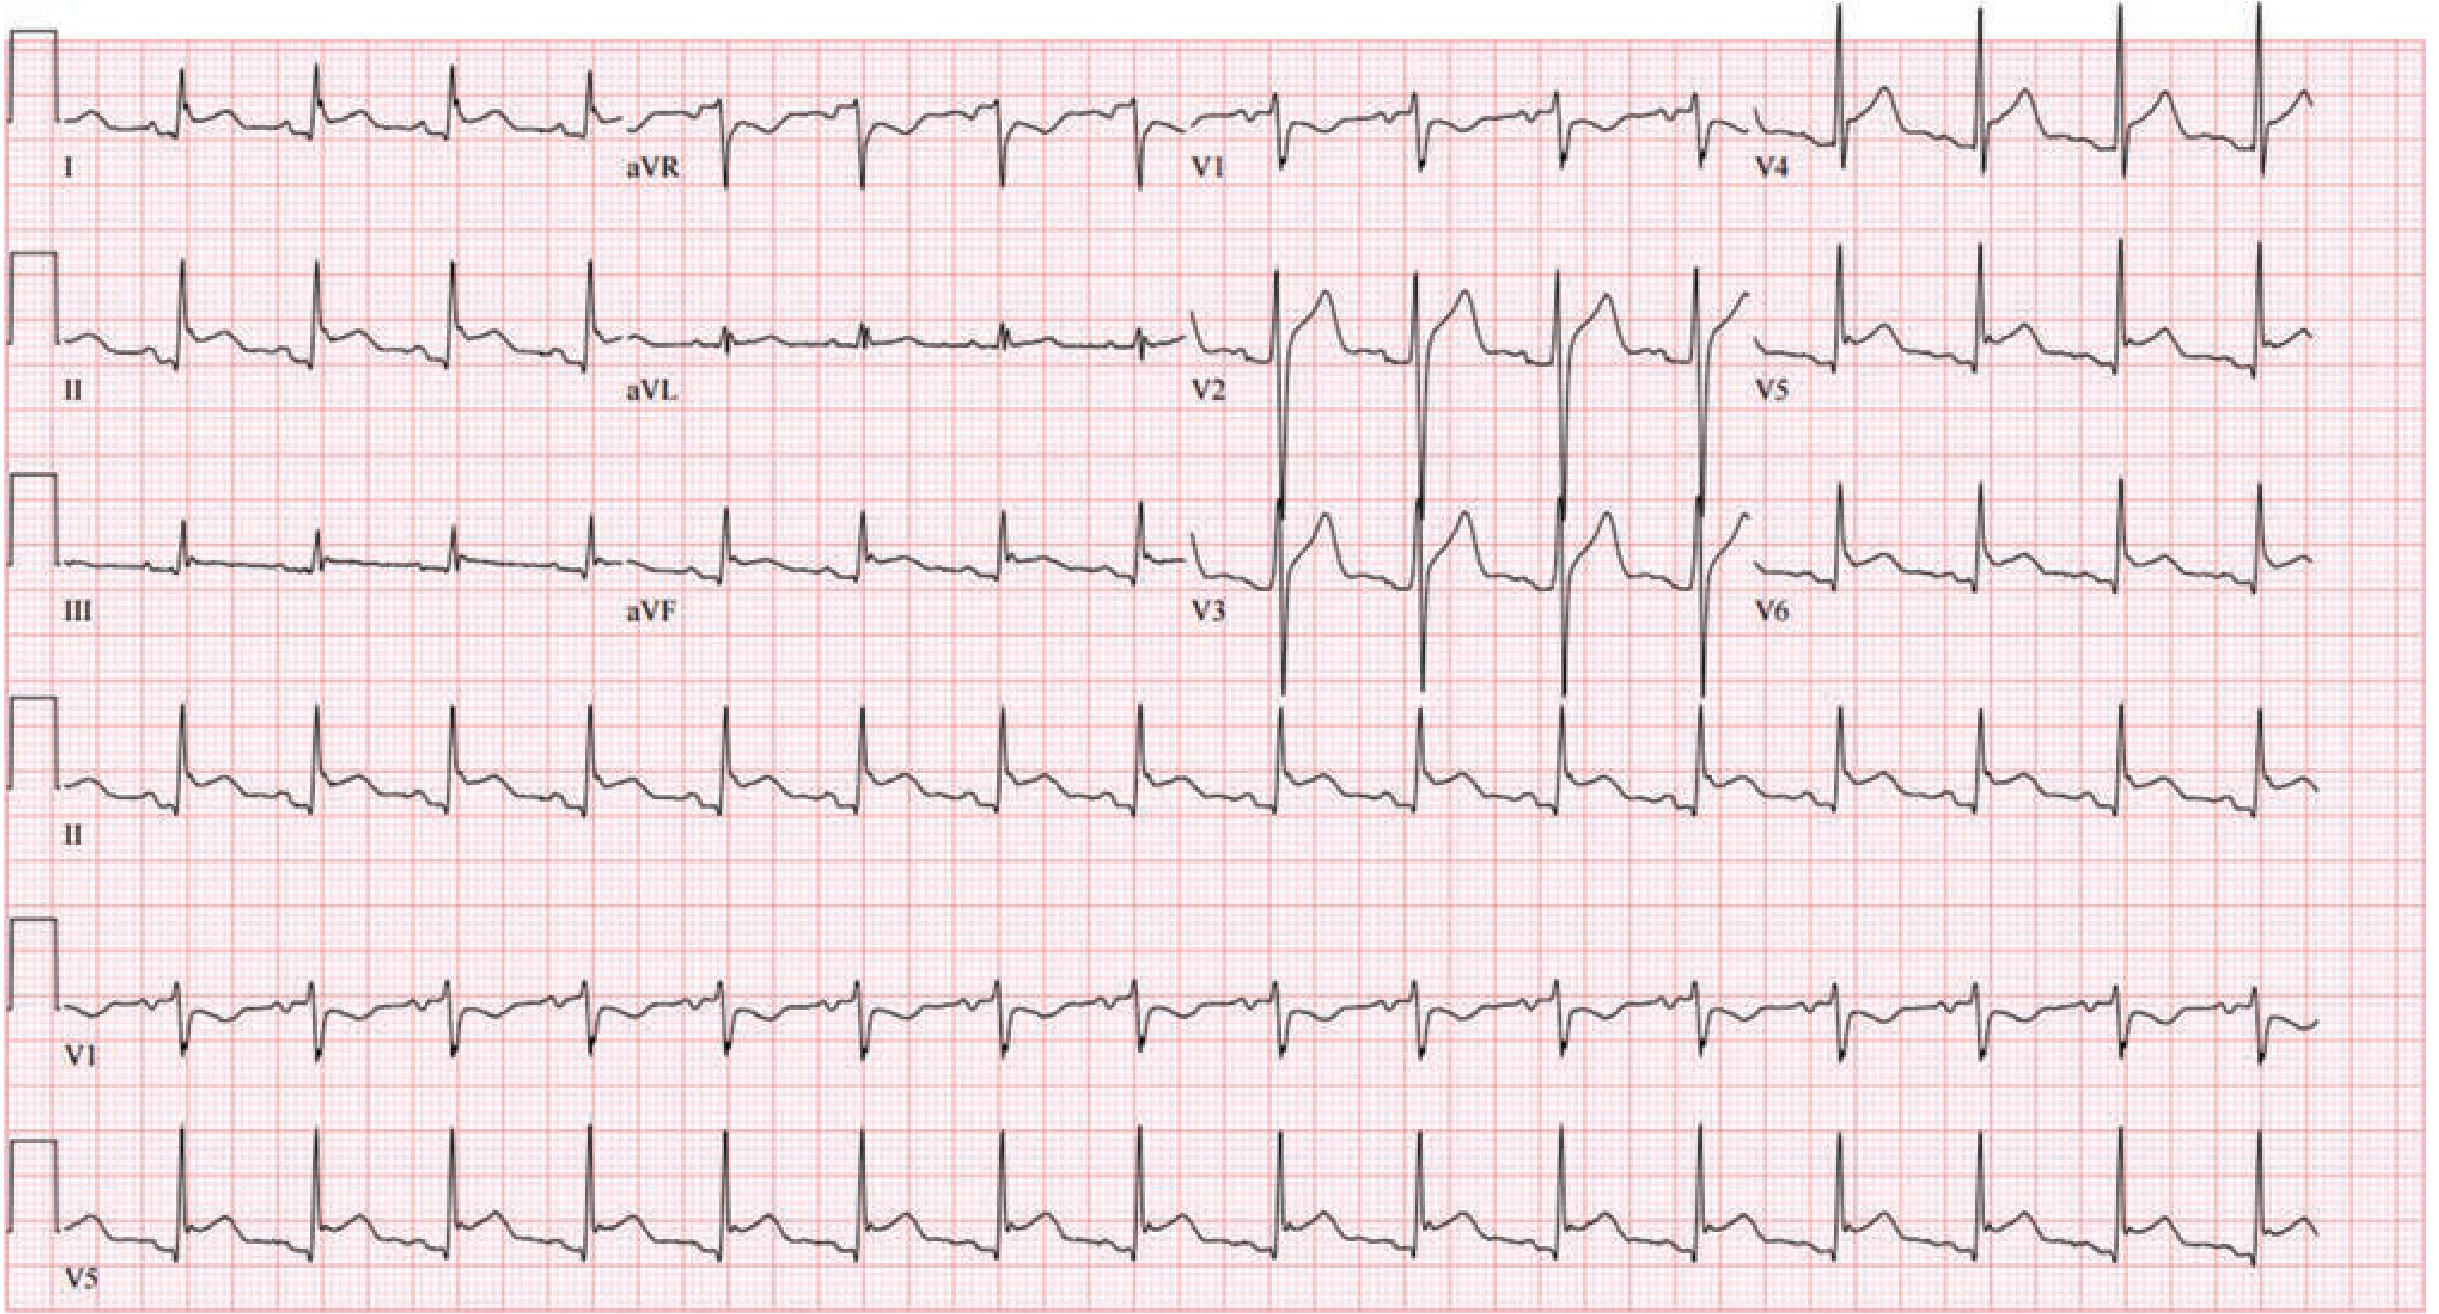
Mechanism: Inflammation of the pericardium causes current spread affecting adjacent myocardium (pericardium itself is electrically silent). This creates diffuse, non-territory-specific changes unlike the focal ST elevation of STEMI.
ECG Changes - Four Classical Stages:
| Stage | Timing | Changes |
|---|---|---|
| 1 | Hours to days | Diffuse ST elevation (concave/saddle-shaped) in nearly all leads + PR depression (in all leads except aVR, where there is PR elevation + ST depression) |
| 2 | Days | ST and PR return to baseline |
| 3 | 1-3 weeks | Diffuse T-wave inversions |
| 4 | Weeks-months | ECG normalizes |
Key distinguishing features from STEMI:
- ST elevation is diffuse (not territory-specific), concave upward (not convex/tombstone)
- PR depression is present (almost never in STEMI)
- No reciprocal ST depression (except aVR)
- No Q waves
Acute Pericarditis 12-lead ECG (Stage 1):
6. AV Heart Block (1°, 2°, 3°)
Mechanism: Impaired conduction through the AV node or His-Purkinje system, classified by degree of conduction failure.
ECG Changes:
First-Degree AV Block:
- PR interval prolonged >200 ms (5 small squares)
- All P waves conduct; no dropped beats
- Usually benign; may indicate inferior MI, digoxin toxicity, increased vagal tone
Second-Degree AV Block:
- Mobitz Type I (Wenckebach): Progressive lengthening of PR interval until one P wave fails to conduct (dropped QRS); groups of beats; RR shortens before the dropped beat; typically at AV node level; usually benign
- Mobitz Type II: Fixed PR interval with sudden dropped QRS (no progressive lengthening); QRS typically wide; infranodal block; high risk of progression to complete block - requires pacing
Third-Degree (Complete) AV Block:
- Complete AV dissociation: P waves and QRS complexes march independently
- Atrial rate faster than ventricular rate
- Ventricular escape rhythm: narrow (nodal, ~40-60 bpm) or wide (ventricular, <40 bpm)
- Symptoms: Stokes-Adams attacks (syncope), bradycardia, heart failure
The blood supply to the AV node arises from the right coronary artery in 80-90% of people; inferior MI is the most common cause of acquired complete heart block. (Harrison's, p. block28)
7. Left Ventricular Hypertrophy (LVH)
Mechanism: Increased left ventricular mass (from hypertension, aortic stenosis, HCM) increases the magnitude of LV depolarization vectors.
ECG Changes:
- Voltage criteria (Sokolow-Lyon): S in V1 + R in V5 or V6 ≥ 35 mm; or R in aVL ≥ 11 mm; or R in I + S in III ≥ 25 mm
- Strain pattern (repolarization abnormality): downsloping ST depression with asymmetric T-wave inversion in I, aVL, V5-V6 (lateral leads)
- Left axis deviation (beyond -30°)
- Prolonged intrinsicoid deflection in V5-V6 (>50 ms)
- Left atrial enlargement: bifid P wave in lead II (P mitrale), terminal negative P in V1
Note: LVH voltage + strain pattern together have higher specificity than voltage alone. ST elevation in V1-V2 in LVH can mimic anterior STEMI.
8. Ventricular Tachycardia (VT)
Mechanism: Reentrant circuit or abnormal automaticity arising from the ventricles, bypassing the normal His-Purkinje system, causing wide-complex depolarization.
ECG Changes:
- Wide QRS complexes (>120 ms), regular rhythm, rate typically 100-250 bpm
- AV dissociation - P waves march independently through the tachycardia (pathognomonic when visible)
- Capture beats - a normally narrow QRS appearing during tachycardia (AV node transiently captures the ventricle)
- Fusion beats - hybrid morphology between normal and VT complex
- Extreme axis deviation ("northwest axis" or no-man's land: aVR positive, I and aVF both negative)
- Concordance: all precordial leads positive or all negative (positive concordance suggests WPW; negative concordance is highly specific for VT)
Distinguishing VT from SVT with aberrancy:
- AV dissociation, fusion/capture beats, northwest axis, very wide QRS (>160 ms), and precordial concordance all favor VT
- When in doubt, treat as VT (Goldman-Cecil)
Polymorphic VT (Torsades de Pointes):
- Occurs with prolonged QT interval (long QT syndrome, drug toxicity)
- ECG shows rotating QRS axis that "twists around the baseline"
- Associated with drugs that prolong QT (macrolides, fluoroquinolones, antipsychotics, antiarrhythmics - see Table 130-5 in Tintinalli's)
9. Long QT Syndrome (LQTS)
Mechanism: Inherited or acquired dysfunction of cardiac ion channels prolongs ventricular repolarization, creating a substrate for triggered arrhythmias (Torsades de Pointes) and sudden death.
ECG Changes:
- Prolonged QTc interval - corrected QT >440 ms in men, >460 ms in women (Bazett formula: QTc = QT / √RR)
- Abnormal T-wave morphology - notched T waves, bifid T waves, prominent U waves
- T-wave alternans - beat-to-beat variation in T-wave amplitude (precedes TdP)
- Long-short RR sequence - short-long-short initiating Torsades (typical of acquired LQTS)
Causes of acquired QT prolongation (Tintinalli's Table 130-5):
- Class IA/III antiarrhythmics (quinidine, sotalol)
- Macrolide antibiotics (azithromycin, erythromycin)
- Fluoroquinolones
- Antipsychotics (haloperidol, quetiapine)
- Electrolyte abnormalities: hypokalemia, hypomagnesemia
Inherited forms: LQTS1 (KCNQ1 mutation - triggered by exercise/swimming), LQTS2 (KCNH2 - triggered by auditory stimuli), LQTS3 (SCN5A - during sleep)
10. Pulmonary Embolism (PE)
Mechanism: Massive PE causes acute right ventricular pressure overload, right heart dilation, and rightward shift of depolarization vectors. ECG is often nonspecific but reflects acute cor pulmonale.
ECG Changes:
- Sinus tachycardia - most common finding (~40% of cases)
- S1Q3T3 pattern - S wave in lead I + Q wave in lead III + inverted T in lead III (classic but only in ~20%)
- Right bundle branch block (RBBB) - complete or incomplete; RSR' in V1, wide S in V5-V6
- Right axis deviation
- T-wave inversions in V1-V4 (right heart strain pattern - more sensitive and specific than S1Q3T3)
- Atrial fibrillation - in 10-35% of cases
- Peaked P waves in lead II (P pulmonale - right atrial enlargement)
- Electrical alternans - suggests large pericardial effusion or severe cardiac strain
- Low voltage or nonspecific ST-T changes
Normal ECG does NOT exclude PE - approximately 30% of cases have a near-normal ECG.
Quick Reference Summary Table
| Disease | Key ECG Findings |
|---|---|
| STEMI | ST elevation (convex), reciprocal ST depression, Q waves, hyperacute T waves |
| NSTEMI/UA | ST depression (horizontal/downsloping), T-wave inversions, no Q waves |
| Atrial Fibrillation | Absent P waves, irregularly irregular rhythm, fibrillatory baseline |
| WPW | Short PR, delta wave, wide QRS, orthodromic or antidromic tachycardia |
| Acute Pericarditis | Diffuse concave ST elevation, PR depression (all leads), no reciprocal changes |
| AV Heart Block | Prolonged PR (1°), dropped beats ± PR lengthening (2°), AV dissociation (3°) |
| LVH | High voltage, lateral strain pattern, left axis deviation |
| Ventricular Tachycardia | Wide QRS, regular, AV dissociation, fusion/capture beats, concordance |
| Long QT Syndrome | Prolonged QTc, notched/bifid T waves, Torsades de Pointes |
| Pulmonary Embolism | Sinus tachycardia, S1Q3T3, RBBB, right axis deviation, V1-V4 T inversions |
Sources:
- Harrison's Principles of Internal Medicine 22E (2025), Chapters 247, 252, 256
- Tintinalli's Emergency Medicine: A Comprehensive Study, Chapters 49, 130
- Fuster and Hurst's The Heart 15E, Chapter 53
- Braunwald's Heart Disease, Chapters 7, 12
- Goldman-Cecil Medicine, Chapters 49, 51, 52, 62
- Ganong's Review of Medical Physiology 26E, Chapter 29
This is a shared conversation. Sign in to Orris to start your own chat.