
from Guyton and Hall textbook of medical physiology, 4th South Asia edition, write a 5-mark short note on Oxygen-Hemoglobin Dissociation Curve draw,label,factors affecting, Bohr's Effect,factors shifting curve to right ,what is P50, role of 2,3-BPG
Reading File
Finding Sources
Finding Sources
Finding Sources
Finding Sources
Reading File
Loading Image
Reading File
Reading File
Reading File
Reading File
Finding Sources
Loading Image
I now have all the content needed directly from Guyton and Hall. Here is the complete 5-mark short note:
Oxygen-Hemoglobin Dissociation Curve
(Guyton and Hall Textbook of Medical Physiology, 4th South Asia Edition)
The Curve - Draw and Label
The O2-hemoglobin dissociation curve is a sigmoid (S-shaped) curve that plots the percentage saturation of hemoglobin (y-axis) against the partial pressure of oxygen in blood - PO2 (x-axis, in mm Hg):
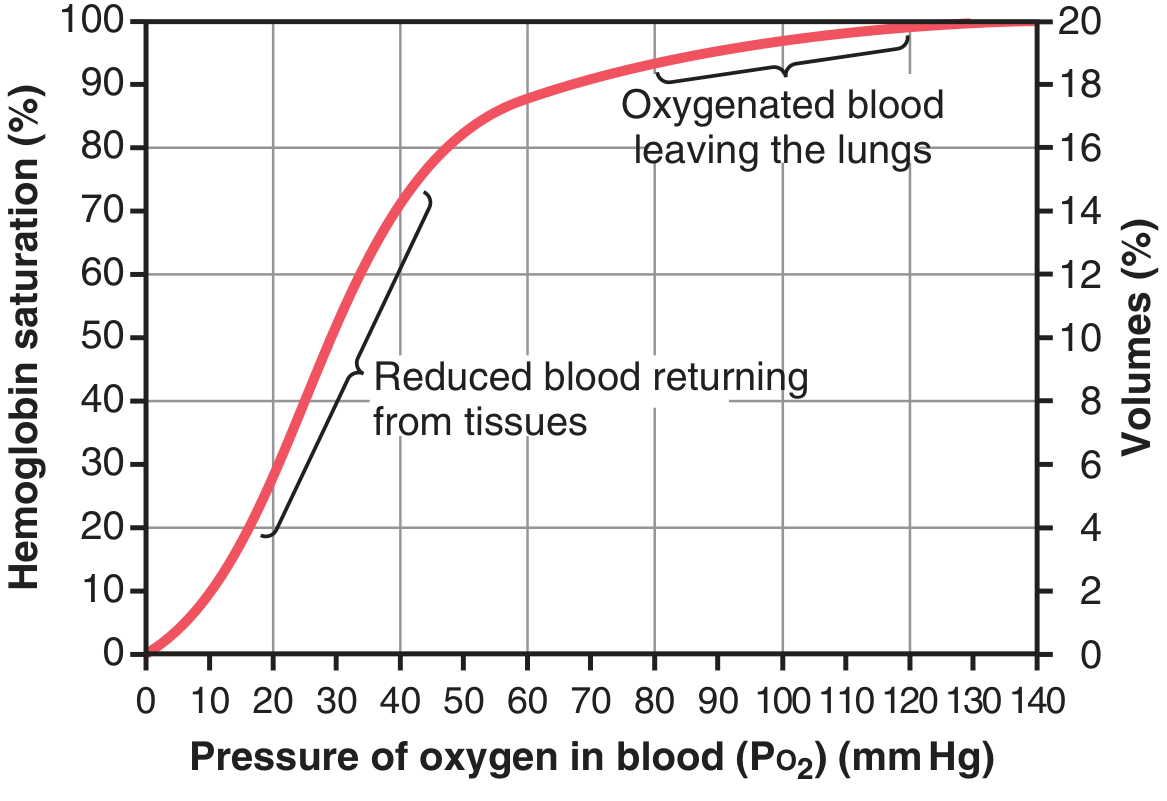
Key labeled points:
| Point | PO2 (mm Hg) | Hb Saturation | Significance |
|---|---|---|---|
| Arterial blood (lungs) | ~95 mm Hg | 97% | Oxygenated blood leaving lungs |
| Venous blood (tissues) | ~40 mm Hg | 75% | Reduced blood returning from tissues |
| 100% saturation | ~120 mm Hg | 100% | Maximum loading |
- At PO2 = 104 mm Hg (alveoli), Hb is ~97% saturated
- At PO2 = 40 mm Hg (tissues), Hb drops to ~75% saturated
- About 5 mL O2 is released per 100 mL blood under normal conditions
- Maximum O2-carrying capacity = 20.1 mL/100 mL blood (15 g Hb × 1.34 mL O2/g)
The sigmoid shape arises from cooperative binding: each O2 molecule bound to hemoglobin increases the affinity for the next molecule.
Factors Affecting the Curve
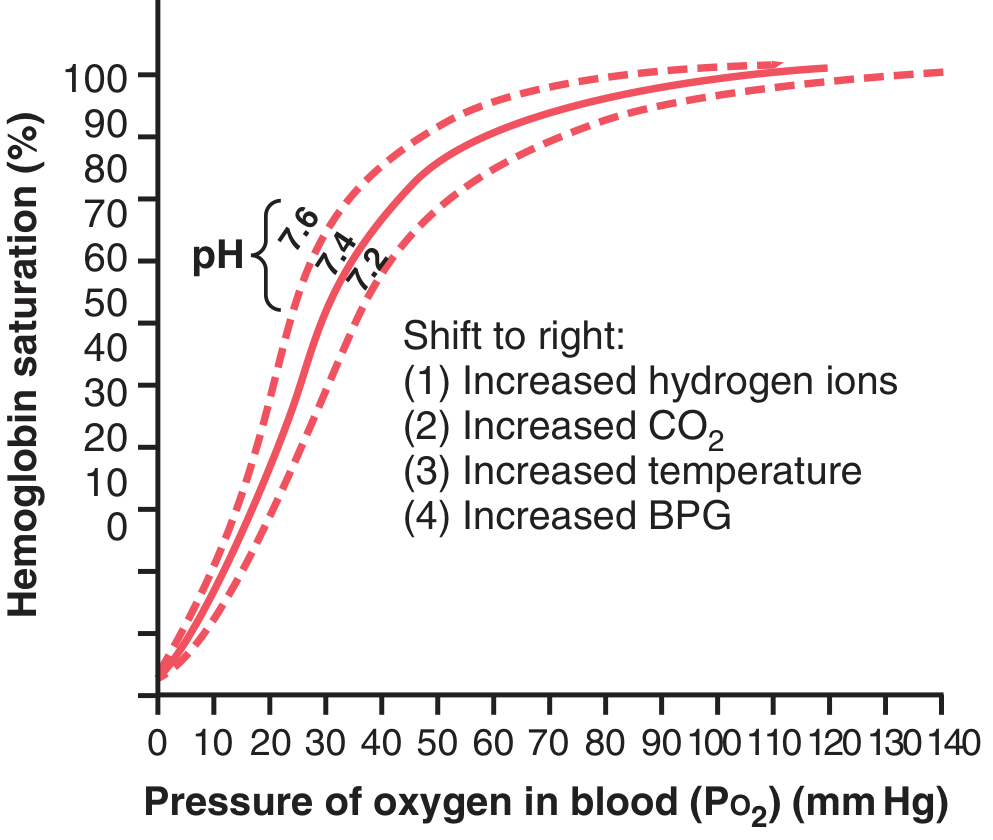
Several factors shift the curve, as shown in Fig. 41.10:
Bohr Effect
"A shift of the oxygen-hemoglobin dissociation curve to the right in response to increases in blood CO2 and H+ levels enhances the release of O2 from the blood in the tissues and enhances oxygenation of the blood in the lungs."
- Guyton & Hall, p. 526
Mechanism:
- As blood flows through tissues, CO2 diffuses from cells into blood
- This raises blood PCO2, forming H2CO3, and increases H+ concentration
- The increased CO2 and H+ shift the O2-Hb dissociation curve to the right and downward
- This forces O2 away from hemoglobin, delivering increased O2 to tissues
In the lungs - the reverse: CO2 diffuses out into alveoli, PCO2 and H+ fall, curve shifts left and upward, allowing more O2 to bind hemoglobin at any given alveolar PO2.
This bidirectional effect - rightward shift in tissues, leftward shift in lungs - greatly enhances O2 delivery.
Factors Shifting Curve to the RIGHT
A rightward shift means decreased affinity of Hb for O2 - more O2 is unloaded at tissues. The four factors are:
| Factor | Effect |
|---|---|
| Increased H+ (decreased pH) | pH 7.4 → 7.2 shifts curve ~15% to right |
| Increased CO2 | Both direct effect and via H+ formation |
| Increased temperature | Exercising muscle heat causes rightward shift |
| Increased 2,3-BPG | Allosteric effect, important in hypoxia adaptation |
Mnemonic: "CADET face RIGHT" - CO2, Acid, DPG (2,3-BPG), Exercise, Temperature
(Opposite factors - decreased CO2, increased pH, decreased temperature, decreased BPG - shift the curve to the LEFT, increasing Hb affinity for O2.)
P50
P50 is defined as the partial pressure of oxygen at which hemoglobin is 50% saturated with O2.
- Normal P50 = 26-27 mm Hg (at pH 7.4, 37°C)
- P50 is a measure of hemoglobin's affinity for oxygen:
- Increased P50 (curve shifted right) = decreased affinity for O2 = more O2 unloaded to tissues
- Decreased P50 (curve shifted left) = increased affinity = O2 held more tightly by Hb
P50 is clinically used to compare the oxygen affinity in different conditions (e.g., stored blood has high 2,3-BPG depletion leading to low P50 = poor O2 delivery).
Role of 2,3-Biphosphoglycerate (2,3-BPG)
"The normal BPG in the blood always keeps the O2-hemoglobin dissociation curve shifted slightly to the right."
- Guyton & Hall, p. 526
Key facts:
-
Normal role: 2,3-BPG is a metabolic intermediate (from glycolysis) present in red blood cells. It binds to the beta chains of deoxyhemoglobin and reduces Hb's affinity for O2, maintaining a slight rightward shift under normal conditions.
-
In hypoxia: When hypoxic conditions last longer than a few hours, BPG concentration in the blood increases considerably, shifting the dissociation curve even farther to the right. This causes O2 to be released to tissues at up to 10 mm Hg higher tissue O2 pressure than would otherwise be possible.
-
Adaptive significance: The BPG mechanism is important for adaptation to hypoxia, especially in states of poor tissue blood flow (e.g., chronic anemia, high altitude, heart failure).
-
Stored blood: Blood stored in blood banks has progressively depleted 2,3-BPG, so the curve shifts left, making Hb hold O2 tightly. This impairs O2 delivery to tissues on transfusion, which is why fresh blood is preferred in critical illness.
-
Fetal hemoglobin (HbF): Binds 2,3-BPG less avidly than adult Hb, so HbF has a leftward dissociation curve and higher O2 affinity - this helps the fetus extract O2 from maternal blood.
Summary Table
| Parameter | Normal Value | Rightward Shift | Leftward Shift |
|---|---|---|---|
| pH | 7.4 | Acidosis (↓pH) | Alkalosis (↑pH) |
| PCO2 | 40 mm Hg | ↑ CO2 | ↓ CO2 |
| Temperature | 37°C | ↑ Temp | ↓ Temp |
| 2,3-BPG | Normal | ↑ BPG (hypoxia) | ↓ BPG (stored blood) |
| Hb affinity for O2 | - | Decreased | Increased |
| P50 | 26-27 mm Hg | Increased | Decreased |
| O2 delivery to tissues | Normal | Enhanced | Impaired |
Source: Guyton and Hall Textbook of Medical Physiology, 4th South Asia Edition, Chapter 41, pp. 524-527
This is a shared conversation. Sign in to Orris to start your own chat.