
MYOCARDIAL INFARCTION NOTES FOR LONG ANSWER QUESTION
myocardial infarction pathology gross microscopic changes
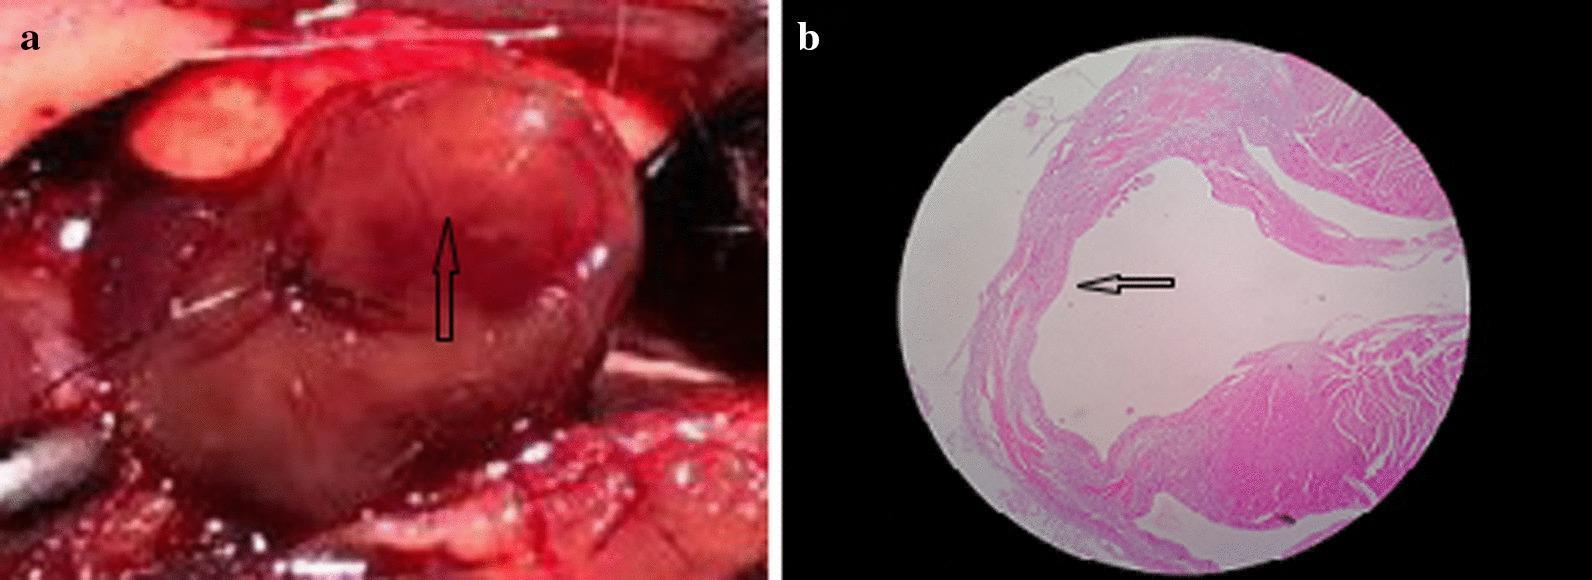
This composite educational material presents the macroscopic and microscopic features of myocardial infarction following surgical ligation of the left anterior descending (LAD) artery in a mouse model. Panel A is a clinical photograph (gross specimen) of the heart during a surgical procedure. It demonstrates an area of myocardial whitening (pallor) distal to the ligation line, indicated by a black arrow. This visual change represents acute ischemia and initial tissue necrosis. Panel B shows a diagnostic histopathology image of the heart stained with Hematoxylin-Eosin (HE). The cross-section reveals structural changes in the ventricular wall. A black arrow points to an area of significant myocardium thinning, a hallmark of remodeling and tissue loss following infarction. The pink-stained eosinophilic regions highlight the remaining muscular architecture, while the structural thinning indicates the progression of the injury. Together, these images illustrate the correlation between macroscopic ischemic signs (whitening) and microscopic structural pathology (wall thinning) in the context of cardiovascular research and ischemic heart disease models.
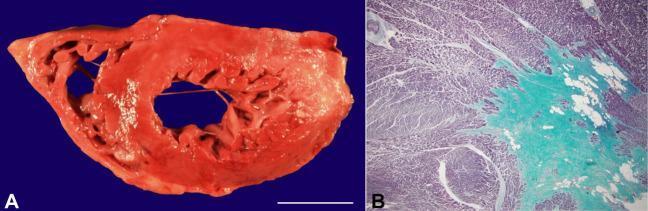
This composite educational resource demonstrates the pathology of chronic myocardial infarction through gross and microscopic examination. Image A is a clinical photograph showing a fresh transverse section of the human heart at the ventricular level. The myocardium exhibits a predominantly reddish-brown hue with visible transmural thinning and whitish, fibrotic scarring in the lateral and posterior walls of the left ventricle. A focal area of subendocardial fibrosis is also visible in the anterior ventricle. A 3 cm scale bar is included for morphometric reference. Image B is a light microscopy image at 20x magnification using Gomori trichrome stain, which highlights tissue composition. The viable cardiomyocytes are stained reddish-purple, while dense collagenous scar tissue (fibrosis) is stained bright blue-green, illustrating the replacement of necrotic muscle fibers with connective tissue. This finding is characteristic of a remote or healed myocardial infarct. This material is suitable for cardiovascular pathology education, illustrating the progression from myocardial injury to permanent scarring and ventricular remodeling.
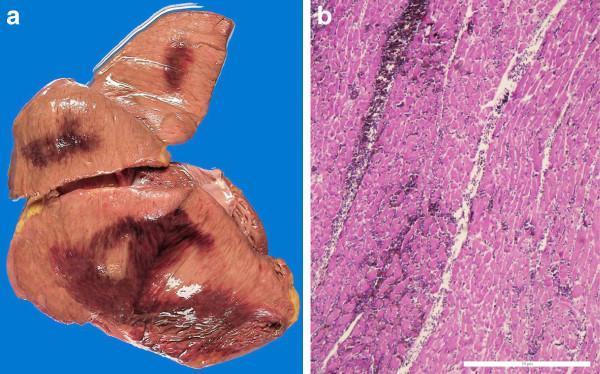
This dual-panel image demonstrates macroscopic and microscopic pathology of acute myocardial infarction with hemorrhagic components. Panel (a) is a clinical photograph of tangential slices from an unfixed human heart, specifically the posterior wall of the left ventricle. It reveals large, irregularly shaped, dark red-to-purple hemorrhagic areas measuring approximately 4 cm x 3 cm and 5 cm x 7 cm, contrasting sharply against the lighter tan-colored myocardium. Panel (b) shows a corresponding histological section stained with Hematoxylin and Eosin (H&E) at 4x magnification. The micrograph depicts eosinophilic (pink) cardiomyocytes with visible structural disruption, including areas of contraction band necrosis and loss of nuclei. Notable pathological features include a prominent longitudinal band of hemorrhage and leukocyte infiltration, which serves to demarcate the necrotic zone from vital muscle. These findings are characteristic of hemorrhagic myocardial infarction and suggest an acute ischemic event followed by vascular rupture or reperfusion injury. The image is intended for medical education in cardiology and pathology to illustrate gross and microscopic signs of myocardial death.
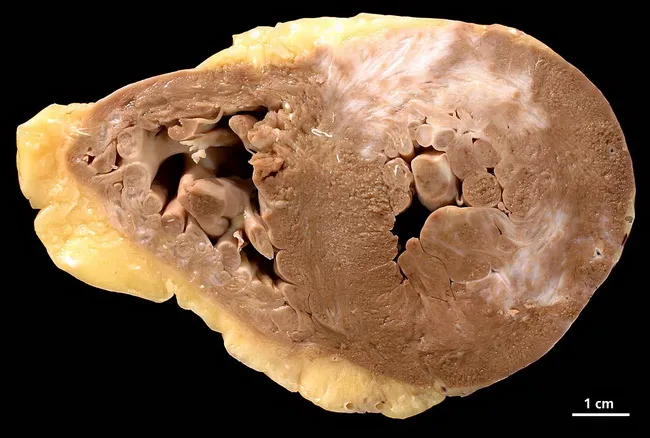
Gross pathology image of a human heart cross-section (short-axis/transverse) from a 73-year-old female with a history of arterial hypertension, chronic smoking, and three-vessel coronary artery disease. The specimen reveals chronic myocardial infarction scar throughout the myocardium with areas of subacute necrosis on both ventricles. The ventricles show concentric hypertrophy characterized by thickened ventricular walls and reduced cavity size, consistent with long-standing pressure overload. On cut surface, extensive fibrous replacement tissue is seen in the LV and RV walls, with pale, firm areas indicating scar tissue; endocardial surfaces may show thinning in infarcted zones. The presence of bilateral ventricular involvement suggests diffuse ischemic injury, possibly past infarcts with replacement fibrosis. The gross morphology corresponds to ischemic cardiomyopathy spectrum; pathophysiology includes atherosclerotic CAD, hypertension-induced hypertrophy, and chronic subendocardial ischemia. This combination results in remodeling and scar formation, predisposing to arrhythmias and heart failure. The image is from pathorama.ch, illustrating classic post-infarction changes: myocardial scar, subacute necrosis, and hypertrophic remodeling. Clinically, such pathology would correlate with prior chest pain episodes, elevated troponin in the past, and radiographic evidence of cardiomegaly; autopsy or pathology reporting would emphasize chronic infarct burden, LV dysfunction, and risk stratification for sudden cardiac death. Suitable for education on myocardial infarction progression and necrosis patterns.
ECG changes myocardial infarction ST elevation Q wave
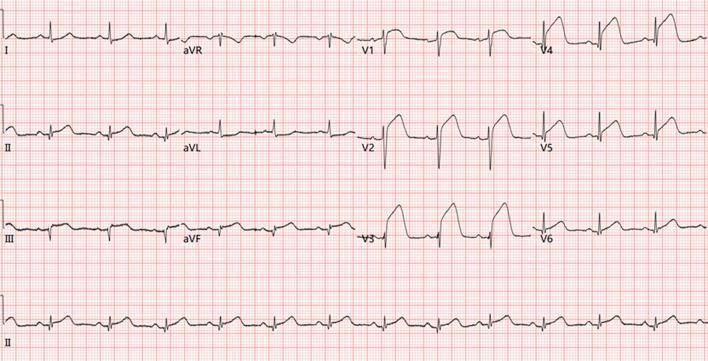
This diagnostic image is a 12-lead electrocardiogram (ECG) demonstrating an acute ST-segment elevation myocardial infarction (STEMI) with extensive involvement. The tracing reveals significant ST-segment elevation in the inferior leads (II, III, and aVF) and the precordial leads (V1 through V5), indicating a combined anterior and inferior wall infarction pattern. Prominent pathological Q-waves are visible in the limb leads I, II, III, and aVF, signifying established myocardial necrosis or a prior infarctive event in those territories. The precordial leads show a 'tombstoning' morphology of the ST segments, particularly from V2 to V4, where the ST elevation merges directly with the T-waves. These findings are consistent with massive myocardial ischemia and infarction, typically necessitating urgent reperfusion therapy. The ECG serves as an educational tool for identifying multivessel or proximal coronary artery occlusion patterns and the evolution of ischemic changes from Q-wave formation to acute ST-segment deviation.
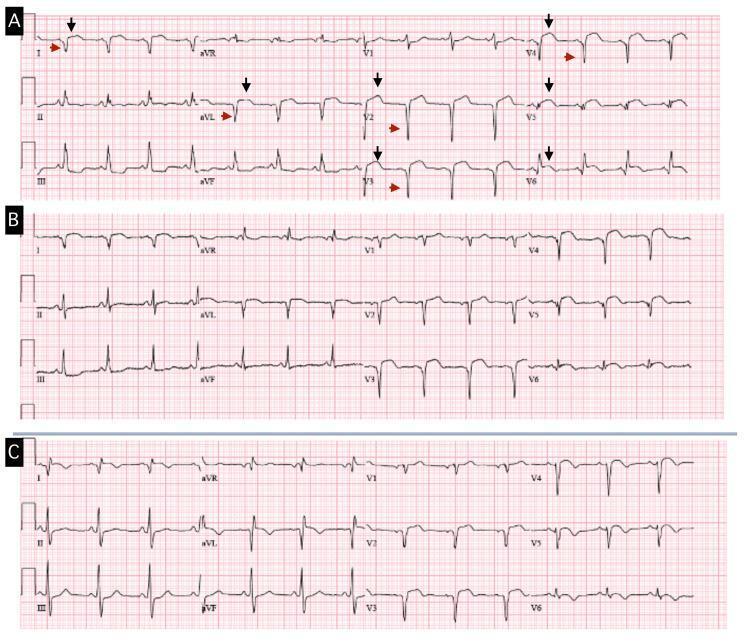
Comparison of three 12-lead electrocardiograms (ECGs) labeled A, B, and C, documenting the progression and persistence of ischemic changes. ECG A, the admission tracing, shows prominent anterolateral ST-segment elevations (2-3 mm) in leads V2-V6, I, and aVL (indicated by black arrows). Significant pathologic QS waves (indicated by red arrows) are visible in leads V2-V4, I, and aVL, while leads V5 and V6 maintain a residual R-wave. This pattern is characteristic of a late-presenting transmural myocardial infarction or a resulting ventricular aneurysm/scar. Tracings B (follow-up) and C (second admission with confirmed left ventricular pseudoaneurysm) demonstrate the persistence of these ST-segment elevations and QS waves without significant morphological evolution over time. The persistent ST elevation in the presence of well-developed Q waves is a classic electrocardiographic sign of ventricular wall dyskinesis or aneurysm formation following an extensive ST-elevation myocardial infarction (STEMI).
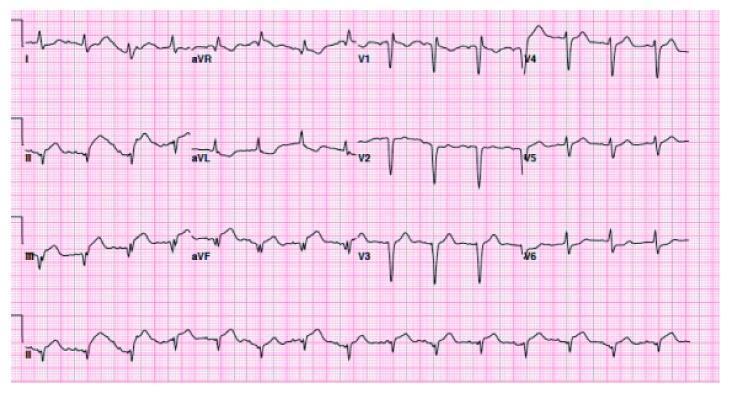
This diagnostic image is a 12-lead electrocardiogram (ECG) demonstrating acute ST-segment elevation myocardial infarction (STEMI) patterns. The primary visual abnormality is significant ST-segment elevation (approximately 2.5–3 mm) in the inferior leads (II, III, and aVF). The morphology of the ST segments is convex ('tombstoning') and transitions into upright, prominent T waves. Reciprocal ST-segment depression is visible in the lateral lead aVL. The rhythm is regular and appears to be a normal sinus rhythm with identifiable P waves preceding each narrow QRS complex. There are also deep Q waves present in the inferior leads, suggesting an established or previous inferior wall injury. Precordial leads (V1-V6) show relatively deep S waves and some T-wave flattening, consistent with left ventricular hypertrophy or secondary changes. This tracing is clinically significant for diagnosing an acute inferior STEMI, often associated with right coronary artery (RCA) or left circumflex (LCx) occlusion. It serves as a key educational example for interpreting acute ischemic changes and reciprocal findings on a standard 12-lead ECG.
MYOCARDIAL INFARCTION - Long Answer Question Notes
1. DEFINITION
- Commonly referred to as a "heart attack"
- Nearly 800,000 MIs occur in the United States per year (approximately one every 40 seconds), causing ~400,000 deaths annually
- 10% occur before age 40; 45% before age 65
- Males at higher risk than females, though this gap narrows with age
- Women are protected during reproductive years (estrogen); menopause worsens risk
- Post-menopausal hormone replacement therapy is NOT protective and may be detrimental (pro-thrombotic effect)
2. ETIOLOGY & RISK FACTORS
- Hypertension
- Dyslipidaemia (elevated LDL, low HDL)
- Diabetes mellitus
- Smoking
- Obesity / metabolic syndrome
- Family history / genetic predisposition
- Age and male sex
- Coronary vasospasm (with or without atherosclerosis) - can be triggered by cocaine, ephedrine, or platelet aggregation
- Embolism - from left atrial mural thrombus (in AF), infective endocarditis vegetations, intracardiac prosthetics, or paradoxical embolism via patent foramen ovale
- Small vessel disease - vasculitis, amyloid deposition in vessel walls
- Haematological disorders - sickle cell disease, hypercoagulable states
- Demand ischemia (Type 2 MI) - severe fixed stenosis + prolonged tachycardia or hypotension, causing subendocardial necrosis
3. PATHOGENESIS
3a. Coronary Artery Occlusion - The Sequence
- An atheromatous plaque is disrupted - by endothelial injury, intraplaque hemorrhage, or mechanical forces - exposing subendothelial collagen and necrotic plaque contents to blood
- Platelets adhere, aggregate, and activate, releasing thromboxane A2, ADP, and serotonin - causing further platelet aggregation and vasospasm
- Coagulation cascade is activated by tissue factor exposure, adding to the growing thrombus
- Within minutes, the enlarging thrombus may completely occlude the coronary artery lumen
3b. Myocardial Response to Ischemia
- Loss of ATP → failure of Na+/K+-ATPase → cellular swelling
- Loss of contractility within seconds
- Glycogen depletion
- Mitochondrial swelling (electron microscopy)
- Sarcolemmal disruption
- Mitochondrial amorphous (flocculent) densities - calcium phosphate deposits
- Loss of membrane integrity → enzyme leakage into blood
- Nuclear changes (pyknosis, karyolysis)
3c. Wavefront Phenomenon
- Necrosis begins in the subendocardium (most vulnerable - farthest from epicardial vessels, highest wall stress)
- Progresses toward the epicardium over 3-6 hours
- This is why early reperfusion (within 1-2 hours) can limit infarct size
4. TYPES OF MI
| Type | Description |
|---|---|
| Transmural | Full-thickness necrosis; usually from complete coronary occlusion; associated with STEMI |
| Subendocardial (NSTEMI) | Inner 1/3 to 1/2 of ventricular wall; incomplete occlusion or demand ischemia |
| STEMI | ST-elevation MI - occlusive thrombus; urgent reperfusion required |
| NSTEMI | Non-ST-elevation MI - non-occlusive or partial occlusion |
5. TERRITORY OF INFARCTION
| Artery Occluded | Territory Infarcted | ECG Leads |
|---|---|---|
| LAD (Left Anterior Descending) | Anterior wall, anterior septum, apex (~40-50% of LV) | V1-V4 |
| RCA (Right Coronary Artery) | Inferior wall, posterior wall, RV, AV node | II, III, aVF |
| LCx (Left Circumflex) | Lateral wall, posterior wall | I, aVL, V5-V6 |
- LAD occlusion is the most common cause of MI
- RCA occlusion causes inferior MI; may impair AV node (bradycardia, heart block)
6. MORPHOLOGICAL CHANGES (TIME-BASED PROGRESSION)
| Time | Gross Changes | Light Microscopy | Electron Microscopy |
|---|---|---|---|
| 0-0.5 hr (Reversible) | None | None | Relaxation of myofibrils; glycogen loss; mitochondrial swelling |
| 0.5-4 hr | None | Usually none; wavy fibers at border | Sarcolemmal disruption; mitochondrial amorphous densities |
| 4-12 hr | Dark mottling (occasional) | Early coagulative necrosis; oedema; haemorrhage | - |
| 12-24 hr | Dark mottling | Coagulative necrosis; pyknosis of nuclei; myocyte hypereosinophilia; marginal contraction band necrosis; early neutrophilic infiltrate | - |
| 1-3 days | Mottling with yellow-tan centre | Coagulative necrosis with loss of nuclei and striations; brisk neutrophilic infiltrate | - |
| 3-7 days | Hyperaemic border; yellow-tan softening | Disintegration of dead myofibers; dying neutrophils; early macrophage phagocytosis; early granulation tissue at border | - |
| 7-10 days | Maximally yellow-tan and soft; depressed margins | Well-developed phagocytosis; granulation tissue at margins | - |
| 10-14 days | Red-gray depressed borders | Well-established granulation tissue with new blood vessels and collagen deposition | - |
| 2-8 weeks | Gray-white scar, progressing from border to centre | Fibrosis increasing | - |
| >2 months | Firm, contracted scar | Dense fibrous scar | - |
7. CLINICAL FEATURES
Symptoms
- Chest pain - severe, crushing, "pressure-like," substernal; radiates to left arm, jaw, neck, or epigastrium
- Duration >30 minutes (unlike angina, not relieved by rest/nitrates)
- Nausea and vomiting
- Diaphoresis (cold, clammy sweat)
- Breathlessness (dyspnoea) - due to LV failure
- Palpitations - arrhythmias
- Syncope - from arrhythmia or haemodynamic compromise
- Silent MI (especially in diabetics and elderly) - no chest pain; presents with dyspnoea, confusion, or sudden death
Signs
- Anxiety, pallor, sweating
- Tachycardia (or bradycardia if inferior MI with vagal response)
- Hypotension (cardiogenic shock if severe)
- S3/S4 gallop (LV dysfunction)
- Pericardial friction rub (2-3 days after STEMI if pericarditis develops)
- Signs of pulmonary oedema (crackles, elevated JVP)
- Signs of RV failure with inferior MI (raised JVP, peripheral oedema)
8. INVESTIGATIONS
A. Electrocardiogram (ECG)
| Defect in Infarcted Cells | Current Flow | ECG Change (leads over infarct) |
|---|---|---|
| Rapid repolarization | Out of infarct | ST segment elevation |
| Decreased resting membrane potential | Into infarct | TQ segment depression (recorded as ST elevation) |
| Delayed depolarization | Out of infarct | ST segment elevation |
- Hyperacute T-waves (tall peaked T-waves) - earliest change, minutes
- ST segment elevation (>1mm in ≥2 contiguous limb leads; >2mm in ≥2 contiguous precordial leads)
- Q waves (pathological - width >40ms, depth >1/4 R wave) - develops over hours to days; indicates established necrosis
- T-wave inversion - evolves over days
- Persistent ST elevation - may indicate ventricular aneurysm
B. Cardiac Biomarkers
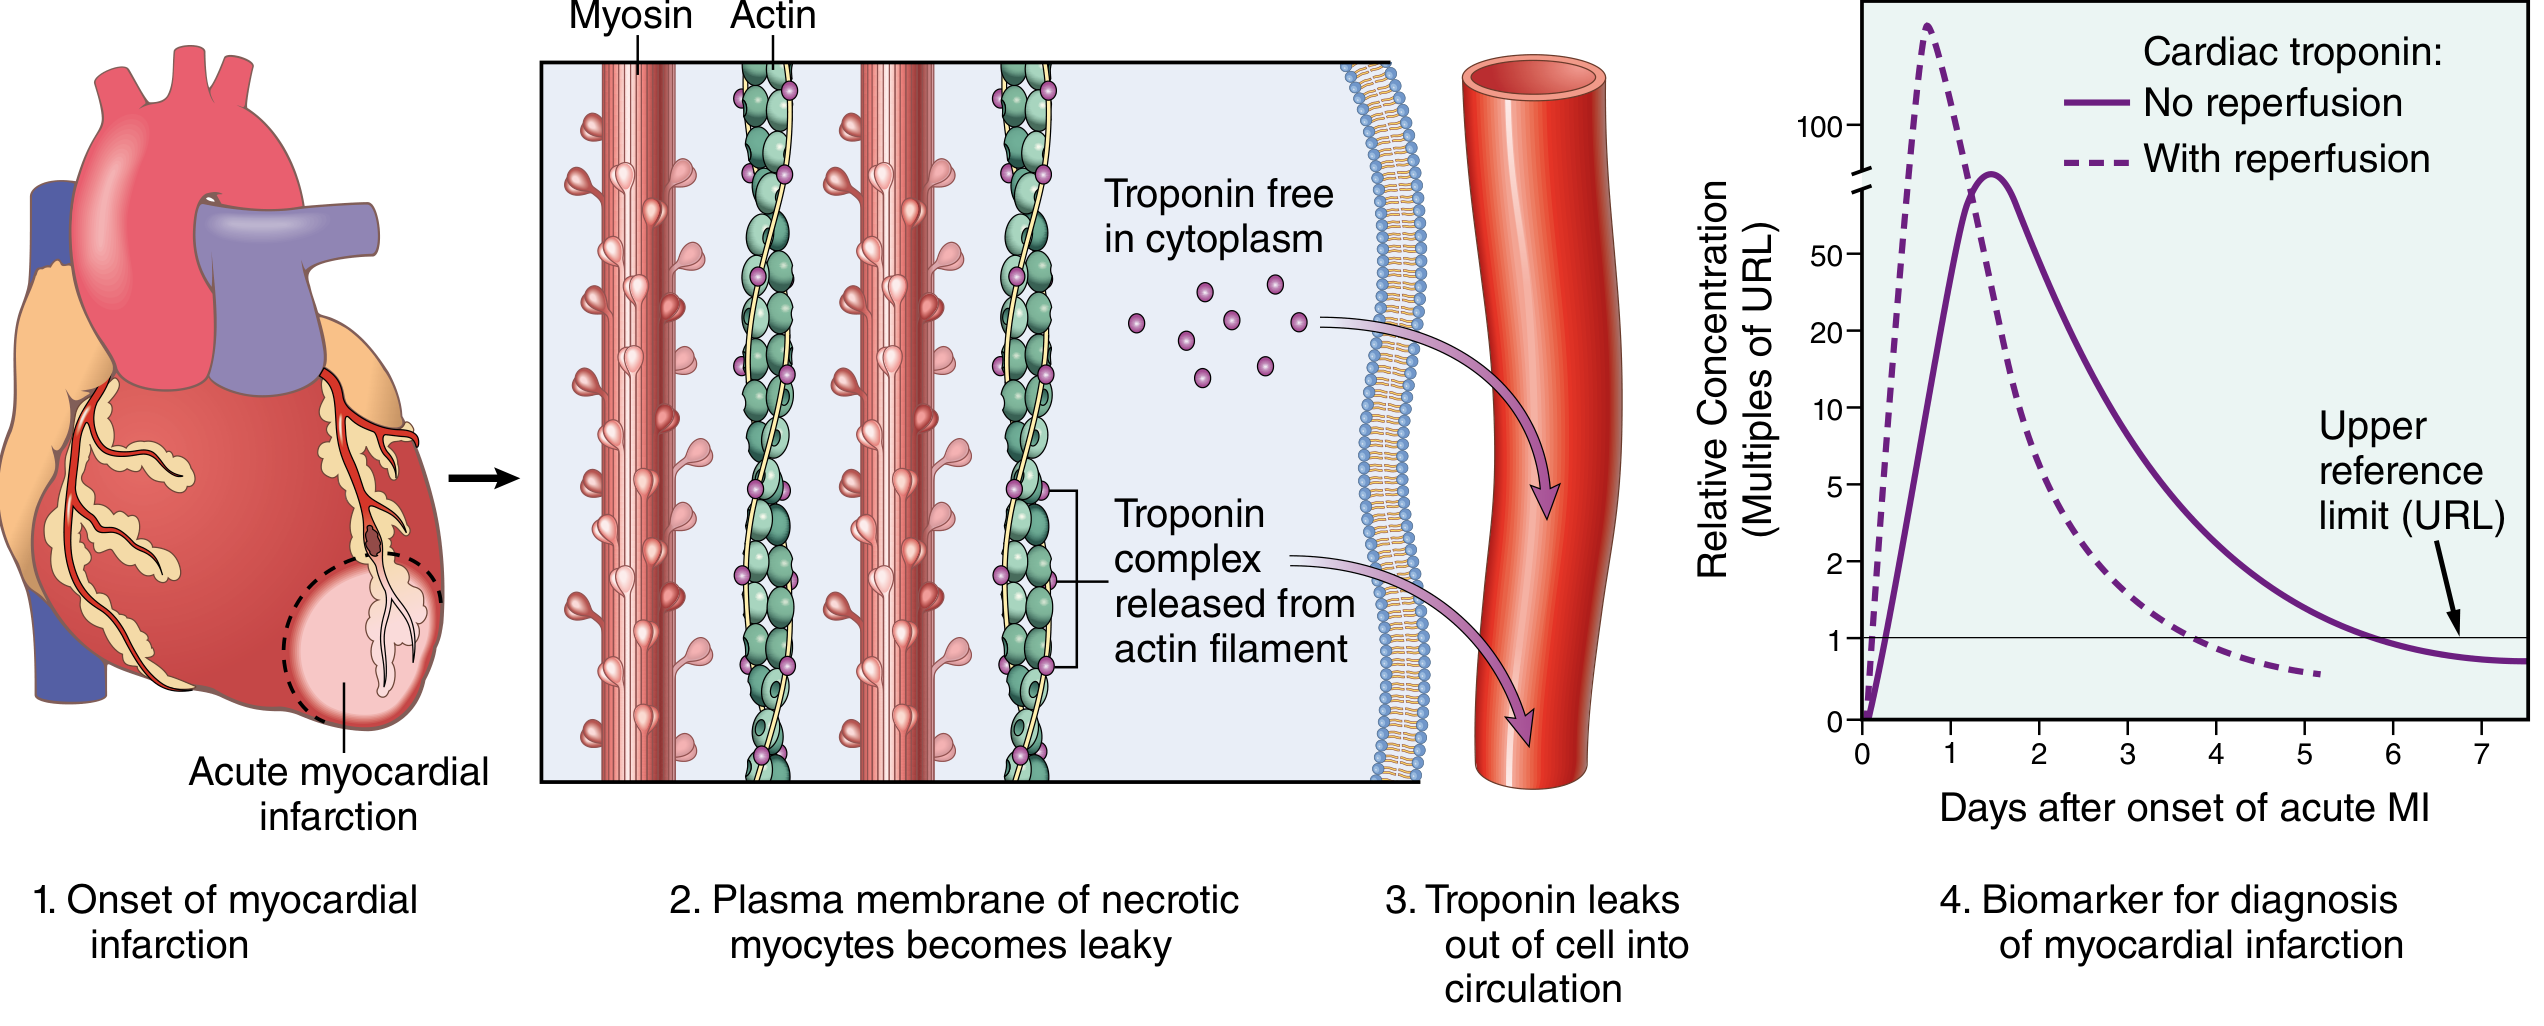
| Biomarker | Onset | Peak | Return to Normal | Notes |
|---|---|---|---|---|
| Troponin I / T | 3-6 hrs | 24-48 hrs | 7-10 days (TnI); up to 14 days (TnT) | Most specific and sensitive; gold standard |
| CK-MB | 4-6 hrs | 12-24 hrs | 48-72 hrs | Useful for re-infarction (returns to normal faster) |
| Myoglobin | 1-3 hrs | 6-9 hrs | 24 hrs | Earliest marker; low specificity (rises with skeletal muscle injury) |
| LDH | 24-48 hrs | 3-6 days | 8-14 days | Historically used; LDH1 > LDH2 ("flipped pattern") in MI |
- High-sensitivity cardiac troponin (hs-cTn): Allows earlier diagnosis (within 1-2 hours of presentation using 0h/1h or 0h/2h algorithms)
- Troponin can also rise in myocarditis, trauma, PE, renal failure, sepsis - serial measurements distinguish MI (characteristic rise and fall pattern)
- Troponin is the only cardiac biomarker referenced in the universal definition of MI
C. Echocardiography
- Regional wall motion abnormalities (hypokinesis, akinesis, dyskinesis) in the territory of the occluded vessel
- Assess LV ejection fraction
- Detect complications: VSD, papillary muscle rupture, pericardial effusion, mural thrombus
D. Coronary Angiography
- Definitive for identifying the culprit vessel
- Required before PCI
E. Other Labs
- FBC: Leukocytosis (elevated WBC - multifactorial, reflects inflammation; higher WBC correlates with worse prognosis)
- BMP: Glucose, renal function
- Lipid profile
- Coagulation studies
- BNP/NT-proBNP: Elevated if heart failure present
- Chest X-ray: Pulmonary oedema, cardiomegaly
9. TREATMENT
Immediate Management (Acute Phase)
| Drug | Mechanism/Purpose |
|---|---|
| Morphine | Analgesia, anxiolysis, reduces preload |
| Oxygen | Supplement if SpO2 <90%, hypoxia, or respiratory distress |
| Nitrates | Vasodilation, reverse vasospasm, reduce ischemic pain |
| Aspirin (300mg loading) | Antiplatelet - inhibits COX-1, reduces TXA2 |
| ADP receptor inhibitors (Clopidogrel/Ticagrelor/Prasugrel) | Dual antiplatelet therapy (DAPT) |
| Anticoagulation (UFH, LMWH, direct thrombin inhibitors, Factor Xa inhibitors) | Prevent thrombus propagation |
| Beta-blockers | Decrease myocardial O2 demand; reduce arrhythmia risk (contraindicated in acute HF, hypotension, bradycardia) |
| ACE inhibitors / ARBs | Reduce ventricular remodelling; start after haemodynamic stability |
| Statins | Plaque stabilisation, anti-inflammatory; start early |
Reperfusion Therapy - The Priority in STEMI
- Door-to-balloon time: <90 minutes (if performed in PCI-capable centre)
- Superior to thrombolysis in restoring TIMI-3 flow and reducing mortality
- Involves balloon angioplasty + stenting of culprit vessel
- Agents: Streptokinase, Alteplase (tPA), Reteplase, Tenecteplase
- Streptokinase - purified from beta-haemolytic Streptococcus; approved for acute MI, PE, DVT
- Reteplase and tenecteplase - indicated only for acute MI treatment
- Most effective within 3 hours of symptom onset
- Absolute contraindications: Prior intracranial haemorrhage, active bleeding, recent major surgery, severe uncontrolled hypertension
- After successful fibrinolysis → pharmacoinvasive strategy (angiography within 3-24 hours)
Long-term Secondary Prevention
- Aspirin (lifelong)
- Dual antiplatelet therapy for 12 months after stenting
- Beta-blockers (reduce mortality post-MI, especially with reduced EF)
- ACE inhibitors/ARBs (reduce remodelling, heart failure risk)
- Statins (high-intensity; target LDL reduction)
- Aldosterone antagonists (eplerenone/spironolactone) if EF <40% with HF or diabetes
- Cardiac rehabilitation
- Risk factor modification
10. COMPLICATIONS
| Complication | Timing | Mechanism | Notes |
|---|---|---|---|
| Contractile dysfunction / Cardiogenic shock | Immediate | Loss of contractile mass (>40% LV) | Occurs in ~10% of transmural MIs |
| Arrhythmias | First hour (highest risk) | Myocardial irritability and conduction disturbances | ~90% of patients develop some rhythm disturbance; VF most dangerous; commonest cause of early death |
| Myocardial rupture | 3-7 days | Maximal neutrophilic lysis of necrotic muscle / soft granulation tissue | 1-3% of MIs; three types: |
| - LV free wall rupture | 3-7 days | Transmural necrosis | Haemopericardium → cardiac tamponade → fatal |
| - Ventricular septal rupture (VSD) | 3-7 days | Transmural septal necrosis | Left-to-right shunt; new harsh systolic murmur |
| - Papillary muscle rupture | 3-7 days | Ischemic papillary muscle necrosis | Acute severe mitral regurgitation |
| Pericarditis (Fibrinohemorrhagic) | 2-3 days | Epicardial inflammation overlying transmural infarct | Anterior chest pain + pericardial friction rub; resolves in days |
| Dressler Syndrome | Weeks post-MI | Autoimmune (antibodies against damaged pericardium/myocardium) | Fever, pleuritis, pericarditis, elevated ESR |
| Mural thrombus | Days to weeks | Stasis + endocardial damage + chamber dilation | Risk of systemic embolism; treat with anticoagulation |
| Ventricular aneurysm | Weeks to months | Large transmural anteroseptal infarct heals with scar | Persistent ST elevation on ECG; gives rise to mural thrombus, arrhythmias, HF; does NOT rupture |
| Heart failure | Late | Progressive loss of contractile myocardium | Most common cause of late death |
| Dressler Syndrome | 2-10 weeks | Autoimmune pericarditis | Fever, malaise, pleuritis, pericardial effusion |
| Reinfarction | Variable | Residual stenoses, plaque instability | More common with NSTEMI (non-Q wave) |
- Age >60 years
- Anterior or lateral wall infarctions
- Female sex
- Absence of LV hypertrophy
- First MI (prior MIs leave scar that limits tearing)
11. PROGNOSIS DETERMINANTS
- Infarct size - proportion of LV damaged
- Location - anteroseptal (LAD) infarcts carry worse prognosis
- Depth - transmural > subendocardial
- Time to reperfusion - earlier = better preserved LV function
- Presence of complications - arrhythmias, shock, rupture
- Residual LV ejection fraction (LVEF) is the strongest predictor of long-term survival
12. SUMMARY TABLE: STEMI vs NSTEMI
| Feature | STEMI | NSTEMI |
|---|---|---|
| Mechanism | Complete occlusion | Partial/non-occlusive |
| ECG | ST elevation; Q waves | ST depression, T-wave inversion |
| Troponin | Elevated | Elevated |
| Morphology | Transmural | Subendocardial |
| Reperfusion | Urgent primary PCI or thrombolysis | Medical management ± early invasive strategy |
| In-hospital mortality | ~9% | ~6% |
| Reinfarction risk | Lower (if reperfused) | Higher |
- Robbins, Cotran & Kumar - Pathologic Basis of Disease (10th Ed.)
- Robbins & Kumar - Basic Pathology
- Ganong's Review of Medical Physiology (26th Ed.)
- Schwartz's Principles of Surgery (11th Ed.)
- Rosen's Emergency Medicine