
ROLE OF FISH IN SOLID TUMORS
FISH fluorescence in situ hybridization solid tumors clinical applications
FISH gene rearrangement cancer diagnosis targeted therapy
FISH fluorescence in situ hybridization tumor gene amplification
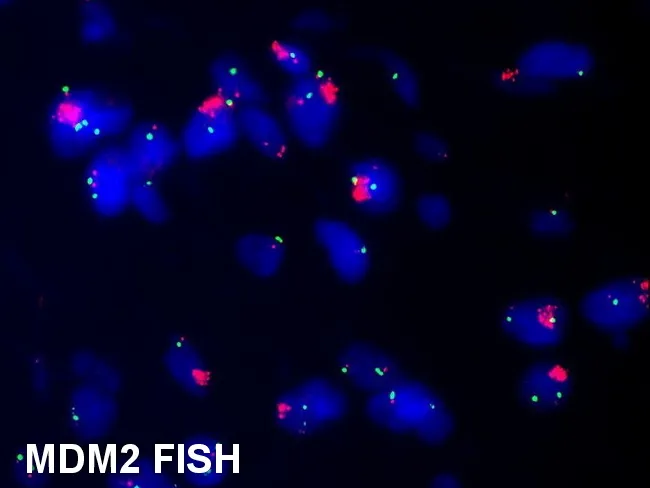
Dual-color fluorescence in situ hybridization (FISH) image illustrating MDM2 gene amplification (red) with the chromosome 12 centromere reference probe CEP12 (green) in a soft tissue lipomatous tumor. Nuclei display multiple red signals indicating MDM2 copy number gain on chromosome 12q15, characteristic of atypical lipomatous tumor/well-differentiated liposarcoma (ALT/WDL) and its dedifferentiated counterpart. The green CEP12 signals provide a stable chromosomal reference, enabling robust interpretation of amplification relative to centromeric control. This pattern supports the diagnosis of liposarcoma rather than benign lipomatous lesions, which typically lack MDM2 amplification. Compared with MDM2 immunohistochemistry, FISH offers higher sensitivity and specificity, reducing false positives that can occur with protein-based assays. A small minority of spindle cell or pleomorphic lipomas may exhibit MDM2 positivity due to polysomy of 12q; however, the amplification signal in ALT/WDL is usually robust and well‑defined. Clinically, MDM2 FISH is particularly valuable in older patients (>50 years), in deep-seated or large lesions (>10 cm), retroperitoneal or intraabdominal lipomatous tumors lacking overt atypia, and in recurrent tumors where accurate classification guides management. This image illustrates the decisive genetic alteration underlying a liposarcoma spectrum and informs diagnostic, prognostic, and therapeutic considerations. Credit: Dr. Runjan Chetty.
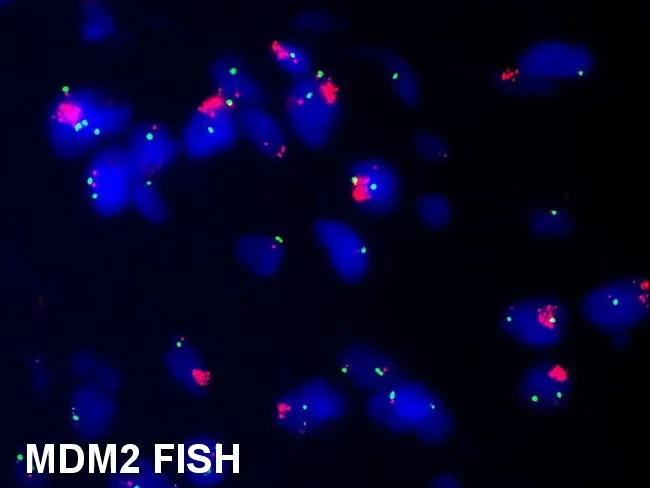
Imaging modality and technique: Fluorescence in situ hybridization (FISH) on interphase nuclei reveals MDM2 gene amplification (red) with a centromeric 12 reference signal CEP12 (green). In this case, the dual-color assay demonstrates a focal, high MDM2-to-CEP12 signal ratio consistent with amplification rather than mere polysomy; controls show intact reference signals. The specimen derives from soft tissue lipomatous tumor, most compatible with atypical lipomatous tumor/well-differentiated liposarcoma (ALT/WDL). A normal adipocytic lipoma would typically lack MDM2 amplification. Pathology: MDM2 amplification is a defining molecular hallmark that helps separate ALT/WDL and dedifferentiated liposarcoma from benign lipomatous tumors and other soft tissue sarcomas. Signal pattern: multiple red MDM2 signals co-localize with blue/green nuclei, with green CEP12 signals serving as a centromeric control. The image context emphasizes the diagnostic significance of MDM2 FISH in older patients (>50 years) with deep-seated, large, or recurrent lipomatous lesions or retroperitoneal tumors without peculiar cytology. Clinical relevance: when MDM2 amplification is demonstrated, management typically involves wide surgical excision with clear margins and surveillance for recurrence, since ALT/WDL may recur and DDLS risk rises with dedifferentiation. This assay option enhances diagnostic confidence and guides therapy decisions. Note: image credits and caption indicate courtesy of Dr. Runjan Chetty. used with permission.
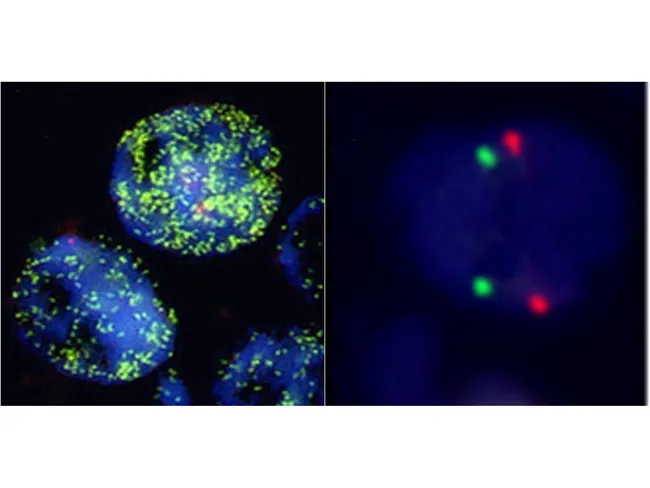
Fluorescence in situ hybridization (FISH) image showing MYCN gene status in neuroblastoma cells. The left panel depicts tumor cells with multiple green signals, indicating MYCN amplification and elevated copy number relative to normal. The right panel shows a control with normal diploid signals to demonstrate baseline copy number. This dual-color DNA FISH assay uses MYCN-specific probes (green) and a reference probe (red) for copy-number assessment. The specimen comprises neuroblastic tumor cells derived from a suspected adrenal or sympathetic chain lesion; histology is frequently undifferentiated or poorly differentiated with high mitotic activity and prominent nucleoli in MYCN-amplified tumors. MYCN amplification, defined as greater than 10 copies per diploid genome, is detectable by FISH, PCR, or immunohistochemistry and correlates with rapid tumor progression and poor prognosis; it often co-occurs with 1p deletion and 17q gain. Clinically, MYCN status is a critical prognostic biomarker that informs risk stratification, treatment intensity, and surveillance in neuroblastoma. The image demonstrates how copy-number gain translates into aggressive biology and aids in distinguishing high-risk from nonamplified tumors. This information supports diagnostic confirmation, prognostication, therapeutic decision-making, and research into targeted therapies. Correlative molecular testing across specimens enhances accuracy and guides enrollment in high-risk neuroblastoma trials and informs long-term management.
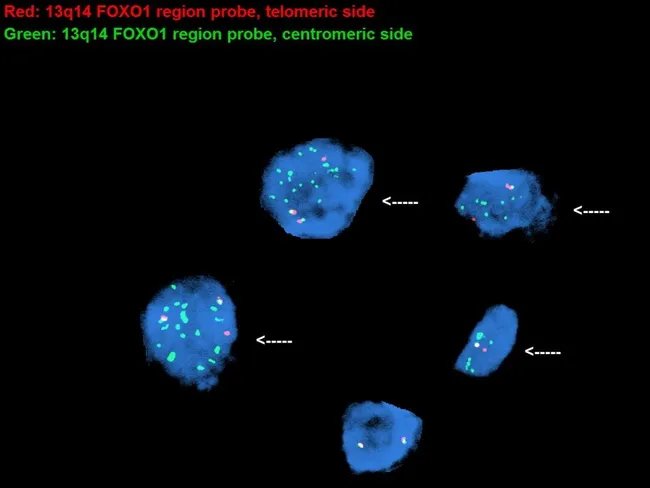
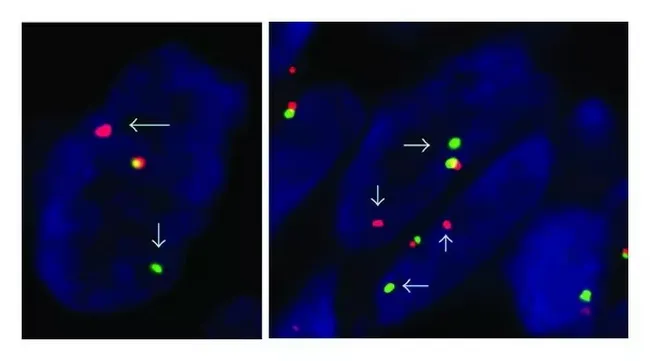
Fluorescence in situ hybridization (FISH) image using a red FOXO1 region probe and a green FOXO1 region probe (break-apart configuration) was performed on interphase tumor cells from a case of alveolar rhabdomyosarcoma. The predominant pattern shows a PAX7-FOXO1 rearrangement with translocation t(1;13)(p36;q14), as indicated by separation of red and green signals at the fusion locus; amplification of the fusion gene is present, a feature more often associated with PAX7-FOXO1 than PAX3-FOXO1. The bottom cell is a normal interphase nucleus that lacks translocation; it displays two co-localized red-green signal pairs corresponding to two intact FOXO1 loci at 13q14.11. The arrows highlight the rearranged signals, consistent with oncogenic PAX7-FOXO1 fusion driving alveolar rhabdomyosarcoma biology. Observed signal patterns include break-apart separation and signal amplification in tumor cells, with normal control patterns in non-neoplastic cells. This assay provides definitive cytogenetic evidence of the FOXO1 rearrangement, correlating with molecular subtype, prognosis, and potential therapeutic stratification. These findings support a diagnosis of alveolar rhabdomyosarcoma and underscore the clinical value of PAX7-FOXO1 testing for diagnostic confirmation, risk stratification, and targeted therapy planning. This image is annotated with arrows and uses red-green color coding to distinguish rearranged from non-rearranged loci and to illustrate interphase chromosomal dynamics for education.
FISH HER2 amplification breast cancer probe signals
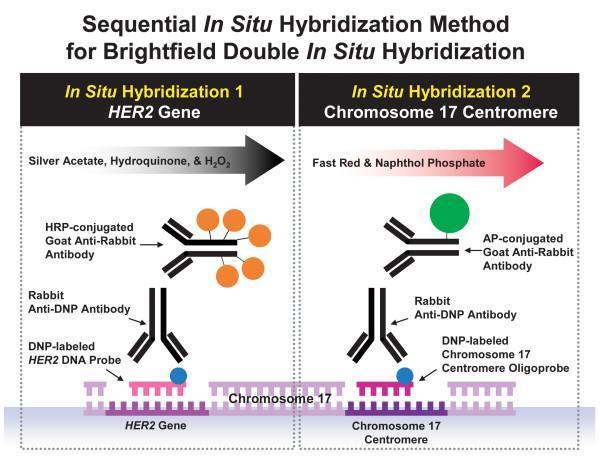
This medical diagram illustrates the molecular mechanism of a sequential Brightfield Double In Situ Hybridization (BDISH) method for detecting HER2 gene amplification and Chromosome 17 centromere (CEN17) status. The process is divided into two phases. Phase 1 (left) details HER2 gene detection: a DNP-labeled HER2 DNA probe hybridizes to the target gene, followed by binding of a Rabbit Anti-DNP primary antibody. A secondary HRP-conjugated Goat Anti-Rabbit antibody then facilitates a silver precipitation reaction (using silver acetate, hydroquinone, and H2O2), resulting in a black/grey signal. Phase 2 (right) depicts CEN17 detection on the same chromosome: a DNP-labeled CEN17 oligoprobe hybridizes to the centromere, followed by the same Rabbit Anti-DNP primary antibody. A different secondary antibody, AP-conjugated Goat Anti-Rabbit, is applied to catalyze a Fast Red and Naphthol Phosphate reaction, producing a red/pink signal. This dual-color sequential technique allows for simultaneous visual assessment of gene-to-chromosome ratios under a standard brightfield microscope, which is critical for breast cancer diagnostics and HER2 status determination.
Dual-color fluorescence in situ hybridization (FISH) image illustrating MDM2 gene amplification (red) with the chromosome 12 centromere reference probe CEP12 (green) in a soft tissue lipomatous tumor. Nuclei display multiple red signals indicating MDM2 copy number gain on chromosome 12q15, characteristic of atypical lipomatous tumor/well-differentiated liposarcoma (ALT/WDL) and its dedifferentiated counterpart. The green CEP12 signals provide a stable chromosomal reference, enabling robust interpretation of amplification relative to centromeric control. This pattern supports the diagnosis of liposarcoma rather than benign lipomatous lesions, which typically lack MDM2 amplification. Compared with MDM2 immunohistochemistry, FISH offers higher sensitivity and specificity, reducing false positives that can occur with protein-based assays. A small minority of spindle cell or pleomorphic lipomas may exhibit MDM2 positivity due to polysomy of 12q; however, the amplification signal in ALT/WDL is usually robust and well‑defined. Clinically, MDM2 FISH is particularly valuable in older patients (>50 years), in deep-seated or large lesions (>10 cm), retroperitoneal or intraabdominal lipomatous tumors lacking overt atypia, and in recurrent tumors where accurate classification guides management. This image illustrates the decisive genetic alteration underlying a liposarcoma spectrum and informs diagnostic, prognostic, and therapeutic considerations. Credit: Dr. Runjan Chetty.
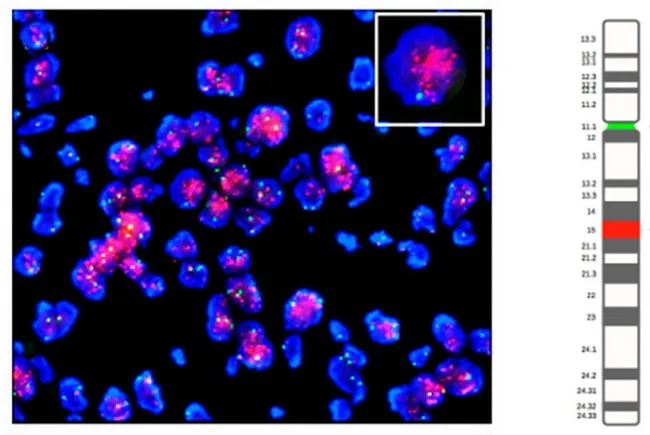
This molecular pathology image is a dual-color fluorescence in situ hybridization (FISH) study performed on FFPE soft tissue tumor tissue from a dedifferentiated liposarcoma (DLPS). The primary target probes label the MDM2 gene locus on chromosome 12q15 in red, while the reference CEP12 probe specific for the chromosome 12 centromere is shown in green. Nuclei are counterstained blue (DAPI). The image demonstrates high-level amplification of MDM2, evidenced by multiple red signals per nucleus in a background of predominantly two green CEP12 signals; some nuclei display clustered red signals, consistent with focal gene amplification typical of DLPS. The inset highlights a representative cell with prominent red MDM2 signals adjacent to green centromeric signals, illustrating signal co-localization and increased copy number. This amplification profile aligns with known oncogenic drivers of liposarcoma, particularly the 12q13-15 amplicon that also harbors CDK4 and HMGA2; GLI1 and DDIT3 may be variably overexpressed. MDM2 amplification aids diagnostic discrimination from benign lipomas and other sarcomas, and supports a diagnosis of DLPS in morphologically ambiguous cases. Potential pitfalls include signal overlap, copy-number heterogeneity, and FFPE-related artifacts; accurate interpretation requires counting multiple nuclei and cross-referencing with histology and immunohistochemistry. This image, derived from Gambella et al., demonstrates the utility and limitations of FISH for detecting MDM2 amplification in liposarcoma.
FISH ALK rearrangement lung cancer break-apart probe
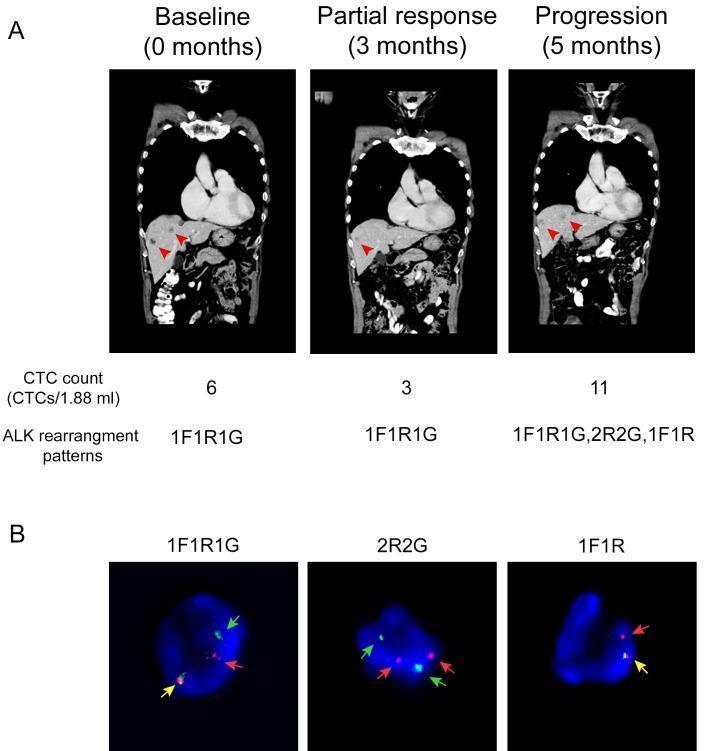
This composite educational image illustrates the clinical application of ALK-rearranged Circulating Tumor Cells (CTCs) as a biomarker for monitoring treatment response in Non-Small Cell Lung Cancer (NSCLC). Panel A presents a series of coronal CT scans of the chest and abdomen at three intervals: baseline (0 months), partial response (3 months), and progression (5 months). Red arrowheads indicate metastatic liver lesions, showing a reduction in size at 3 months followed by significant enlargement at 5 months. Below the scans, longitudinal data tracks the CTC count per 1.88 mL and identifies specific ALK rearrangement patterns. Panel B provides representative Fluorescence In Situ Hybridization (FISH) images of CTCs demonstrating different ALK break-apart signal patterns: 1F1R1G (one fusion, one orange, and one green signal), 2R2G (two orange, two green), and 1F1R (one fusion, one orange). Colored arrows (yellow for fusion, red for orange/R, and green for G) highlight these genetic signatures. The figure demonstrates the correlation between increased CTC counts, diversifying rearrangement patterns, and clinical disease progression during targeted therapy.
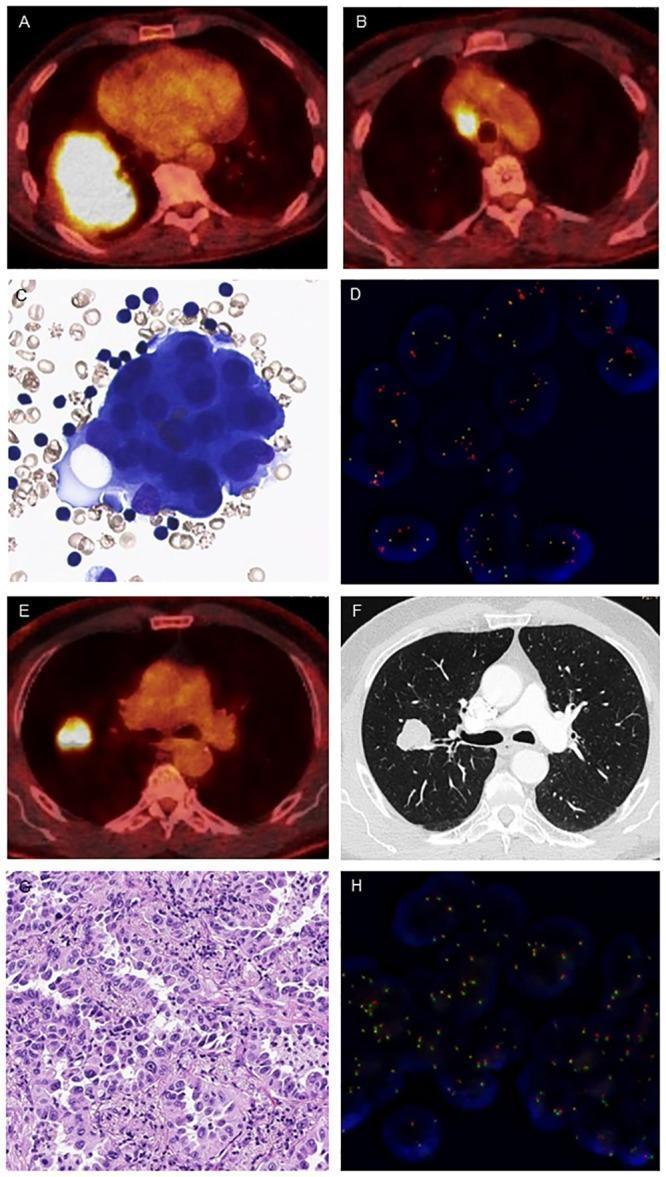
This composite figure presents clinical imaging and microscopy findings comparing ALK-rearranged (A-D) and ALK wildtype (E-H) lung adenocarcinoma. (A-B) Axial PET-CT fusion images show a large, hypermetabolic mass in the right lower lobe with associated FDG-avid ipsilateral mediastinal lymphadenopathy, characteristic of metastatic ALK-rearranged lung cancer. (C) Cytological preparation (May-Grünwald stain, 400x) displays clusters of atypical adenocarcinoma cells with high nuclear-to-cytoplasmic ratios. (D) ALK fluorescence in situ hybridization (FISH) demonstrates positivity via split red and green signals, indicating gene rearrangement. (E-F) Axial PET-CT and CT images of an ALK wildtype patient reveal a solitary hypermetabolic pulmonary nodule in the right upper lobe without mediastinal involvement. (G) Histopathological section (H&E stain, 200x) shows adenocarcinoma cells arranged in solid and glandular patterns. (H) ALK FISH negativity is indicated by predominantly fused (yellow) signals, representing an intact ALK gene. The collection highlights the correlation between molecular subtypes, radiographic presentation (centrality/lymphadenopathy), and diagnostic cytopathology/FISH testing.
Fluorescence in situ hybridization (FISH) on formalin-fixed paraffin-embedded tissue was performed using a dual-color SS18 (SYT) break-apart probe to detect the characteristic rearrangement seen in synovial sarcoma. The probe targets the 18q11.2 region harboring the SS18 gene. In a normal, non-rearranged cell, the green proximal and orange distal signals overlap to create a fused signal, representing two intact SS18 loci. In cells carrying the translocation t(X;18)(p11.2;q11.2), the probes separate, yielding distinct green and orange signals with loss of fusion; the image panels show examples where one fusion signal coexists with separate green and orange signals, as indicated by arrows. This break-apart pattern is pathognomonic for SS18 rearrangement when interpreted in the appropriate histologic and immunophenotypic context and supports a diagnosis of synovial sarcoma. The assay can be performed directly on FFPE material and complements routine histology and immunohistochemistry, particularly when conventional karyotyping is limited by specimen quality. Interpretation requires adequate tumor cell content and careful counting of nuclei to avoid artifactual signals. Clinically, detection of SS18 rearrangement informs differential diagnosis, influences treatment planning, and has prognostic relevance in soft tissue sarcomas with SYT-SSX fusion. This pattern complements histology and immunohistochemistry, supporting biopsy-based diagnosis and targeted systemic therapy decisions in practice.
Role of FISH in Solid Tumors
What is FISH?
- Gene amplification (extra copies of an oncogene)
- Gene deletion (loss of a tumor suppressor locus)
- Chromosomal translocation / gene rearrangement (break-apart or fusion probes)
- Chromosome copy number changes (polysomy, aneuploidy)
Probe Strategies
| Probe Type | Design | What It Detects |
|---|---|---|
| Dual-color fusion probe | Two probes flanking the breakpoint on different chromosomes; shows fusion signal when translocation occurs | Specific translocations (e.g., BCR-ABL) |
| Break-apart probe | Two probes on either side of a single gene's breakpoint; normal = fused yellow; rearranged = split red + green | Any rearrangement of that gene (e.g., EWSR1, ALK, SS18) |
| Gene amplification probe | Single-color locus probe + centromere reference probe | High gene-to-centromere ratio = amplification (e.g., HER2, MDM2, MYCN) |
Key Roles in Solid Tumors
1. Diagnosis
- Classic small round blue cell tumor of bone/soft tissue in young patients
- Harbors t(11;22)(q24;q12) fusing EWSR1-FLI1 in ~85-90% of cases; alternate EWSR1-ERG in ~9-14%
- FISH using a break-apart EWSR1 probe identifies the rearrangement on interphase cells - including FFPE sections, fine-needle aspirates, and touch preparations
- Karyotype is used first; FISH is added when karyotype is normal despite strong clinical suspicion
- Henry's Clinical Diagnosis, p. 1307
- Defined by t(X;18)(p11.2;q11.2) creating SS18-SSX fusion
- FISH with dual-color SS18 break-apart probe shows separation of green/orange signals, with loss of fusion in tumor cells (see image below)
- FISH with a FOXO1 break-apart probe detects t(2;13)(q35;q14) or t(1;13)(p36;q14) generating PAX3-FOXO1 or PAX7-FOXO1 fusions, respectively
- Distinguishes alveolar from embryonal subtype, which has prognostic and therapeutic implications

- ALK FISH (break-apart) is the FDA-validated companion diagnostic for crizotinib/alectinib eligibility in non-small cell lung cancer
- Positive result = split red and green signals, indicating any ALK fusion partner (most commonly EML4-ALK)
2. Prognosis
- Predicts response to trastuzumab (Herceptin), pertuzumab, T-DM1
- FISH is used as a reflex test when IHC shows equivocal (2+) staining
- Robbins Pathology, p. 364-365; Henry's Clinical Diagnosis, p. 708
- FISH detects >10 copies per diploid genome
- MYCN amplification = high-risk disease, co-occurs with 1p deletion and 17q gain
- Drives aggressive tumor biology, rapid progression, poor prognosis
- Mandates intensification of therapy and enrollment in high-risk protocols
- Robbins Basic Pathology, p. 612
- MDM2 FISH (locus probe vs. CEP12 reference) detects amplification at 12q15
- Distinguishes atypical lipomatous tumor/well-differentiated liposarcoma (ALT/WDL) and dedifferentiated liposarcoma (DDLS) from benign lipoma
- Critical in older patients, retroperitoneal or deep-seated lesions >10 cm where histology may be ambiguous
- High MDM2:CEP12 ratio guides surgical margins and surveillance intensity
- FISH or SNP array detects loss of chromosome 1p and 19q
- Oligodendrogliomas with 1p/19q co-deletion respond well to chemotherapy (temozolomide + PCV) and have significantly longer survival compared to tumors with intact 1p/19q or EGF receptor amplification
- Now a WHO 2021 defining criterion for oligodendroglioma, IDH-mutant
- Robbins Cotran & Kumar, p. 383
3. Therapeutic Decision-Making (Predictive Biomarkers)
| Gene / Locus | Tumor Type | FISH Finding | Clinical Action |
|---|---|---|---|
| ERBB2 (HER2) | Breast, gastric, endometrial | Amplification | Anti-HER2 therapy (trastuzumab, T-DM1, T-DXd) |
| ALK | NSCLC, anaplastic large cell lymphoma | Rearrangement | ALK inhibitors (crizotinib, alectinib, lorlatinib) |
| ROS1 | NSCLC | Rearrangement | Crizotinib, entrectinib |
| RET | NSCLC, thyroid | Rearrangement | Selpercatinib, pralsetinib |
| NTRK1/2/3 | Multiple solid tumors (soft tissue, thyroid, salivary, colon) | Rearrangement | Larotrectinib, entrectinib |
| MDM2 | Liposarcoma | Amplification | Diagnostic confirmation; MDM2 inhibitor trials |
| FGFR2 | Cholangiocarcinoma | Rearrangement | Pemigatinib, futibatinib |
4. Detection of Minimal Residual Disease & Monitoring
- While PCR-based methods are more sensitive for MRD, FISH can detect residual cytogenetic abnormalities in tumor cells after therapy
- Particularly useful in sarcomas when no specific PCR assay is available for a rare fusion variant
- RT-PCR for EWSR1-FLI1 in Ewing sarcoma remains preferred for MRD given higher sensitivity, but FISH provides an alternative when fusion partner is unknown - Henry's Clinical Diagnosis, p. 1307
5. Hereditary Cancer Predisposition
- FISH and comparative genomic hybridization can detect large BRCA1/BRCA2 deletions not captured by sequencing alone
- Detection of germline deletions guides prophylactic surgery decisions and family counseling - Robbins Basic Pathology, p. 618
FISH vs. Other Molecular Methods
| Feature | FISH | IHC | PCR / RT-PCR | NGS |
|---|---|---|---|---|
| Detects amplification | Yes (gold standard) | Indirectly (protein) | Yes (qPCR) | Yes (copy number) |
| Detects translocations | Yes (break-apart) | Indirectly (fusion protein) | Yes (if partner known) | Yes (unbiased) |
| FFPE compatible | Yes | Yes | Yes (with care) | Yes |
| Requires known partner | No (break-apart) | No | Yes | No |
| Spatial cell context preserved | Yes | Yes | No | No |
| Throughput | Low (one gene/probe) | Medium | Medium | High (genome-wide) |
| Cost | Moderate | Low | Moderate | High |
Summary of Clinically Validated FISH Tests in Solid Tumors
| Tumor | FISH Test | Purpose |
|---|---|---|
| Breast cancer | HER2/ERBB2 amplification | Trastuzumab eligibility, prognosis |
| NSCLC | ALK, ROS1, RET, MET rearrangement | Targeted therapy selection |
| Neuroblastoma | MYCN amplification | Risk stratification, therapy intensity |
| Ewing sarcoma | EWSR1 break-apart | Diagnostic confirmation |
| Synovial sarcoma | SS18 break-apart | Diagnosis |
| Alveolar rhabdomyosarcoma | FOXO1 break-apart | Subtype diagnosis |
| Liposarcoma (ALT/WDL, DDLS) | MDM2 amplification | Diagnosis, margin planning |
| Oligodendroglioma | 1p/19q co-deletion | WHO classification, therapy |
| Gastric/colorectal cancer | HER2 amplification | Anti-HER2 therapy eligibility |
| Cholangiocarcinoma | FGFR2 rearrangement | Pemigatinib eligibility |
| Thyroid/multiple solid tumors | NTRK1/2/3 rearrangement | Larotrectinib/entrectinib eligibility |
- Robbins & Kumar Basic Pathology, Molecular Diagnosis section, pp. 611-620
- Robbins, Cotran & Kumar Pathologic Basis of Disease, Molecular Diagnostics and Cytogenetics, pp. 313-394
- Henry's Clinical Diagnosis and Management by Laboratory Methods, Ewing Sarcoma/PNET and Sarcoma sections, pp. 1301-1370
SUMMARIZE THE ARTICLE
python3 -c " import pdfplumber with pdfplumber.open('/tmp/workspace/attachments/3087c21a-c261-4475-9c58-f3248c6b682e/s13039-014-0056-9.pdf') as pdf: print(f'Total pages: {len(pdf.pages)}') for i, page in enumerate(pdf.pages): text = page.extract_text() if text: print(f'--- PAGE {i+1} ---') print(text[:3000]) "
Summary: "FISH Molecular Testing in Cytological Preparations from Solid Tumors"
Citation & Type
- Journal: Molecular Cytogenetics (BioMed Central)
- Type: Open Access Commentary
- DOI: 10.1186/s13039-014-0056-9
- Published: August 22, 2014
Background
The Concept of Gene Promiscuity
- First described in Ewing's sarcoma in 1983 (t(11;22)(q24;q12)); the underlying EWSR1/FLI1 fusion was identified in 1992
- Since then, EWSR1 has been found to fuse with numerous partner genes - including ATF1, CREB1, WT1, DDIT3, NR4A, and many ETS family transcription factors - across a wide spectrum of tumors including sarcomas, carcinomas, and even hematological malignancies (Figure 1 in the article catalogs all EWSR1 fusion partners)
- The fusion partners mainly encode transcriptional regulator factor families (ETS genes, homeobox genes, zinc finger genes, leucine-zipper factors), and disruption of these pathways drives specific tumor types through various activation mechanisms
- ALK - fuses with EML4, NPM1, TPM3, and others across NSCLC, anaplastic large cell lymphoma, inflammatory myofibroblastic tumor, breast cancer, thyroid cancer, and more
- BCOR - fuses with CCNB3, ZC3H7B, and RARA
- ETV6 - fuses with NTRK3 (in infantile fibrosarcoma, secretory breast carcinoma, thyroid cancer) and with ABL1, PDGFRB, RUNX1 in leukemias
- FGFR family members (FGFR1, 2, 3) - fuse with TACC3, BICC1, ERLIN2, and others in bladder, breast, lung, glioblastoma, cholangiocarcinoma, and prostate cancers
Cytology and Cytogenetics: A Closer Partnership
- Interphase FISH has been integrated into cytological diagnosis as an ancillary supplementary tool
- The number of chromosome markers incorporated into WHO tumor classifications has grown substantially
- Several gene fusion markers are now also relevant for targeted therapy selection (e.g., ALK rearrangement for ALK inhibitors; FGFR fusions for FGFR inhibitors)
- The demand for FISH testing on fine-needle aspirates (FNA) and body fluids has rapidly increased, particularly in lung and breast cancer where systematic genomic testing is now standard
Practical Considerations When Using FISH in Cytological Preparations
- Ordering a FISH test requires prior knowledge of the rearrangement being investigated - clinicians/pathologists must specify the probe to use
- The FISH result must always be interpreted in the context of cytological and clinical findings
- A negative FISH result is not fully informative because: (a) unknown alterations cannot be excluded, and (b) tumor cell content in cytological preparations may be limited
- Genetic heterogeneity within a tumor (different cell populations with different copy-number ratios) creates challenges for correctly interpreting ratio values
Future Challenges
-
Automated FISH evaluation - Manual FISH scoring of numerous interphase nuclei using double-blind observation is labor-intensive and a significant bottleneck as the number of clinical FISH tests grows. Automated FISH systems with standardized parameters are needed, though automation has not yet been perfected.
-
Standardized criteria for interpreting and reporting FISH results - Common objective interpretation criteria, quality control policies, and quality assurance standards for FISH on cytological preparations remain limited. The authors call for expert advisory panels from cytogenetics and cytology scientific societies to establish guidelines and standards.