
Trimester with weeks
- 1st Trimester: Weeks 1-13
- 2nd Trimester: Weeks 14-26
- 3rd Trimester: Weeks 27-40
pregnancy trimesters weeks diagram
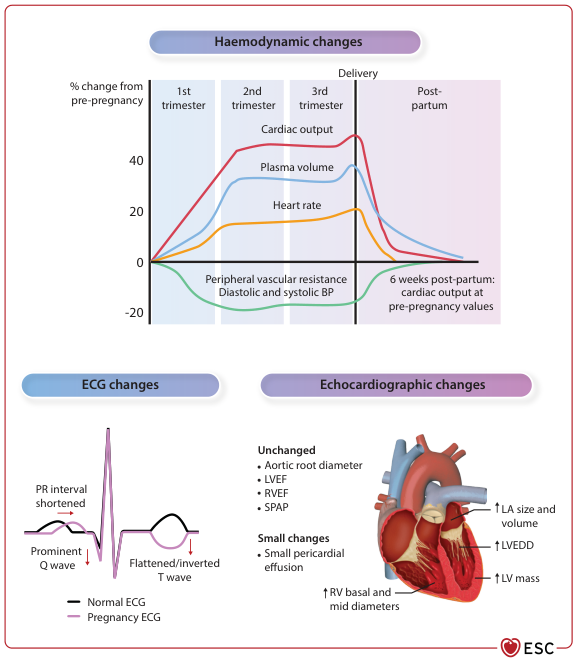
Summary : This figure presents the cardiovascular changes during pregnancy, including haemodynamic, ECG, and echocardiographic changes, with graphical and schematic representations of trends across trimesters, delivery, and postpartum. line chart and schematic diagram: # Haemodynamic Changes : • Line chart showing % change from pre-pregnancy for four parameters: cardiac output, plasma volume, heart rate, and peripheral vascular resistance/diastolic and systolic BP. • X-axis: Pregnancy timeline (1st trimester, 2nd trimester, 3rd trimester, Delivery, Post-partum). • Y-axis: % change from pre-pregnancy (range: -20% to +60%). • Cardiac output: Rises steeply to ~50% above baseline by 2nd trimester, peaks in 3rd trimester, drops sharply at delivery, returns to baseline by 6 weeks postpartum. • Plasma volume: Rises to ~40% above baseline, peaks in 3rd trimester, drops at delivery, returns to baseline postpartum. • Heart rate: Rises to ~20% above baseline, peaks in 3rd trimester, drops at delivery, returns to baseline postpartum. • Peripheral vascular resistance/diastolic and systolic BP: Drops to ~-20% below baseline, lowest in 2nd trimester, rises towards baseline at delivery and postpartum. # ECG Changes : • Schematic comparison of normal ECG (black) and pregnancy ECG (purple). • PR interval shortened in pregnancy. • Prominent Q wave in pregnancy ECG. • Flattened/inverted T wave in pregnancy ECG. # Echocardiographic Changes : • Schematic heart illustration with labelled changes. • Unchanged: Aortic root diameter, LVEF (left ventricular ejection fraction), RVEF (right ventricular ejection fraction), SPAP (systolic pulmonary artery pressure). • Small changes: Small pericardial effusion, increased RV (right ventricular) basal and mid diameters. • Increased LA (left atrial) size and volume, LVEDD (left ventricular end-diastolic diameter), LV (left ventricular) mass. # Design Encodings : • Distinct coloured lines for each haemodynamic parameter. • Schematic ECG traces with colour-coded changes. • Heart diagram with labelled anatomical changes. # Analysis : • Cardiac output, plasma volume, and heart rate all increase during pregnancy, peaking in the third trimester, and rapidly return to baseline postpartum. • Peripheral vascular resistance and blood pressure decrease during pregnancy, reaching their lowest in the second trimester, then return to baseline postpartum. • Pregnancy ECG shows shortened PR interval, prominent Q wave, and flattened/inverted T wave. • Echocardiographic changes include increased chamber sizes and mass, with most functional parameters unchanged except for small pericardial effusion and increased RV diameters.
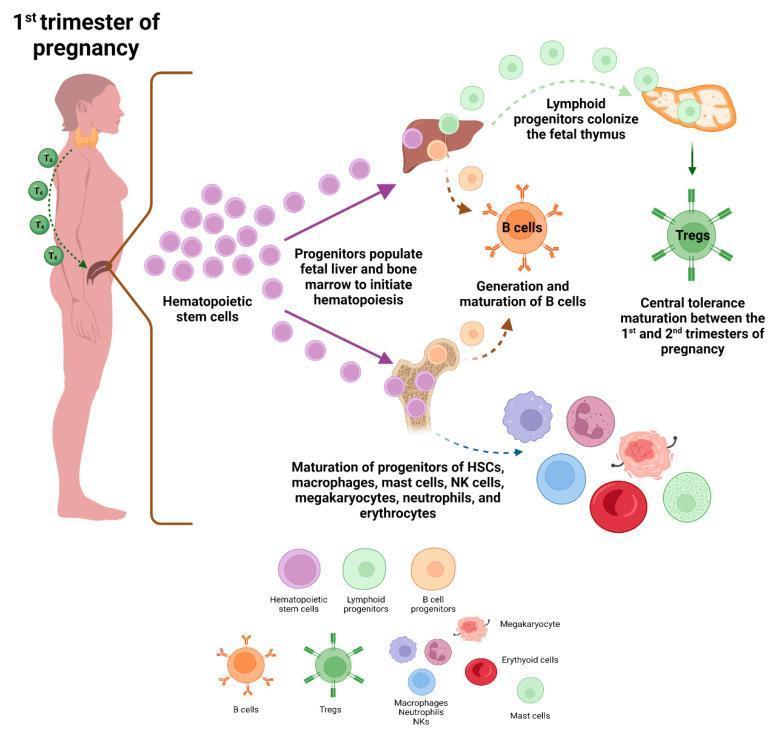
An anatomical and pathophysiology diagram illustrating fetal immune system development during the first trimester of pregnancy. The schematic shows a pregnant woman with the thyroid gland highlighted, indicating the influence of maternal thyroid hormone (T4) on fetal hematopoiesis. The process begins with hematopoietic stem cells (HSCs) that populate the fetal liver and bone marrow to initiate hematopoiesis. Three primary developmental pathways are depicted: 1) Lymphoid progenitors colonizing the fetal thymus to produce regulatory T cells (Tregs), facilitating central tolerance maturation between the first and second trimesters; 2) Hepatic progenitors in the fetal liver undergoing generation and maturation into B cells; and 3) Bone marrow progenitors differentiating into a diverse array of lineages, including macrophages, mast cells, NK cells, neutrophils, megakaryocytes, and erythroid cells (erythrocytes). The diagram uses color-coded icons for each cell type and highlights the critical anatomical sites—thymus, liver, and bone marrow—involved in early immune system ontogeny and lineage specification.
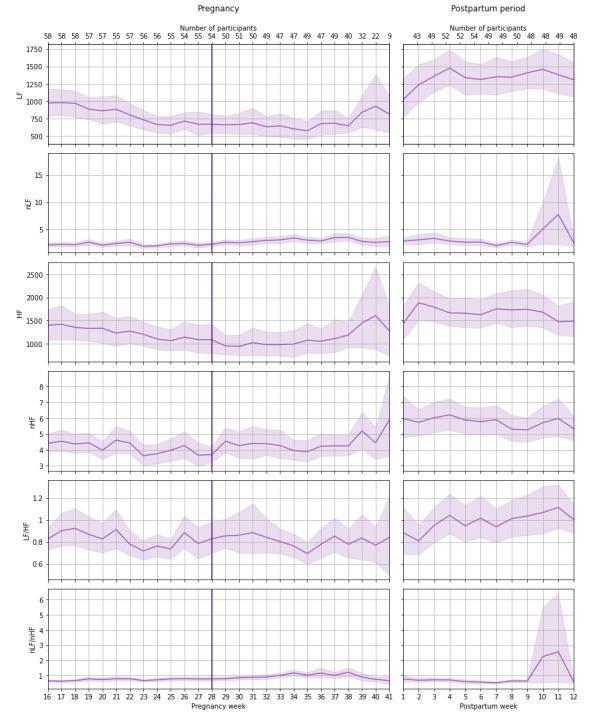
A multi-panel line graph illustrating the longitudinal trends of frequency-domain heart rate variability (HRV) parameters during pregnancy (weeks 16-41) and the postpartum period (weeks 1-12). The charts display weekly means and 95% confidence intervals (shaded areas) for six primary metrics: Low-Frequency power (LF), normalized LF (nLF), High-Frequency power (HF), normalized HF (nHF), and the ratios LF/HF and nLF/nHF. In the pregnancy phase, a vertical line marks week 28, separating the second and third trimesters. Generally, absolute power parameters (LF and HF) show a gradual decline during the second trimester followed by stabilization and a terminal increase near delivery. Postpartum charts indicate a rapid recovery and stabilization of HRV metrics. Significant fluctuations are visible in normalized values and ratios during late pregnancy and the late postpartum period (around week 11). The header for each column indicates the number of study participants providing reliable data for that specific week, supporting the statistical validity of the cardiovascular autonomic monitoring data.
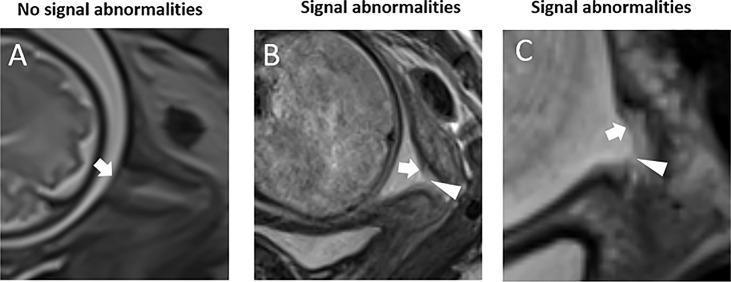
This diagnostic image consists of three sagittal T2-weighted magnetic resonance imaging (MRI) scans focusing on the uterine cervix and fetal membranes (FM) during the second and third trimesters of pregnancy. The series serves as a comparison chart for identifying structural integrity and signal abnormalities in the fetal membranes. Panel A (32 weeks) illustrates a normal fetal membrane, appearing as a continuous, low-to-intermediate signal intensity line (white arrow) with uniform thickness. Panel B (32 weeks) demonstrates a prolapsed fetal membrane with a signal abnormality characterized by a partial defect (white arrowhead) or discontinuity in the membrane. Panel C (28 weeks) shows another prolapsed membrane exhibiting local thinning and increased T2 signal intensity (white arrowhead), suggesting focal edema or structural weakening. These images highlight the clinical utility of MRI in detecting markers of preterm premature rupture of membranes (PPROM) and cervical insufficiency by evaluating the relationship between the fetal membranes and the internal cervical os.
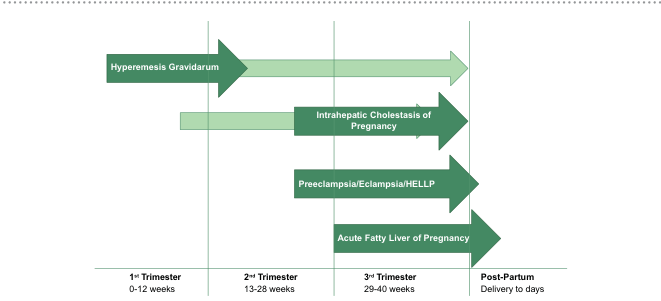
Summary : This timeline chart illustrates the typical onset and duration of four major liver-related complications during pregnancy: Hyperemesis Gravidarum, Intrahepatic Cholestasis of Pregnancy, Preeclampsia/Eclampsia/HELLP, and Acute Fatty Liver of Pregnancy, mapped across the trimesters and into the post-partum period. timeline chart: Scope & Reference : • Time axis spans from 1st Trimester (0–12 weeks), 2nd Trimester (13–28 weeks), 3rd Trimester (29–40 weeks), to Post-Partum (delivery to days). • Each complication is represented by a horizontal arrow indicating its typical period of occurrence. Keys & Annotations : • Hyperemesis Gravidarum: Arrow starts in 1st Trimester and extends through 2nd and 3rd Trimesters. • Intrahepatic Cholestasis of Pregnancy: Arrow begins in 2nd Trimester and continues through 3rd Trimester, ending at delivery. • Preeclampsia/Eclampsia/HELLP: Arrow starts in 3rd Trimester and ends at delivery. • Acute Fatty Liver of Pregnancy: Arrow starts in 3rd Trimester and extends into the Post-Partum period. Ordering : • Arrows are stacked vertically, each labeled with the condition name. • The timeline is segmented by vertical lines marking the start of each trimester and the post-partum period. Analysis : • Hyperemesis Gravidarum is the earliest and longest-lasting condition, potentially spanning all trimesters. • Intrahepatic Cholestasis of Pregnancy and Preeclampsia/Eclampsia/HELLP are concentrated in later trimesters, with the latter two peaking near delivery. • Acute Fatty Liver of Pregnancy is the latest onset, often extending into the immediate post-partum period. • The chart visually distinguishes the temporal risk windows for each condition, aiding clinical awareness of when to monitor for specific complications.
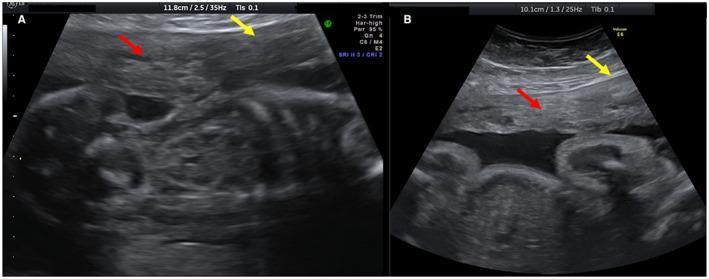
Side-by-side diagnostic obstetric ultrasound images demonstrating uterine adenomyosis during pregnancy at 20 weeks (Image A) and 30 weeks (Image B). The images highlight two primary sonographic markers of adenomyosis: hyperechoic islands and asymmetrical myometrial thickness. In Image A, the red arrow identifies prominent, focal clusters of increased echogenicity within the myometrium, described as hyperechoic islands. The yellow arrow points to a region of localized asymmetrical thickening of the uterine wall. In Image B, the same patient is shown at a later gestational age; the red arrow indicates that the hyperechoic regions have become more dispersed and less concentrated, while the yellow arrow shows the progression of the asymmetrical wall thickness. These images serve as a comparison of how myometrial architectural changes associated with adenomyosis evolve as the uterus expands during the second and third trimesters of pregnancy. Key educational concepts include the identification of heterogeneous myometrial echo texture and the longitudinal monitoring of uterine pathologies during gestation.
Pregnancy Trimesters with Weeks
1st Trimester - Weeks 0 to 13
| Milestone | Detail |
|---|---|
| Weeks | 0 - 13 |
| Start | First day of last menstrual period |
| Embryo → Fetus | At ~10 weeks, most major structures have formed; called a fetus from week 10 onward |
| Fetal size at end | ~13 g, ~8 cm long |
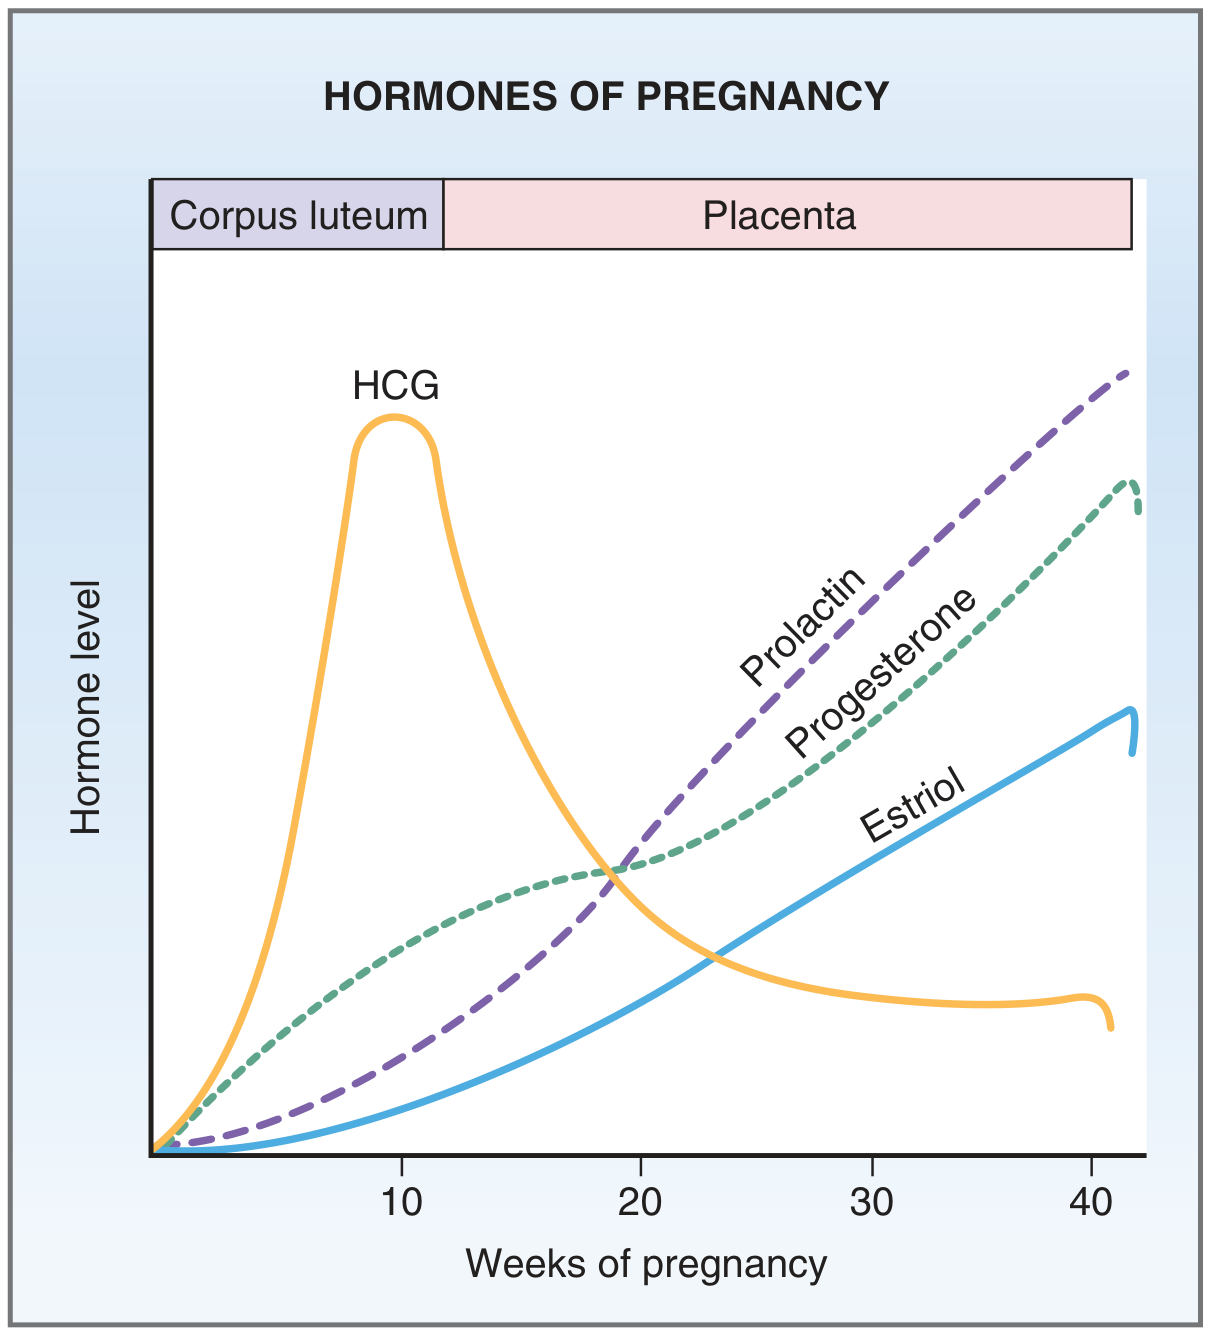
| Dominant hormone | hCG - peaks at week 9, then declines |
| Hormone source | Corpus luteum (maintained by hCG) |
| Key events | Implantation, organogenesis, placenta formation |
| Common symptom | Nausea and vomiting of pregnancy (NVP) - starts around week 4-5, often resolves by end of 1st trimester |
2nd Trimester - Weeks 14 to 26
| Milestone | Detail |
|---|---|
| Weeks | 14 - 26 |
| Fetal size at end | ~700 g, ~30 cm long |
| Dominant hormones | Progesterone and estriol (placenta takes over from corpus luteum) |
| Hormone source | Placenta (in concert with fetus and mother) |
| Key events | Rapid fetal growth; organogenesis complete; fetal organ maturation begins |
| Note | Miscarriage (fetal loss) conventionally occurs in this trimester |
3rd Trimester - Weeks 27 to 40
| Milestone | Detail |
|---|---|
| Weeks | 27 - 40 |
| Fetal size at end | ~3,200 g, ~50 cm long |
| Dominant hormones | Progesterone, estriol, prolactin - all rising |
| Key events | Continued fetal growth and maturation; slight deceleration of growth near end |
| Term subdivisions | Early term: 37 0/7 - 38 6/7 wks; Full term: 39 0/7 - 40 6/7 wks; Late term: 41 0/7 - 41 6/7 wks; Post-term: ≥42 wks |
| Premature labor | Delivery after 28 weeks up to 40th week |
Summary Table
| Trimester | Weeks | Key Feature |
|---|---|---|
| 1st | 0 - 13 | Organogenesis, hCG peak at wk 9 |
| 2nd | 14 - 26 | Rapid growth, placenta takes over hormones |
| 3rd | 27 - 40 | Maturation, preparation for birth |
| Term | 37 - 42 | Full-term defined as 39 0/7 - 40 6/7 wks |
Hormones Across Pregnancy
Key Definitions to Know
- Abortion: Loss before 28 weeks (1st trimester clinically)
- Miscarriage: Loss in 2nd trimester
- Premature labor: Delivery after 28 weeks but before 40 weeks (3rd trimester)
- EDC (Expected Date of Confinement): Estimated delivery date = LMP + 40 weeks