Ecg
Asking for Preferences
Reading File
Finding Sources
Searching Images
normal ECG tracing waves intervals
Finding Sources
Loading Image
Finding Sources
Reading File
Finding Sources
Searching Images
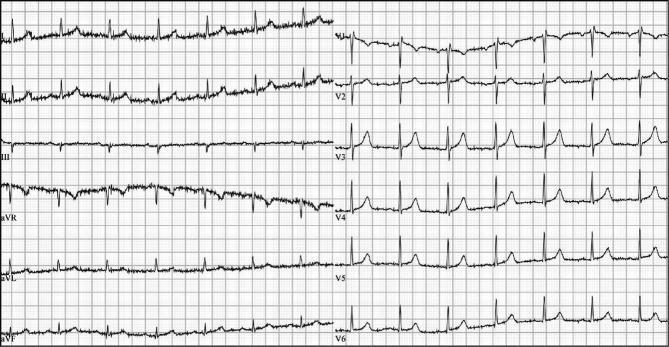
abnormal ECG ST elevation myocardial infarction bundle branch block
Reading File
Searching Images
ECG P wave QRS T wave normal labeled diagram
Loading Image
Loading Image
Here is a comprehensive overview of Normal vs Abnormal ECG, drawn from Medical Physiology (Boron & Boulpaep) and Harrison's Principles of Internal Medicine.
The ECG at a Glance
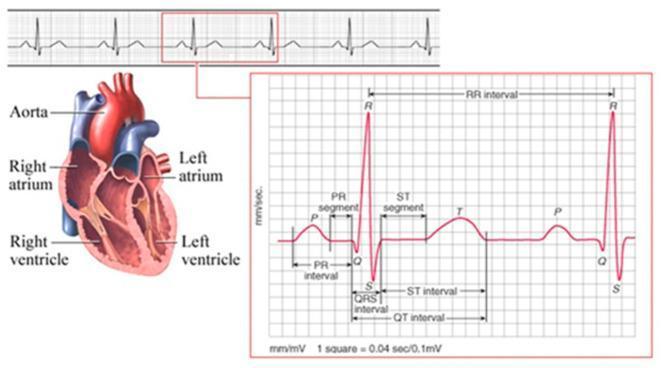
ECG Paper Basics
- Small box = 0.04 s (horizontal) / 0.1 mV (vertical)
- Large box = 0.2 s / 0.5 mV
- 5 large boxes = 1 second
Waves, Segments & Intervals
| Component | What It Represents | Normal Value |
|---|---|---|
| P wave | Atrial depolarization | Duration < 0.12 s; positive in I, II, aVF |
| PR interval | AV node conduction time | 0.12–0.20 s (3–5 small boxes) |
| QRS complex | Ventricular depolarization | Duration < 0.12 s |
| ST segment | Ventricular plateau (isoelectric) | At baseline; no elevation/depression |
| T wave | Ventricular repolarization | Upright in I, II, V3–V6; inverted in aVR |
| QT interval | Total ventricular activity | QTc ≤ 0.44 s (men), ≤ 0.46 s (women) |
| U wave | Purkinje/papillary repolarization | Small, same direction as T wave |
Normal Sinus Rhythm — Criteria
- Rate: 60–100 bpm
- P wave before every QRS (upright in II, inverted in aVR)
- Regular PR interval (0.12–0.20 s)
- Narrow QRS (< 0.12 s)
- Isoelectric ST segment
- Concordant T waves (same direction as QRS)
- Normal axis: −30° to +90°
Quick rate estimation: Count large boxes between R–R → Rate = 300 ÷ (number of large boxes)
Common Abnormal ECG Findings
🔴 ST Changes
| Finding | Meaning |
|---|---|
| ST elevation ≥ 1 mm (≥ 2 mm V1–V4) | STEMI, pericarditis, Brugada, early repolarization |
| ST depression ≥ 0.5 mm | NSTEMI, ischemia, digoxin effect |
| Diffuse saddle-shaped ST elevation | Pericarditis |
🟡 Interval Abnormalities
| Finding | Meaning |
|---|---|
| PR > 0.20 s | 1st-degree AV block |
| PR progressively lengthens → dropped QRS | 2nd-degree AV block (Mobitz I / Wenckebach) |
| Sudden dropped QRS, fixed PR | Mobitz II AV block |
| No relationship between P & QRS | Complete (3rd-degree) AV block |
| Short PR + delta wave | WPW syndrome (pre-excitation) |
| QTc > 0.44–0.46 s | Long QT syndrome → risk of Torsades de Pointes |
🟠 QRS Abnormalities
| Finding | Meaning |
|---|---|
| Wide QRS + RSR' in V1, slurred S in V6 | Right Bundle Branch Block (RBBB) |
| Wide QRS + broad notched R in V5/V6, absence of septal Q | Left Bundle Branch Block (LBBB) |
| Pathological Q waves (> 0.04 s, depth > 1/4 R) | Old myocardial infarction |
| Right axis deviation | RVH, RBBB, lateral MI |
| Left axis deviation | LBBB, left anterior fascicular block, inferior MI |
🟢 Rhythm Abnormalities
| Finding | Meaning |
|---|---|
| No P waves, irregular RR | Atrial fibrillation |
| Sawtooth baseline ~300 bpm, regular | Atrial flutter |
| Wide complex regular tachycardia | Ventricular tachycardia (VT) |
| No organized activity | Ventricular fibrillation (VF) |
🔵 Other Key Findings
| Finding | Meaning |
|---|---|
| Peaked T waves + widened QRS | Hyperkalemia |
| Prominent U waves | Hypokalemia |
| Prolonged QT + flat T | Hypocalcemia |
| Low voltage in all leads | Pericardial effusion, obesity, hypothyroidism |
| Electrical alternans | Cardiac tamponade |
Systematic Approach to Reading an ECG
Follow this order every time:
- Rate (bpm)
- Rhythm (regular? P before QRS?)
- Axis (normal −30° to +90°)
- Intervals (PR, QRS, QTc)
- Waveform morphology (P, QRS, T, U)
- ST segments (elevation, depression)
- Clinical correlation
Sources: Medical Physiology (Boron & Boulpaep), BOX 21-2; Harrison's Principles of Internal Medicine, 21st ed.
This is a shared conversation. Sign in to Orris to start your own chat.