

Hiw it nstemi mi
NSTEMI ECG ST depression T wave inversion lateral leads
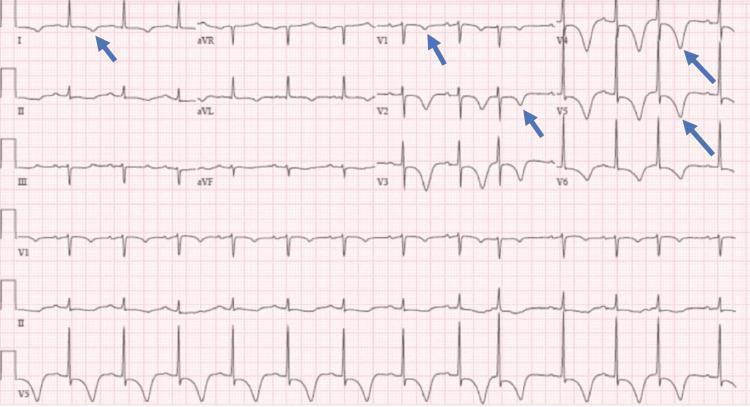
A standard 12-lead diagnostic electrocardiogram (ECG) printed on pink grid paper, demonstrating significant repolarization abnormalities. The primary visual finding is deep, symmetric T-wave inversions (TWIs) localized to the lateral (lead I) and anteroseptal to lateral precordial leads (V1 through V6). Blue arrows highlight these specific inversions in leads I, V1, V2, V4, and V5. The QRS complexes appear to be of normal duration and morphology with regular R-R intervals, suggesting a sinus rhythm. There is evidence of mild ST-segment depression accompanying the T-wave changes in the precordial leads. In contrast, the inferior leads (II, III, aVF) and augmented limb leads (aVR, aVL) show upright or flat T-wave morphology. Clinically, this pattern of widespread anterior and lateral T-wave inversion is highly significant for myocardial ischemia, such as Wellens' syndrome or non-ST elevation myocardial infarction (NSTEMI), or potentially secondary to hypertrophic cardiomyopathy or pulmonary embolism. The educational focus is on identifying patterns of ischemia and differentiating regional repolarization abnormalities.
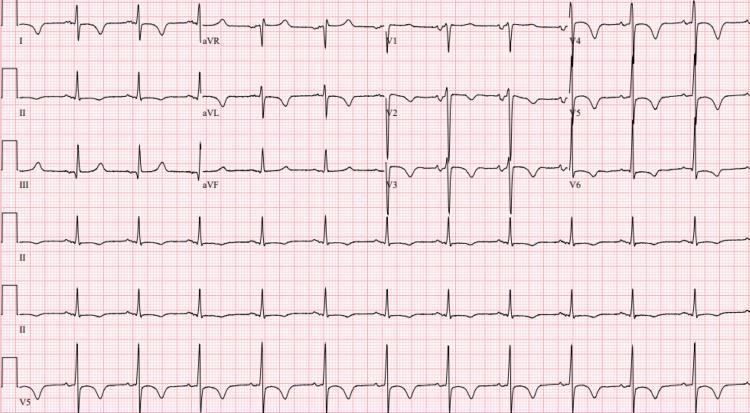
A standard 12-lead electrocardiogram (ECG) printed on red grid paper demonstrating significant repolarization abnormalities. The tracing shows a normal sinus rhythm with a prolonged corrected QT interval (QTc of 497 ms). Prominent pathological features include widespread ST-segment depression and deep, symmetric T-wave inversions. These changes are most pronounced in the anteroseptal leads (V1-V3) and the lateral leads (I, aVL, V4-V6). The inferior leads (II, III, aVF) also show subtle ST-segment flattening or depression. Clinically, this pattern of diffuse ST-segment depression and T-wave inversion in multiple vascular territories is highly suggestive of myocardial ischemia, such as non-ST-elevation myocardial infarction (NSTEMI) or significant multi-vessel coronary artery disease, though it can also be seen in conditions causing global cardiac stress or metabolic disturbances. The ECG serves as a critical diagnostic tool for evaluating cardiac repolarization abnormalities in an acute clinical setting.
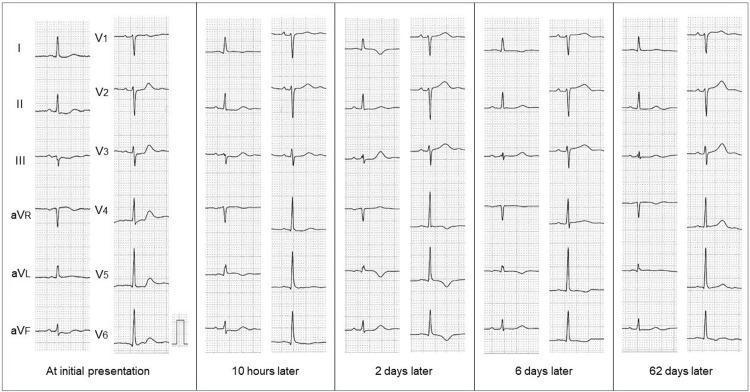
This Comparison Chart displays serial 12-lead electrocardiograms (ECGs) from a patient with non-ST-elevation myocardial infarction (NSTEMI), tracking progress from initial presentation through 10 hours, 2 days, 6 days, and 62 days later. The initial ECG shows mild ST-segment depression in the inferior leads (II, III, aVF) and precordial leads V2-V4, with upright T waves in the lateral leads (I, aVL, V4-V6). By 2 to 6 days follow-up, the ECG demonstrates characteristic dynamic evolution with the development of deep, symmetrical T-wave inversions in leads I, aVL, and V4-V6, suggestive of reperfusion or evolving ischemia in the anterolateral wall. The final follow-up at 62 days shows significant resolution of these changes, with ST segments returning to baseline (isoelectric) and T waves returning to an upright morphology. This serial progression illustrates the temporal electrical remodeling of the myocardium following a subendocardial ischemic event.
ECG Analysis: V4, V5, V6 Strip
- No ST elevation - this rules out STEMI
- Flat/isoelectric ST segments - the ST segments are horizontal rather than the normal upsloping pattern
- Low-amplitude (flattened) T waves in V4 and V5, marked with blue arrows by the annotator
- No pathological Q waves
- Regular QRS morphology with tall R waves (normal for these leads)
What is NSTEMI?
- Elevated cardiac biomarkers (troponin I or T, CK-MB) - confirming myocyte necrosis
- Absence of ST elevation on ECG
- Clinical presentation consistent with ischemia (chest pain/pressure, dyspnea, diaphoresis)
How NSTEMI Occurs - Pathophysiology
- Plaque rupture - a thin-cap fibroatheroma ruptures, exposing lipid-rich subendothelium to platelets and inflammatory cells, triggering thrombus formation
- Partial thrombotic occlusion - unlike STEMI where the vessel is completely blocked, in NSTEMI blood still trickles through (hence no ST elevation, and subendocardial rather than transmural injury)
- Demand ischemia (Type 2 MI) - severe anemia, hypertensive crisis, acute decompensated heart failure, or any major physiologic stressor can tip the balance even without plaque rupture
ECG Changes in NSTEMI
| Finding | Significance |
|---|---|
| ST depression ≥0.5 mm | Most specific sign of subendocardial ischemia |
| T-wave flattening | Early ischemic change (as seen in your strip V4-V5) |
| T-wave inversion (deep, symmetric) | More advanced ischemia; also Wellens pattern |
| No pathological Q waves | Distinguishes from old transmural MI |
| No ST elevation | Distinguishes from STEMI |
Management of NSTEMI
Immediate Steps
- IV access, continuous ECG monitoring
- Aspirin 162-325 mg (chew immediately)
- Serial troponins (0h / 3h / 6h)
- Supplemental O2 only if SpO2 <90%
Antiplatelet Therapy (Dual)
- Aspirin 162-325 mg loading, then 75-100 mg/day
- P2Y12 inhibitor: Ticagrelor 180 mg load → 90 mg BD (preferred), OR Clopidogrel 300-600 mg load → 75 mg/day
Antithrombins (pick one)
- Enoxaparin 1 mg/kg SC every 12 hours
- Unfractionated heparin 60 units/kg bolus → 12 units/kg/h infusion (titrate aPTT 1.5-2.5x control)
- Fondaparinux 2.5 mg SC daily (preferred if high bleeding risk)
Anti-ischemic
- Nitrates (sublingual GTN, then IV if ongoing pain)
- Beta-blockers (oral, unless contraindicated - HR >110, heart block, acute LV failure, active bronchospasm)
- Statins high-intensity (atorvastatin 80 mg)
Invasive Strategy (Coronary Angiography + PCI)
- Within 2 hours: hemodynamic instability, refractory ischemia, cardiogenic shock
- Within 24 hours (early invasive): elevated troponin, new ST depression, high TIMI/GRACE risk score
- Within 24-48 hours (routine): other high-risk features (prior CABG, EF <40%, VT)
- Conservative/selective strategy: low-risk patients, no recurrent symptoms
Key Difference: NSTEMI vs STEMI at a Glance
| Feature | NSTEMI | STEMI |
|---|---|---|
| Vessel occlusion | Partial (subtotal) | Complete |
| ECG | ST depression / T changes | ST elevation / LBBB |
| Biomarkers | Elevated | Elevated |
| Treatment urgency | Within 24-48 h PCI | Within 90 min PCI |
| Fibrinolysis | Not indicated | Indicated if PCI unavailable |
Clinical note: This ECG strip shows only 3 leads. A full 12-lead ECG is needed to confirm the territory of ischemia and exclude STEMI. Biomarker results (troponin) are essential to distinguish NSTEMI from unstable angina. If this is an active patient presentation, this warrants emergency evaluation.