Approach to VEXAS syndrome when sample of Bone marrow aspirantion came to Pathology lab
VEXAS syndrome UBA1 bone marrow pathology
VEXAS syndrome bone marrow aspirate pathology findings vacuolation UBA1 2024 2025
PMID: 36788756
PMID: 38511841
PMID: 40787890
https://www.ncbi.nlm.nih.gov/books/NBK614471
VEXAS Syndrome: Pathology Lab Approach to Bone Marrow Aspirate
Background
Step 1 - Gross/Pre-Analytical Triage
- Middle-aged/elderly male
- History of: relapsing polychondritis, Sweet syndrome, neutrophilic dermatosis, polyarteritis nodosa, MDS (30-50% of VEXAS), MGUS (10%)
- Unexplained macrocytic anemia, cytopenias, elevated inflammatory markers (CRP, ferritin)
- Recurrent fevers unresponsive to antibiotics
- Venous thromboembolism (40% incidence)
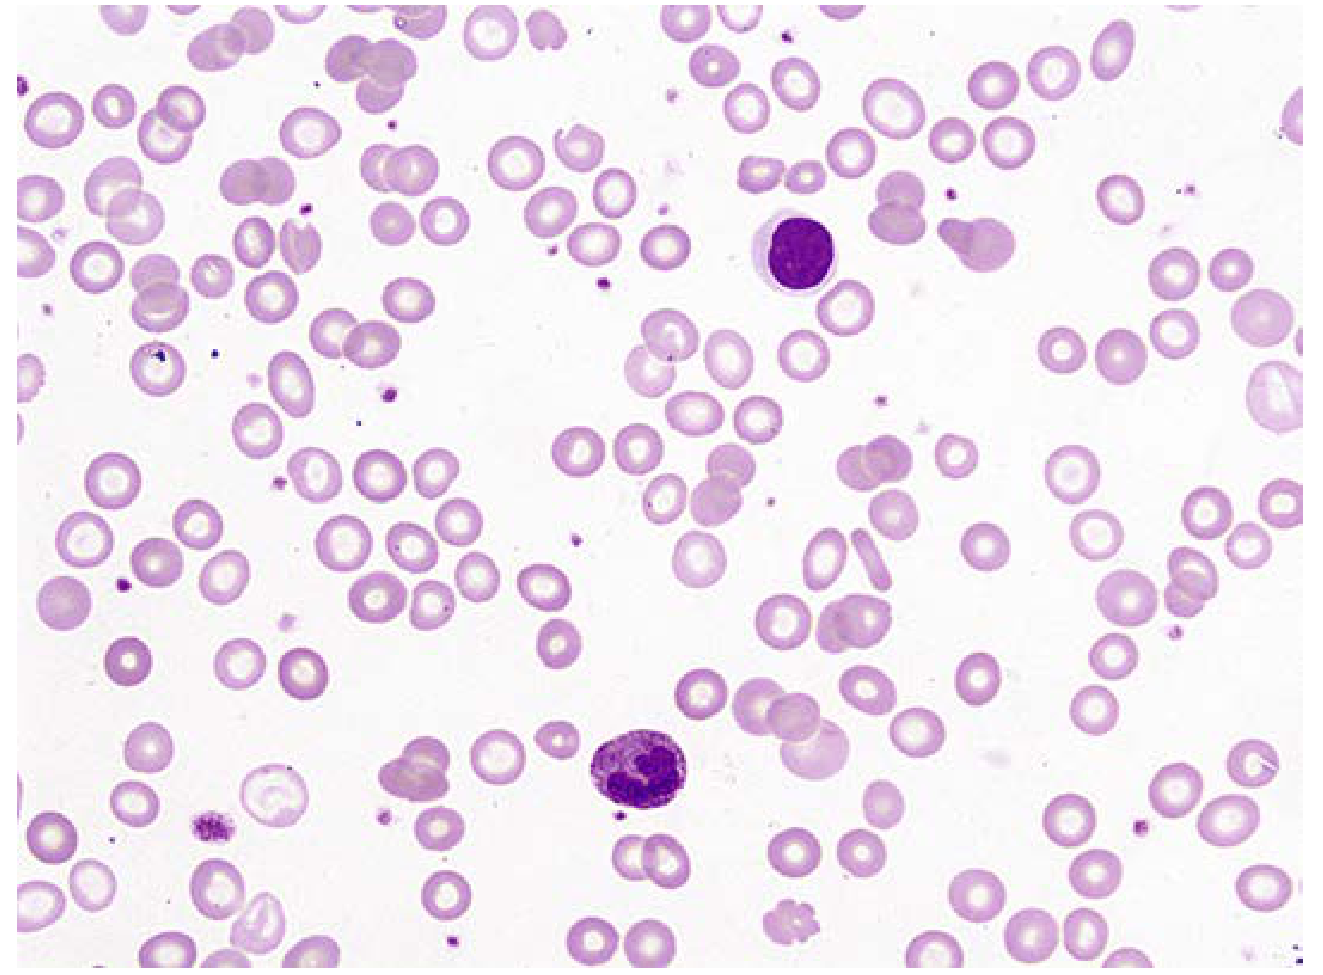
Step 2 - Morphology (The Core Pathology Finding)
Hallmark Finding: Cytoplasmic Vacuolation
| Cell type affected | Vacuolation? |
|---|---|
| Promyelocytes / myelocytes | Yes - most characteristic |
| Erythroid precursors (pronormoblasts, basophilic normoblasts) | Yes |
| Monocytes | Yes |
| Eosinophils | Yes |
| Megakaryocytes | Occasionally |
| Plasma cells | Occasionally |
| Mature lymphocytes | No (lymphoid cells express UBA1 from wild-type X, spared) |
Vacuolation in >10% of neutrophilic (myeloid) precursors, with >1 vacuole per cell = diagnostic threshold for VEXAS (Reumatologia Clinica, 2024).
Other BMA Morphologic Features
| Finding | Description |
|---|---|
| Cellularity | Hypercellular marrow |
| Granulopoiesis | Granulocytic/myeloid hyperplasia and histiocytic hyperplasia |
| Dysplasia | Minimal dyspoiesis (unless concurrent MDS) |
| Blast count | Normal (<5%) unless concurrent AML or MDS |
| Karyotype | Usually normal (standard cytogenetics) |
| Concurrent MDS | Present in 30-50%; look for dysplastic features in all three lineages |
Step 3 - Differential Diagnosis of Vacuolated Myeloid/Erythroid Precursors
| Cause | Key distinguishing features |
|---|---|
| MDS | Dysplastic features, cytogenetic abnormalities, usually older; VEXAS coexists in 30-50% |
| AML (in blasts) | Vacuoles confined to blasts; prominent Auer rods possible |
| Alcoholism | History; vacuolation in erythroid > myeloid; resolves with abstinence |
| Copper deficiency | Low serum copper; vacuolation + ring sideroblasts; often post-gastric surgery |
| Zinc toxicity | High zinc levels cause copper deficiency; same picture |
| Drug/toxin exposure | Chloramphenicol, linezolid, metformin toxicity - clinical history |
| Parvovirus B19 | Erythroid "lantern cells," giant pronormoblasts; serology |
| Lymphoproliferative / myeloma | Different morphologic context |
Step 4 - Pathology Report Language
- Presence, degree, and lineage(s) of vacuolation (myeloid, erythroid, or both)
- Estimated percentage of affected precursors
- Presence or absence of concurrent dysplasia/MDS features
- A specific comment recommending UBA1 molecular testing if the clinical picture is compatible
"Prominent cytoplasmic vacuolation is identified in myeloid and erythroid precursors affecting approximately X% of neutrophilic precursors. In the appropriate clinical context (systemic inflammation, cytopenias, elderly male), this morphology is consistent with VEXAS syndrome. Correlation with UBA1 molecular sequencing of peripheral blood is strongly recommended."
Step 5 - Triaging Molecular Testing (Done on Peripheral Blood, Not Just BMA)
- Peripheral blood (whole blood) - preferred, sufficient in most cases
- Bone marrow aspirate specimen itself
UBA1 Mutation Hotspots
- p.Met41Val - most common (~60%)
- p.Met41Thr - second most common
- p.Met41Leu - less common
- Rare variants outside this region exist
Recommended Molecular Test
- Targeted amplicon sequencing / Sanger sequencing of UBA1 exon 3 (fast, cost-effective first step)
- Or a myeloid mutation NGS panel that includes UBA1 (if ordering a panel for concurrent MDS workup anyway - efficient parallel testing)
Step 6 - Concurrent Hematologic Malignancy Workup
- Complete BMA morphologic assessment for MDS (WHO 2022 criteria)
- Cytogenetics (conventional karyotype + FISH panel)
- Flow cytometry (myeloid phenotyping, plasma cell quantification)
- Full myeloid NGS panel (DNMT3A, TET2, ASXL1, SF3B1, etc.) - these co-occur with UBA1 mutations
Step 7 - Summary Diagnostic Algorithm (Pathology Perspective)
BMA received → examine smear
         |
         ↓
Cytoplasmic vacuoles in myeloid/erythroid precursors?
         |
    YES  |
         ↓
>10% neutrophil precursors affected?
         |
    YES  |
         ↓
Assess clinical context: elderly male + systemic inflammation?
         |
    YES  |
         ↓
Comment in report → recommend UBA1 sequencing (peripheral blood)
         + concurrent MDS workup (karyotype, flow, myeloid NGS panel)
         |
         ↓
UBA1 p.Met41 mutation confirmed → DIAGNOSIS: VEXAS syndrome
Key Takeaways for Pathologists
- Vacuolation of myeloid AND erythroid precursors in a middle-aged/elderly man with inflammation = always consider VEXAS first.
- The >10% myeloid precursor vacuolation threshold achieves 100% sensitivity and specificity in validated series.
- Standardize your report language - explicitly mention VEXAS and recommend UBA1 testing rather than attributing vacuolation to "non-specific dysplasia."
- MDS and VEXAS coexist frequently - do not let an MDS diagnosis satisfy the workup without excluding VEXAS.
- UBA1 testing is most practically done on peripheral blood - the pathologist can request this without waiting for a repeat BMA.
- Skin biopsy in VEXAS shows neutrophilic dermatosis (similar to Sweet syndrome) with immature myeloid infiltrates carrying the same UBA1 mutation - if skin biopsy is also available, this further supports the diagnosis.
- Goldman-Cecil Medicine (2024), Chapter on Autoinflammatory Diseases
- Harrison's Principles of Internal Medicine 22E (2025), FUO chapter
- Cherniawsky H et al. "VEXAS syndrome: A review of bone marrow aspirate and biopsies reporting myeloid and erythroid precursor vacuolation." Eur J Haematol 2023. PMID 36788756
- Hagiya A et al. "How I diagnose and manage VEXAS syndrome." Am J Clin Pathol 2024. PMID 38511841
- Mekinian A et al. "ACR Guidance Statement for Diagnosis and Management of VEXAS - International VEXAS Working Group." Arthritis Rheumatol 2026. PMID 40787890 - first formal international consensus guidance
Haemoglobinised red cells in PS dd
haemoglobinised red cells peripheral smear differential diagnosis hypochromic hyperchromic morphology
Haemoglobinised Red Cells on Peripheral Smear - Differential Diagnosis
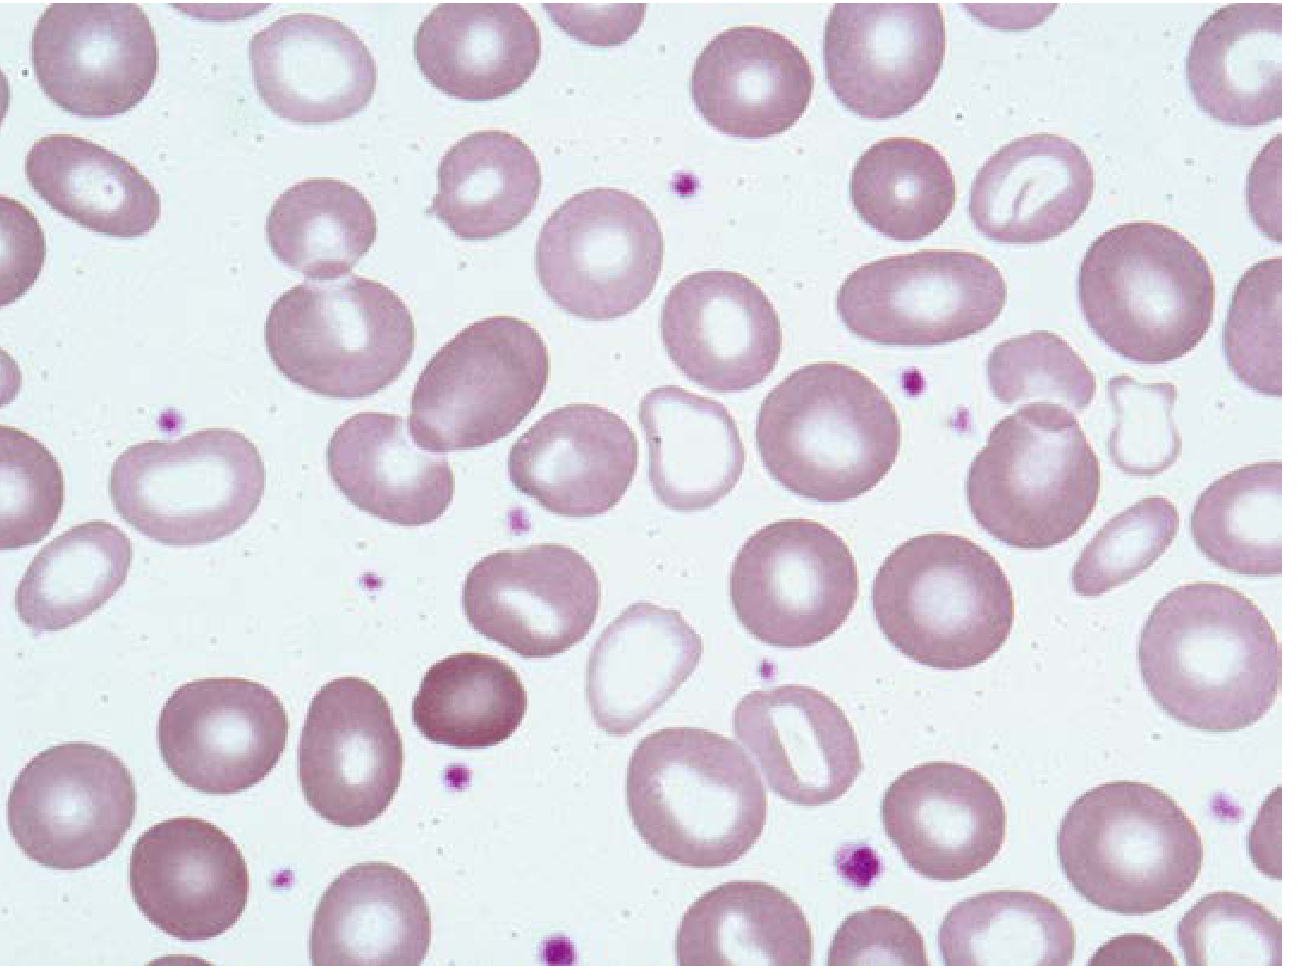
Category 1 - HYPOCHROMIC Red Cells (Reduced Hb Content)
Differential Diagnosis of Hypochromic Cells
| Condition | Key PS Clues | Distinguishing Labs |
|---|---|---|
| Iron Deficiency Anemia (IDA) | Microcytic + hypochromic, pencil cells, occasional elliptocytes, thrombocytosis | Low serum ferritin, low iron, high TIBC, low transferrin saturation |
| Thalassemia (α or β) | Microcytic + hypochromic, target cells, basophilic stippling, nucleated RBCs (severe), elliptocytes, pencil cells | Normal/high serum iron; HbA2 ↑ in β-thal trait; Hb electrophoresis abnormal; disproportionate microcytosis for Hb level |
| Anemia of Chronic Disease/Inflammation | Normochromic-normocytic usually, but hypochromic-microcytic in longstanding disease | Low iron, low TIBC, normal/high ferritin, high hepcidin |
| Sideroblastic Anemia | Dimorphic film (see Category 4 below) - mixed hypochromic + normochromic cells; coarse basophilic stippling | High serum iron, ring sideroblasts on Perls' stain of BMA |
| Lead Poisoning | Hypochromic + coarse basophilic stippling + polychromasia | Elevated blood lead level, elevated free erythrocyte protoporphyrin |
| Copper Deficiency | Hypochromic + vacuolated precursors on BMA | Low serum copper, often post-bariatric/gastric surgery |
Pearl: In thalassemia trait, the microcytosis is disproportionately severe for the degree of anaemia (Mentzer index <13), while in IDA the anaemia is worse relative to MCV drop (Mentzer index >13). However, overlap exists and Hb electrophoresis is definitive.
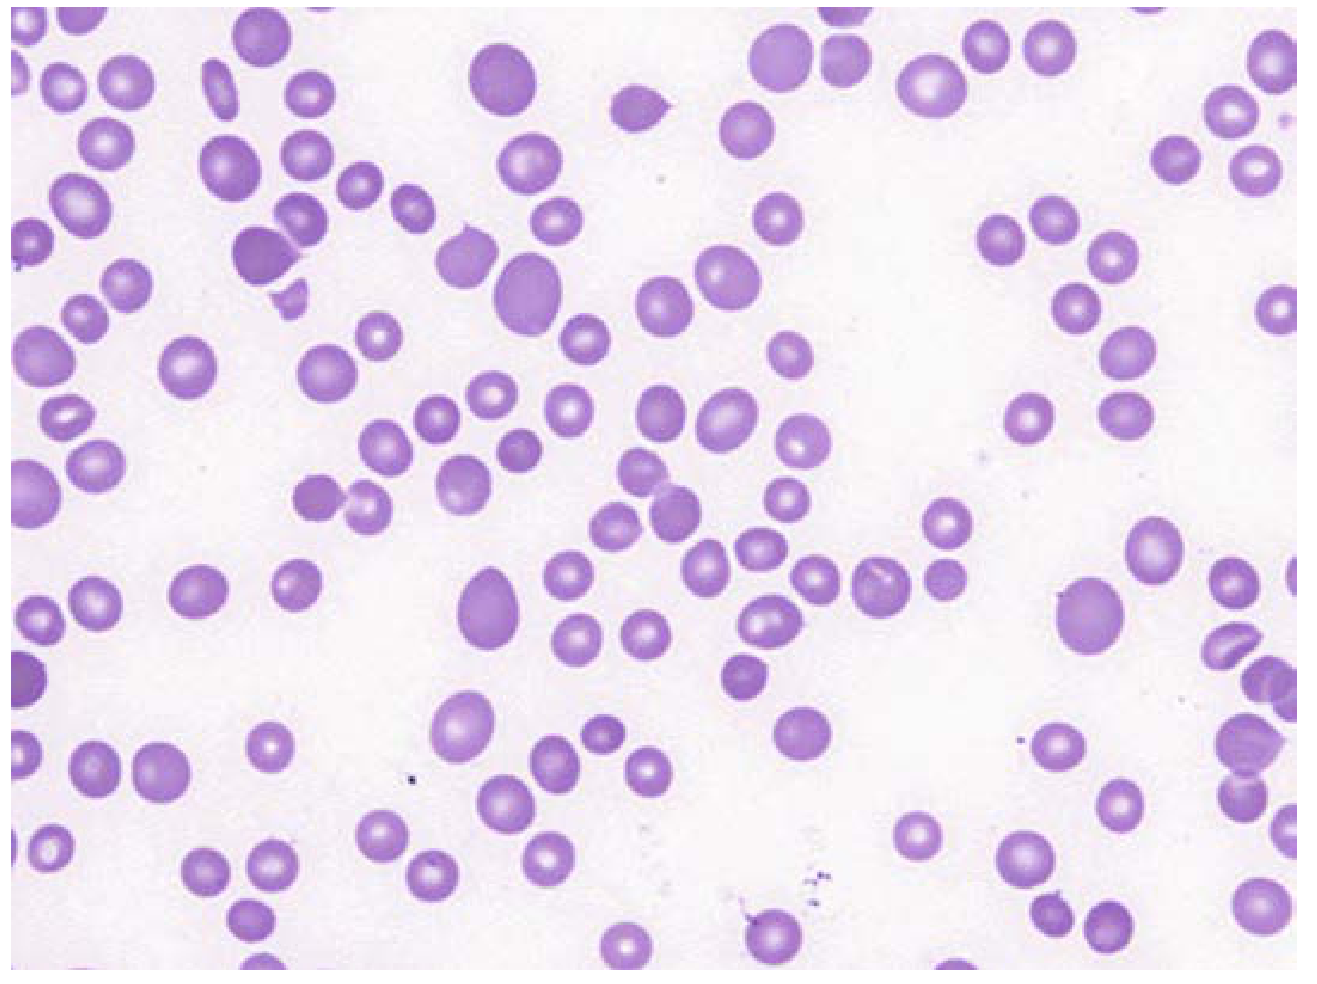
Category 2 - HYPERCHROMIC Red Cells (Increased Hb Density)
Differential Diagnosis of Hyperchromic Cells
| Condition | Mechanism | Key PS Clues |
|---|---|---|
| Spherocytes (Hereditary Spherocytosis, AIHA) | Reduced surface area:volume ratio → MCHC genuinely ↑ | Small, round, no central pallor, microspherocytes; MCH normal but MCHC ↑ |
| Megaloblastic Anemia (B12/folate deficiency) | Larger, thicker cells → appear hyperchromic but MCHC normal | Macro-ovalocytes, hypersegmented neutrophils (≥5 lobes), anisocytosis, poikilocytosis |
| Liver Disease (without folate def.) | Target cells + macrocytes (thin, flat) - appear hyperchromic centrally | Round macrocytes, target cells, acanthocytes (spur cells in cirrhosis) |
| Hypothyroidism | Macrocytes, normochromic-normocytic usually | Round macrocytes, no hypersegmented neutrophils |
Critical note: True hyperchromia (elevated MCHC) is essentially pathognomonic of spherocytes. When the analyzer flags high MCHC, always look for spherocytes on the smear. Any MCHC >36 g/dL should prompt a manual PS review.
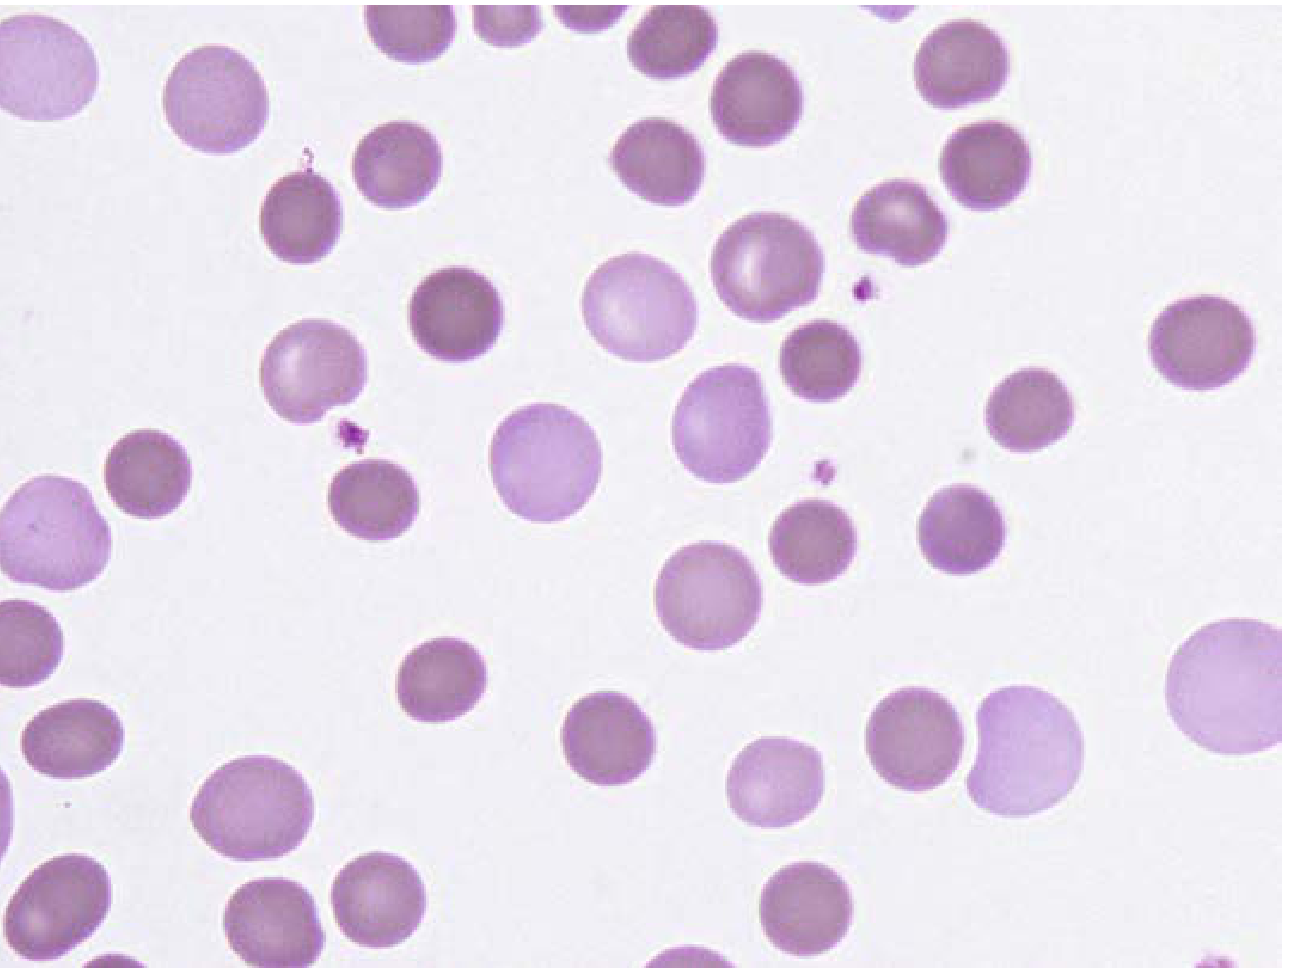
Category 3 - POLYCHROMATIC (Polychromatophilic) Red Cells
| Category | Examples |
|---|---|
| Hemolytic anemia | Most marked polychromasia; AIHA, hereditary spherocytosis, G6PD deficiency, sickle cell, thalassemia major, MAHA |
| Acute blood loss | Reactive reticulocytosis 3-7 days post-hemorrhage |
| Response to treatment | Iron therapy for IDA, B12/folate for megaloblastic anemia - polychromasia appears within ~1 week |
| Neonatal period | Physiological in newborns |
| Erythropoietin therapy | In CKD patients on EPO |
A polychromatic cell on Wright's stain is larger than a mature RBC and lacks central pallor. Marked polychromasia with anemia = hemolysis until proven otherwise.
Category 4 - DIMORPHIC Red Cell Population (Mixed Haemoglobinisation)
Differential Diagnosis of Dimorphic Film
| Condition | Details |
|---|---|
| Sideroblastic anemia | Classic dimorphic film; congenital form = one pop. hypochromic microcytes + one normochromic normocytes; acquired MDS-RS = macrocytes + hypochromic cells |
| IDA on iron therapy | New normochromic cells appearing alongside residual old hypochromic cells; appears ~1-3 weeks after starting iron |
| Post-transfusion | Transfused normochromic normocytes mixed with patient's own hypochromic cells |
| Dual deficiency (IDA + B12/folate) | Microcytic hypochromic cells + macro-ovalocytes; MCV may be paradoxically normal ("masking effect") |
| HbH disease (α-thal --/-α) | Hypochromic microcytes + HbH inclusion-bearing cells |
Category 5 - ABNORMAL Hb DISTRIBUTION WITHIN THE CELL (Special Patterns)
5a. Target Cells (Codocytes)
- Haemoglobin C disease (most target cells per field)
- Anemia - thalassemia (β > α)
- Liver disease (obstructive jaundice, cirrhosis)
- Thalassemia
- Chromic - post-splenectomy / asplenia
5b. Sickle Cells (Drepanocytes)
5c. Heinz Bodies / Bite Cells
5d. HbH Inclusion Bodies
5e. Hemoglobin C Crystals
Summary Algorithm: Approach to Haemoglobinisation Abnormality on PS
Observe RBC colour/Hb pattern
            |
   ┌─────────────────────────────────────┐
   │                                     │
Hypochromic                        Hyperchromic/No pallor
(large central pallor)             ─────────────────────
   │                                Macrocytes → B12/folate, liver disease
   ↓                                Spherocytes → HS, AIHA
IDA / Thalassemia /                 (confirm with osmotic fragility / DAT)
ACD / Sideroblastic /
Lead poisoning
   │
   ↓
Check: Is the film DIMORPHIC?
→ YES → Sideroblastic anemia / iron therapy / post-transfusion / dual deficiency
→ NO → Iron studies + Hb electrophoresis
            |
   ┌─────────────────────────┐
   │                         │
Low ferritin             Normal/High iron
→ IDA                    + HbA2 ↑ → β-thal trait
                         + HbA2 normal, microcytosis → α-thal
                         + Ring sideroblasts → Sideroblastic anemia

Check also:
Polychromasia? → Reticulocytosis → Hemolysis / blood loss / response to Rx
Target cells? → HALT C causes
Bite cells? → G6PD/oxidant hemolysis (supravital stain)
Sickle cells? → Sickling disorders
- Henry's Clinical Diagnosis and Management by Laboratory Methods, Chapter 31 (Hemoglobin Content, Color, Polychromatophilia)
- Henry's Clinical Diagnosis and Management, Chapter 33 (Microcytic/Hypochromic anemias, Dimorphic anemias)
- Goldman-Cecil Medicine (Microcytic Anemias, Sideroblastic Anemia)
- Tietz Textbook of Laboratory Medicine 7E (Red Blood Cell Parameters)
- Robbins Pathologic Basis of Disease (Iron Deficiency Anemia, peripheral smear)
Role of IPF ,RHe,LFR,MFR,HFR in coulter
Beckman Coulter DxH IPF RHe LFR MFR HFR reticulocyte fluorescence fraction clinical significance 2024
immature platelet fraction IPF thrombocytopenia clinical utility
reticulocyte hemoglobin equivalent iron deficiency diagnosis bone marrow transplant
reticulocyte hemoglobin equivalent Ret-He iron deficiency anemia CKD diagnosis
PMID: 40035091
RHe reticulocyte hemoglobin equivalent Beckman Coulter DxH functional iron deficiency clinical use EPO therapy 2023 2024
Advanced Coulter Hematology Parameters: IPF, RHe, LFR, MFR, HFR
Important note on nomenclature: These parameters exist on multiple platforms with different names for the same concept:
- Beckman Coulter (DxH): uses RHe (Reticulocyte Haemoglobin equivalent), LFR/MFR/HFR, IPF
- Sysmex: uses RET-He (same concept as RHe), IRF (= MFR + HFR sum), IPF
- Siemens ADVIA: uses CHr (same concept as RHe)
RHe/RET-He/CHr are functionally equivalent and the literature uses them interchangeably.
PART 1 - LFR, MFR, HFR (Reticulocyte Maturity Fractions)
What They Measure
| Fraction | Abbreviation | RNA Content | Maturity | % of Total Retics (normal) |
|---|---|---|---|---|
| Low Fluorescence Ratio | LFR | Low | Most mature reticulocytes | ~88-98% |
| Medium Fluorescence Ratio | MFR | Intermediate | Semi-mature reticulocytes | ~1.6-11% |
| High Fluorescence Ratio | HFR | High | Most immature (just released from marrow) | ~0-1.7% |
Biological Principle
- High HFR/MFR = reticulocytes just exited the bone marrow = intense erythropoietic drive
- High LFR = predominantly mature reticulocytes = steady-state or recovering erythropoiesis
- The IRF rises before the total reticulocyte count increases - it is the earliest indicator of marrow erythroid activation
Clinical Applications of LFR/MFR/HFR
1. Bone Marrow Transplant (BMT) / Stem Cell Transplant Engraftment Monitoring
- Earlier cessation of G-CSF and prophylactic antibiotics
- Earlier discharge planning
- Cost savings
2. Monitoring Response to Treatment in Nutritional Anemias
- In iron deficiency anemia on iron therapy: IRF rises within days of effective treatment, well before reticulocyte count or Hb changes - useful for early confirmation of response
- In megaloblastic anemia on B12/folate: same early IRF rise signals effective marrow stimulation
- In EPO therapy for CKD: rising IRF confirms pharmacological erythropoietic response
3. Differential Diagnosis of Anemia
| Condition | Retic count | IRF (MFR+HFR) | LFR | Interpretation |
|---|---|---|---|---|
| Hemolytic anemia | ↑↑ | ↑↑ | ↓ | Active marrow compensating for destruction |
| Acute blood loss | ↑ | ↑ | ↓ | Active marrow response |
| IDA, untreated | Low/normal | Low/normal | ↑ | Hypoproliferative; insufficient iron for erythropoiesis |
| Thalassemia | ↑ | ↑ (MFR+HFR higher than IDA) | ↓ | Ineffective but hyperactive erythropoiesis |
| CKD (no EPO) | ↓ | ↓ | ↑ | EPO deficiency → hypoproliferative |
| Aplastic anemia | ↓↓ | ↓↓ | ↑ | Marrow failure |
| MDS/dyserythropoiesis | ↓ retic | ↑ IRF | - | Dissociation = ineffective erythropoiesis (marrow active but output poor) |
Key clinical rule: A dissociation between low reticulocyte count and high IRF = ineffective erythropoiesis (MDS, megaloblastic, thalassemia).
4. Neonatal Assessment
- Used to assess transfusion needs in premature neonates
- IRF higher in premature infants; rising IRF indicates erythropoietic recovery
5. Aplastic Crisis Detection
- In compensated hemolytic anemia (e.g., hereditary spherocytosis), a sudden fall in IRF precedes the reticulocyte drop during a parvovirus B19-induced aplastic crisis - gives earlier warning
PART 2 - RHe (Reticulocyte Haemoglobin Equivalent)
What It Measures
- Units: pg/cell (same as MCH)
- Normal range: approximately 28-35 pg (exact range varies; most use >28 pg as normal)
- Key cut-off for iron deficiency: RHe/RET-He < 28 pg = iron-deficient erythropoiesis
Why It Is Superior to Conventional Iron Markers
| Parameter | Problem | RHe Advantage |
|---|---|---|
| Serum ferritin | Acute phase reactant - falsely normal in inflammation/infection | RHe unaffected by inflammation |
| Serum iron / TIBC | Daily variation up to 30%, affected by meals, diurnal rhythm | RHe stable, no diurnal variation |
| MCH / MCV | Reflects iron status of 90-day old RBCs - lags by weeks | RHe reflects iron availability in the last 24-48 hours |
| Transferrin saturation | Affected by inflammation, liver disease | RHe directly measures iron incorporation |
RHe is a real-time mirror of iron availability for erythropoiesis - it reflects the iron status at the moment the reticulocyte was being produced, not weeks ago.
Clinical Applications of RHe
1. Diagnosis of Iron Deficiency Anemia (IDA)
2. Diagnosis of Functional Iron Deficiency (FID)
- CKD patients on EPO therapy - EPO drives erythropoiesis faster than iron stores can release iron
- Post-surgical/ICU patients on IV iron + EPO
- Inflammation states - hepcidin blocks iron release from macrophages
- Serum ferritin is NORMAL or HIGH (misleading)
- TSAT may be borderline
- RHe is LOW (<28 pg) → reveals that despite adequate stores, iron is not reaching the erythroblast
3. Monitoring Response to Iron Therapy
- Iron deficiency without anemia
- Functional iron deficiency
- True iron deficiency anemia
- Iron replete erythropoiesis
4. Preoperative Assessment
5. Screening Blood Donors
PART 3 - IPF (Immature Platelet Fraction)
What It Measures
- IPF % (percentage of total platelets)
- Absolute IPF (IPF × platelet count = immature platelet count in /μL)
Biological Principle
- High IPF = bone marrow megakaryopoiesis is active, producing/releasing many new platelets → seen when platelet destruction/consumption is high (marrow compensating)
- Low IPF = megakaryocyte production is suppressed or absent → hypoproductive thrombocytopenia
- IPF rises before the platelet count recovers - it is the earliest indicator of thrombopoietic recovery
Clinical Applications of IPF
1. Differential Diagnosis of Thrombocytopenia
| Condition | Platelet Count | IPF % | Absolute IPF | Interpretation |
|---|---|---|---|---|
| ITP (Immune Thrombocytopenic Purpura) | ↓↓ | ↑↑ (often >10%) | ↑ or normal | Destruction → marrow compensates → ↑ immature retic platelets |
| TTP/HUS, DIC | ↓↓ | ↑↑ | ↑ | Consumption → marrow hyperdrive |
| Aplastic anemia | ↓↓ | ↓ or normal | ↓↓ | Marrow failure → no new platelets being made |
| Chemotherapy-induced | ↓↓ | ↓ | ↓↓ | Myelosuppression |
| MDS with thrombocytopenia | ↓ | Variable (low-normal) | ↓ | Hypoproliferative + ineffective |
| Liver cirrhosis (hypersplenism) | ↓ | Low/normal | Low | Splenic sequestration + reduced TPO |
| Sepsis | ↓ | Variable | May be elevated | Consumption ± marrow suppression |
| Post-transplant recovery | ↓ (recovering) | ↑ (first to rise) | ↑ | Megakaryocyte engraftment beginning |
Clinical pearl: In a patient with thrombocytopenia of unknown cause, high IPF (>10%) + low platelet count = peripheral destruction (ITP, TTP, DIC, drug-induced) = NO bone marrow biopsy needed in most cases. Low IPF + low platelet count = marrow failure = bone marrow biopsy indicated.
2. BMT/SCT Engraftment Monitoring
- Earlier platelet transfusion cessation
- Earlier confirmation of graft function
- Earlier hospital discharge trigger
3. Guiding Platelet Transfusion Timing
- High IPF in a thrombocytopenic patient = marrow is producing platelets → own platelets are coming → transfusion may not be urgently needed (especially in ITP)
- Low IPF = marrow is not making new platelets → transfusion support needed sooner
4. Sepsis Management
5. Other Applications
- COVID-19: Elevated IPF was observed in thrombocytopenic COVID-19 patients, reflecting immune-mediated platelet destruction
- DIC: High IPF confirms peripheral consumption
- Essential thrombocythemia / thrombocytosis: IPF may help distinguish reactive from clonal thrombocytosis
- Plateletpheresis quality control: IPF of the product reflects the proportion of metabolically active young platelets
Summary Integration: Using All Parameters Together
Thrombocytopenia
    ├── IPF ↑ → Peripheral destruction (ITP, TTP, DIC, sepsis)
    └── IPF ↓ → Marrow failure (aplasia, chemo, MDS)

Anemia with reticulocytopenia
    ├── IRF (MFR+HFR) ↑ but retics ↓ → Ineffective erythropoiesis (MDS, megaloblastic)
    └── IRF ↓ + retics ↓ → Marrow failure / EPO deficiency

Anemia with reticulocytosis
    └── IRF ↑ + retics ↑ → Hemolysis / blood loss / treatment response

Iron status (regardless of ferritin)
    ├── RHe < 28 pg → Iron deficient erythropoiesis (true OR functional)
    └── RHe > 28 pg + low ferritin → Pre-latent iron deficiency

Post-transplant monitoring
    HFR rises first → MFR rises → Absolute retics rise → Hb rises (erythroid)
    IPF rises first → Platelet count rises (platelet lineage)
| Parameter | Reference Range |
|---|---|
| LFR | 87.9 - 98.4% |
| MFR | 1.6 - 11.0% |
| HFR | 0.0 - 1.7% |
| IRF (MFR+HFR) | 1.6 - 12.1% |
| RHe / RET-He | 28 - 35 pg (IDA cut-off: <28 pg) |
| IPF | 0.8 - 5.6% (median ~2.2%) |
- Tietz Textbook of Laboratory Medicine 7E, Sections on IRF, Reticulocyte Hb Content, IPF (Chapter 74/77)
- Henry's Clinical Diagnosis and Management by Laboratory Methods, Chapter 31 (Reticulated Platelets)
- Zhang Y et al. "From reticulated platelets to immature platelet fraction." Platelets 2025. PMID 40035091
- Poventud-Fuentes I et al. RET-He in pediatric IDA. Int J Lab Hematol 2023
- PMC Reference range study: PMC5119661