give complete ch-17 from guyton physiology without removing any point , add grphs or diagrams wherever req
Reading File
Finding Sources
Finding Sources
Finding Sources
Finding Sources
Finding Sources
Finding Sources
Finding Sources
Reading File
Reading File
Reading File
Reading File
Reading File
Loading Image
That is the complete Chapter 17: Local and Humoral Control of Tissue Blood Flow from Guyton and Hall, 14th Edition. Here is a quick orientation of everything covered:
Chapter 17 - Complete Coverage Summary
| Section | Key Content |
|---|---|
| Local Blood Flow Controlled by Tissue Needs | 6 metabolic needs; Table 17.1 (organ blood flows); importance of minimal-adequate flow |
| Mechanisms of Local Control | Acute (seconds-minutes) vs. Long-term (days-weeks) |
| Acute Control | Vasodilator theory (adenosine, CO₂, K⁺, H⁺, histamine); Oxygen demand theory |
| Reactive Hyperemia | 4-7× normal flow after occlusion release; repays oxygen debt |
| Active Hyperemia | Up to 20× flow during exercise; matches metabolic demand (Fig. 17.4 shown above) |
| Autoregulation | Metabolic + myogenic mechanisms; 70-175 mmHg range with only 20-30% flow change (Fig. 17.5) |
| Endothelium-Derived Factors | NO (vasodilator, shear-stress released, PDE-5 inhibitors); Endothelin (vasoconstrictor, 21-AA peptide, damage-released) |
| Long-Term Regulation | Angiogenesis (VEGF, FGF, PDGF), collateral development, vascular remodeling |
| Vascular Remodeling | A-V fistula example; shear → outward remodeling; pressure → hypertrophy |
| Humoral Vasoconstrictors | Norepinephrine, Epinephrine, Angiotensin II (1 µg raises BP 50 mmHg), Vasopressin |
| Humoral Vasodilators | Bradykinin (ACE degrades it - explains ACE inhibitor cough), Histamine, Prostaglandins |
| Ionic Control | Ca²⁺↑ = constrict; K⁺↑, Mg²⁺↑, H⁺↑, CO₂↑, anoxia = dilate |
ch18
Finding Sources
Reading File
Reading File
Reading File
Loading Image
Reading File
Loading Image
Reading File
Loading Image
I now have all the content needed. Let me compile the complete Chapter 18.
Chapter 18: Nervous Regulation of the Circulation and Rapid Control of Arterial Pressure
Guyton and Hall Textbook of Medical Physiology, 14th Edition
NERVOUS REGULATION OF THE CIRCULATION
As discussed in Chapter 17, adjustment of blood flow in the tissues and organs of the body is mainly the function of local tissue control mechanisms. The nervous system controls the circulation almost entirely through the autonomic nervous system and has more global functions, such as:
- Redistributing blood flow to different areas of the body
- Increasing or decreasing pumping activity by the heart
- Providing rapid control of systemic arterial pressure
The total function of the autonomic nervous system is presented in Chapter 61, but this chapter considers additional specific anatomical and functional characteristics.
AUTONOMIC NERVOUS SYSTEM
The most important part of the autonomic nervous system for regulating the circulation is the sympathetic nervous system. The parasympathetic nervous system, however, contributes importantly to regulation of heart function.
Sympathetic Nervous System Anatomy
Fig. 18.1 illustrates the anatomy of sympathetic nervous control of the circulation. Sympathetic vasomotor nerve fibers leave the spinal cord through:
- All the thoracic spinal nerves
- The first one or two lumbar spinal nerves
They then pass immediately into a sympathetic chain (one on each side of the vertebral column) and reach the circulation by two routes:
- Through specific sympathetic nerves innervating mainly the vasculature of the internal viscera and the heart
- Into peripheral portions of the spinal nerves distributed to the vasculature of peripheral areas
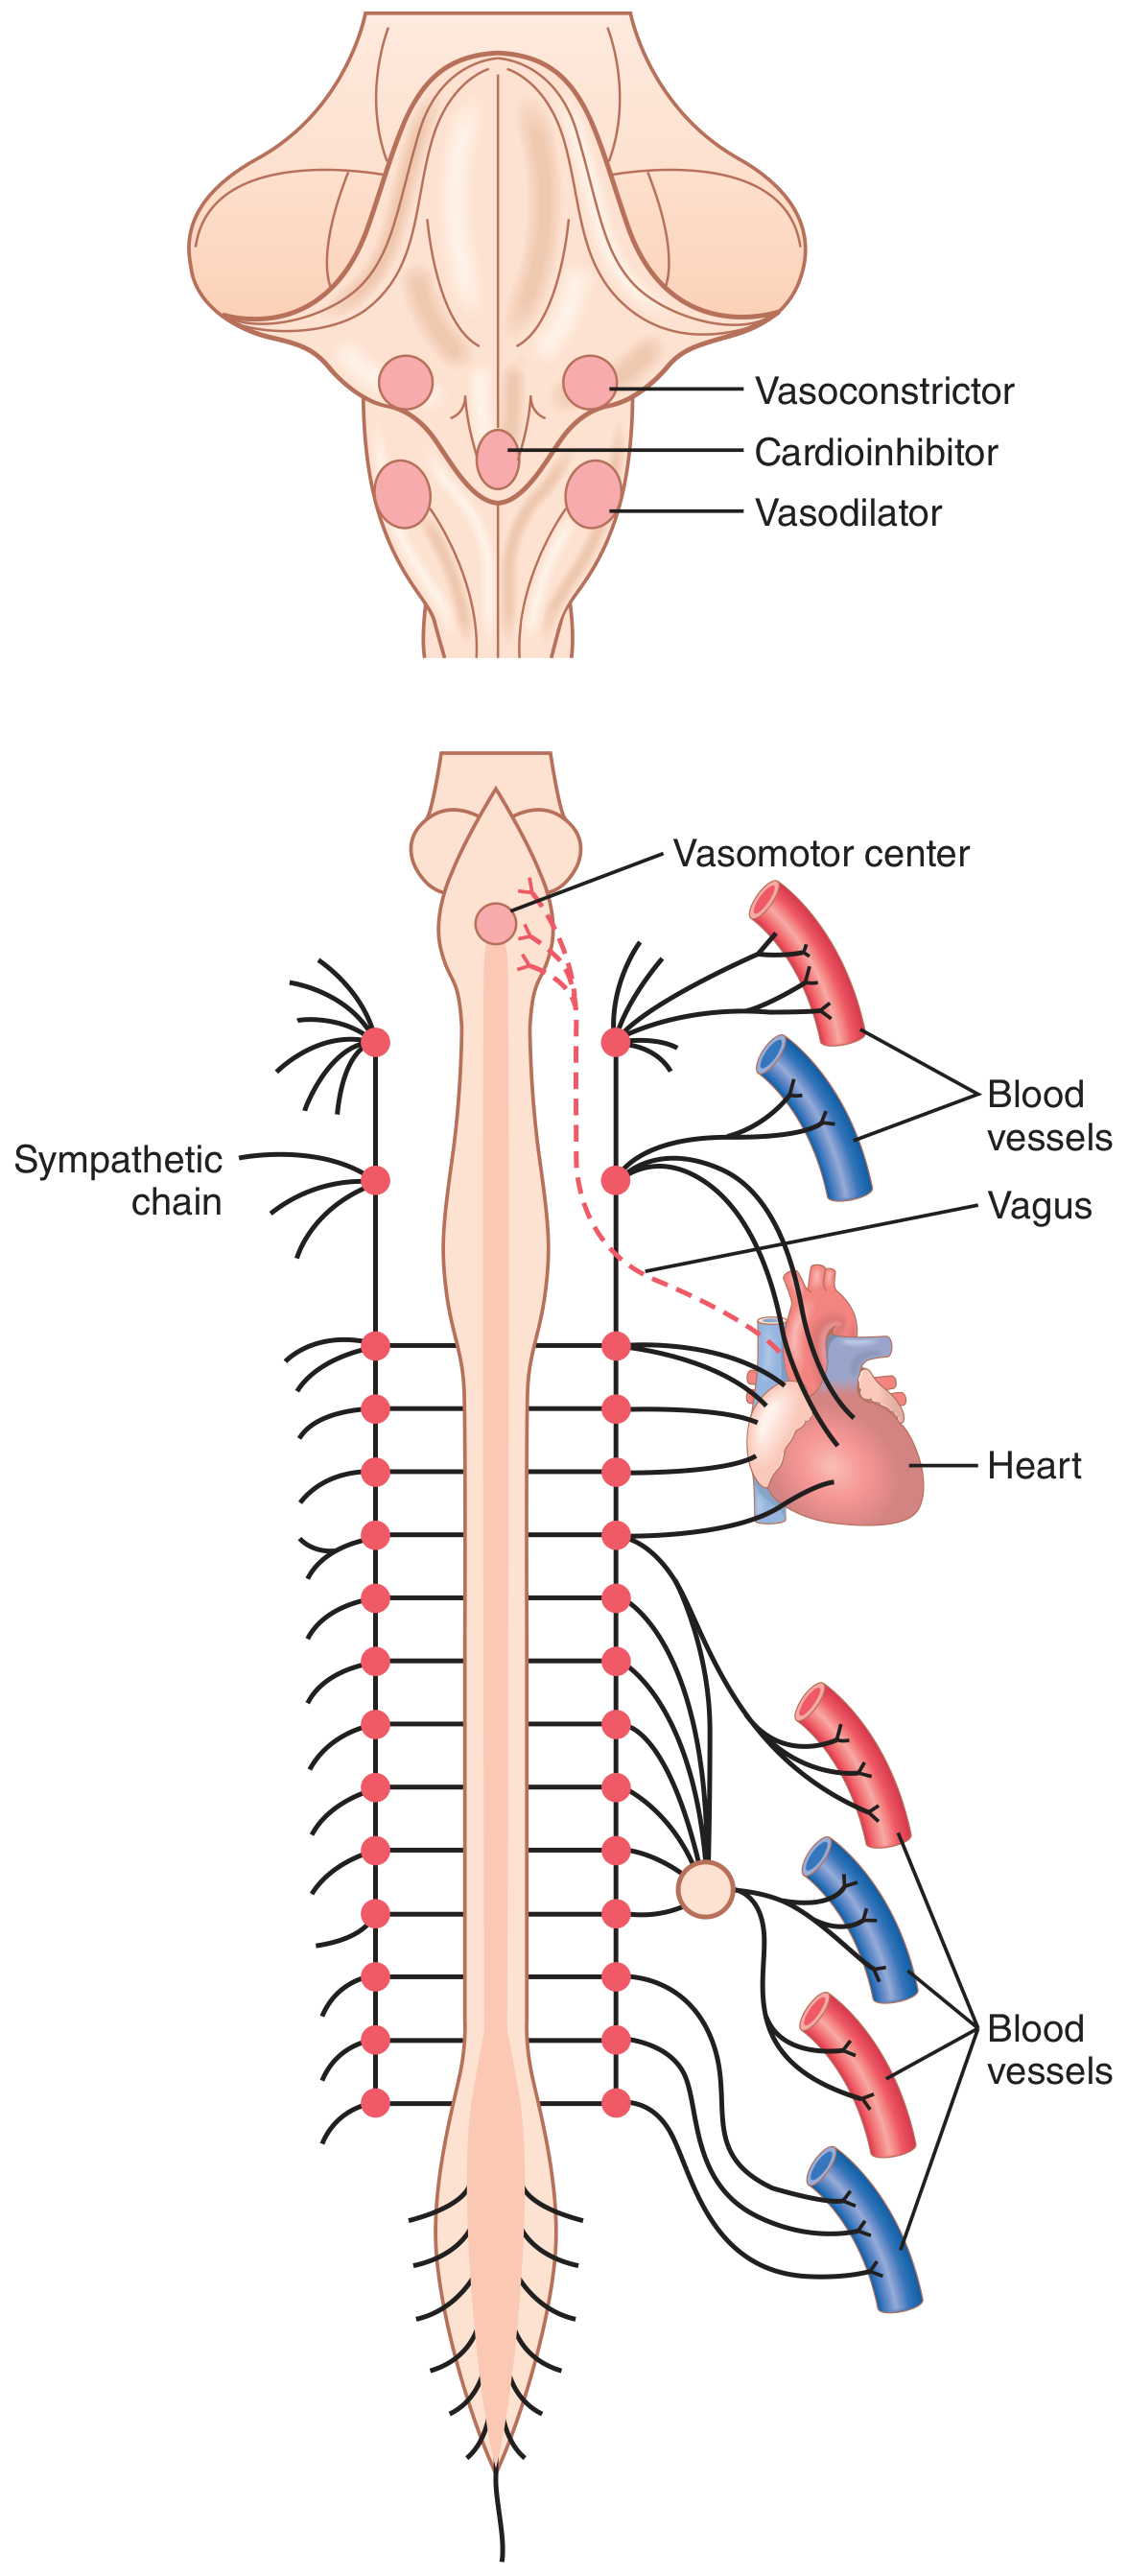
Figure 18.1 - Anatomy of sympathetic nervous control of the circulation. The dashed red line is the vagus nerve carrying parasympathetic signals to the heart.
Sympathetic Innervation of Blood Vessels
Fig. 18.2 shows the distribution of sympathetic nerve fibers to the blood vessels. In most tissues, all vessels except the capillaries are innervated. Precapillary sphincters and metarterioles are innervated in some tissues (e.g., mesenteric vessels), but innervation is less dense than in small arteries, arterioles, and veins.
- Innervation of small arteries and arterioles allows sympathetic stimulation to increase resistance to blood flow and thereby decrease the rate of blood flow through the tissues.
- Innervation of large vessels (especially veins) makes it possible for sympathetic stimulation to decrease the volume of these vessels. This pushes blood into the heart and plays a major role in regulation of heart pumping.
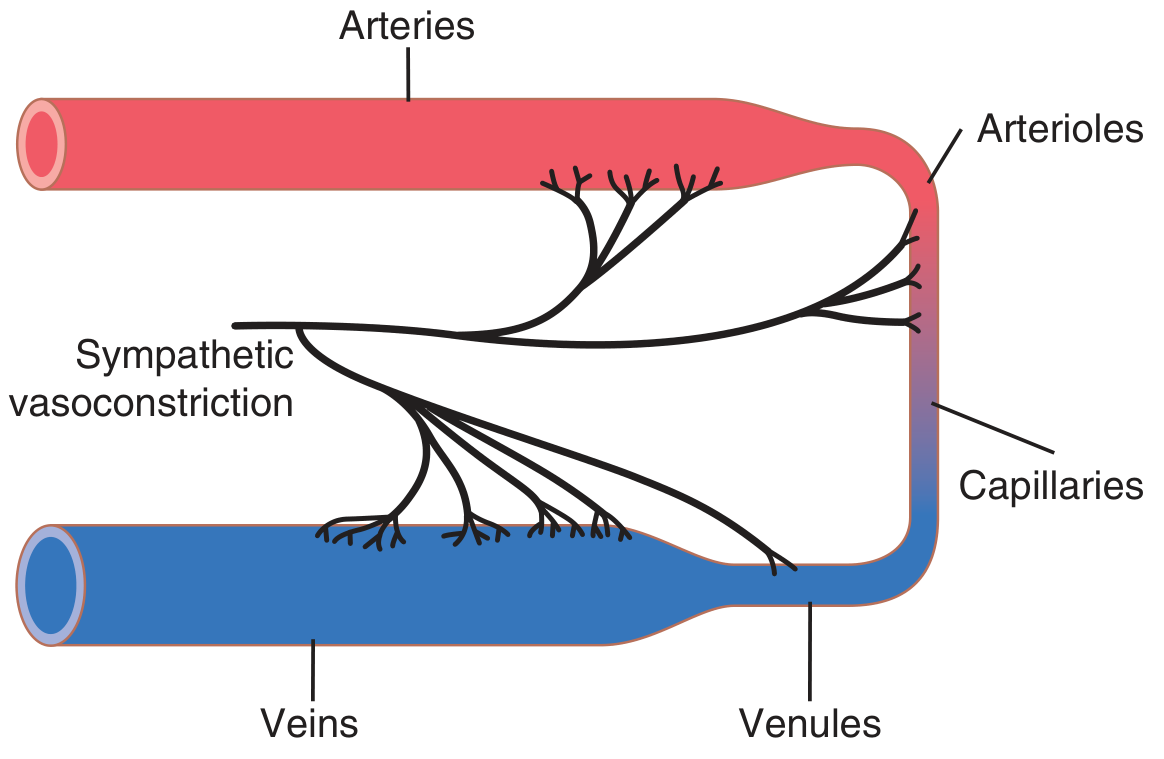
Figure 18.2 - Sympathetic innervation of the systemic circulation.
Sympathetic Stimulation Increases Heart Rate and Contractility
Sympathetic fibers go directly to the heart (Fig. 18.1). Sympathetic stimulation markedly increases:
- Heart rate
- Strength and volume of pumping
Parasympathetic Stimulation Decreases Heart Rate and Contractility
The parasympathetic nervous system plays only a minor role in regulating vascular function in most tissues. However, it has a major role in controlling heart rate via parasympathetic nerve fibers in the vagus nerves to the heart (shown by the dashed red line in Fig. 18.1). Principally, parasympathetic stimulation causes:
- Marked decrease in heart rate
- Slight decrease in heart muscle contractility
Sympathetic Vasoconstrictor System and Its Control by the Central Nervous System
The sympathetic nerves carry large numbers of vasoconstrictor nerve fibers and only a few vasodilator fibers. The vasoconstrictor fibers are distributed to essentially all segments of the circulation, but this effect is especially powerful in:
- Kidneys
- Intestines
- Spleen
- Skin
The effect is much less potent in skeletal muscle, heart, and brain.
The Brain Vasomotor Center
Located bilaterally mainly in the reticular substance of the medulla and lower third of the pons is an area called the vasomotor center (Fig. 18.1 and Fig. 18.3). This center transmits:
- Parasympathetic impulses through the vagus nerves to the heart
- Sympathetic impulses through the spinal cord and peripheral sympathetic nerves to virtually all arteries, arterioles, and veins
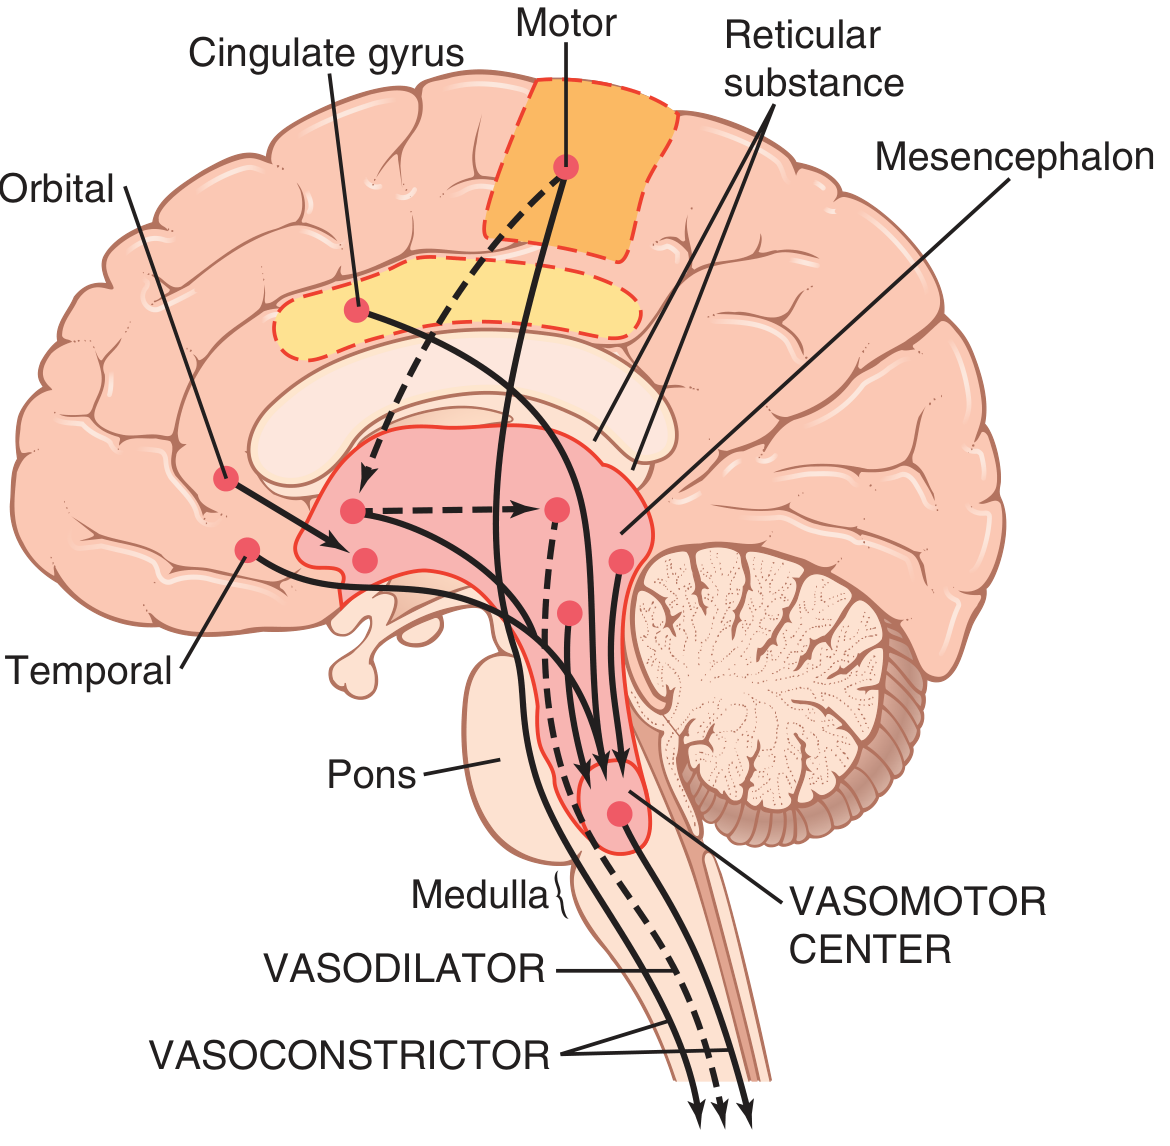
Figure 18.3 - Areas of the brain that play important roles in the nervous regulation of the circulation. Dashed lines represent inhibitory pathways.
The major areas in the vasomotor center are:
-
Vasoconstrictor area - located bilaterally in the anterolateral portions of the upper medulla. Neurons from this area distribute fibers to all levels of the spinal cord, where they excite preganglionic vasoconstrictor neurons of the sympathetic nervous system.
-
Vasodilator area - located bilaterally in the anterolateral portions of the lower half of the medulla. Fibers project upward to the vasoconstrictor area and inhibit its vasoconstrictor activity, causing vasodilation.
-
Sensory area - located bilaterally in the nucleus tractus solitarius (NTS) in the posterolateral portions of the medulla and lower pons. Neurons receive sensory nerve signals from the circulatory system (mainly through vagus and glossopharyngeal nerves). Output signals from this sensory area help control vasoconstrictor and vasodilator areas, providing reflex control of many circulatory functions (e.g., the baroreceptor reflex).
Continuous Sympathetic Vasoconstrictor Tone
Normally, the vasoconstrictor area of the vasomotor center transmits signals continuously to the sympathetic vasoconstrictor nerve fibers throughout the body, causing continuous slow firing of these fibers at a rate of about one-half to two nerve impulses per second. This continuous firing is called sympathetic vasoconstrictor tone. These impulses maintain a partial state of contraction in the blood vessels - called vasomotor tone.
Control of the Vasomotor Center by Higher Brain Areas
The vasomotor center is controlled by higher brain regions including:
- Hypothalamus - can exert powerful excitatory or inhibitory effects on the vasomotor center. The posterolateral hypothalamus generally causes excitation, while the anterior hypothalamus can cause mild inhibition.
- Motor cortex and other cortical areas - can transmit impulses to the hypothalamus that modify vasomotor activity during emotional states, exercise, etc.
- Limbic system - involved in emotional control of blood pressure (e.g., blushing, fainting from extreme fear/excitement)
Figure 18.3 schematic summary:HIGHER BRAIN CENTERS (Hypothalamus, Cortex, Limbic) │ ▼ VASOMOTOR CENTER (Medulla/Pons) ┌──────────────────────────────────┐ │ 1. Vasoconstrictor area (upper │ │ medulla - anterolateral) │ │ 2. Vasodilator area (lower │ │ medulla - anterolateral) │ │ 3. Sensory area (NTS - │ │ posterolateral) │ └─────┬──────────────────┬─────────┘ │ Sympathetic │ Parasympathetic ▼ ▼ (via vagus) Blood vessels Heart (vasoconstriction/ (↓ HR, ↓ contractility) vasodilation)
Norepinephrine Is the Sympathetic Vasoconstrictor Neurotransmitter
The neurotransmitter secreted at the endings of the vasoconstrictor fibers is norepinephrine. Norepinephrine acts directly on alpha-adrenergic receptors of the vascular smooth muscle to cause vasoconstriction.
Role of the Nervous System in Rapid Control of Arterial Pressure
One of the most important functions of sympathetic nervous system control of the circulation is its ability to cause rapid increases in arterial pressure. Stimulation of the vasoconstrictor and cardioaccelerator areas of the vasomotor center increases arterial pressure in several ways:
- Constriction of arterioles throughout most of the systemic circulation → increased peripheral resistance → increased arterial pressure
- Constriction of veins (and large vessels) → displaces blood from peripheral veins toward the heart → increases cardiac filling pressure → heart pumps with greater force → further increases arterial pressure
- Direct stimulation of the heart → increased heart rate and contractility → increased cardiac output → increased arterial pressure
The nervous system is capable of increasing the mean arterial pressure to well over 200 mm Hg within a few seconds through maximal activation. Conversely, inhibition of the nervous system can decrease the mean arterial pressure to as low as 50 mm Hg within seconds.
Schematic - Sympathetic activation effects on arterial pressure:Sympathetic Activation │ ├──→ Arteriolar constriction │ → ↑ Total Peripheral Resistance │ → ↑ Arterial Pressure │ ├──→ Venous constriction │ → ↑ Venous return │ → ↑ Cardiac output (Frank-Starling) │ → ↑ Arterial Pressure │ └──→ ↑ Heart rate + ↑ Contractility → ↑ Cardiac output → ↑ Arterial Pressure
Increases in Arterial Pressure During Muscle Exercise and Other Stresses
During exercise, the nervous system plays a critical role. At the onset of exercise:
- Motor cortex and hypothalamus send signals simultaneously to:
- Contracting muscles (to initiate contraction)
- The vasomotor center (to increase sympathetic output)
- This pre-programmed" neural signal immediately increases heart rate, contractility, and vasoconstriction in visceral organs
- Simultaneously, local metabolic vasodilation occurs in active muscles (opposing the vasoconstriction)
- Net result: large increase in cardiac output with redistribution of flow to muscles and away from viscera
Other stresses (fear, pain, anxiety) similarly activate the hypothalamus and limbic system to raise arterial pressure via the vasomotor center.
REFLEX MECHANISMS FOR MAINTAINING NORMAL ARTERIAL PRESSURE
Baroreceptor Arterial Pressure Control
The baroreceptors (pressoreceptors) are the most important of the nervous mechanisms for controlling arterial pressure. They operate as a negative feedback system to prevent excessive rises or falls in arterial pressure on a moment-to-moment basis.
Physiologic Anatomy of the Baroreceptors and Their Innervation
Baroreceptors are spray-type nerve endings that lie in the walls of the arteries and are stimulated when stretched. A few baroreceptors are located in the wall of almost every large artery of the thoracic and neck regions but are extremely abundant in:
- The wall of each internal carotid artery slightly above the carotid bifurcation - the carotid sinus
- The wall of the aortic arch
Signals from:
- Carotid baroreceptors → transmitted through Hering's nerves → glossopharyngeal nerves (CN IX) → nucleus tractus solitarius of the medullary brainstem
- Aortic baroreceptors → transmitted through vagus nerves (CN X) → same nucleus tractus solitarius of the medulla
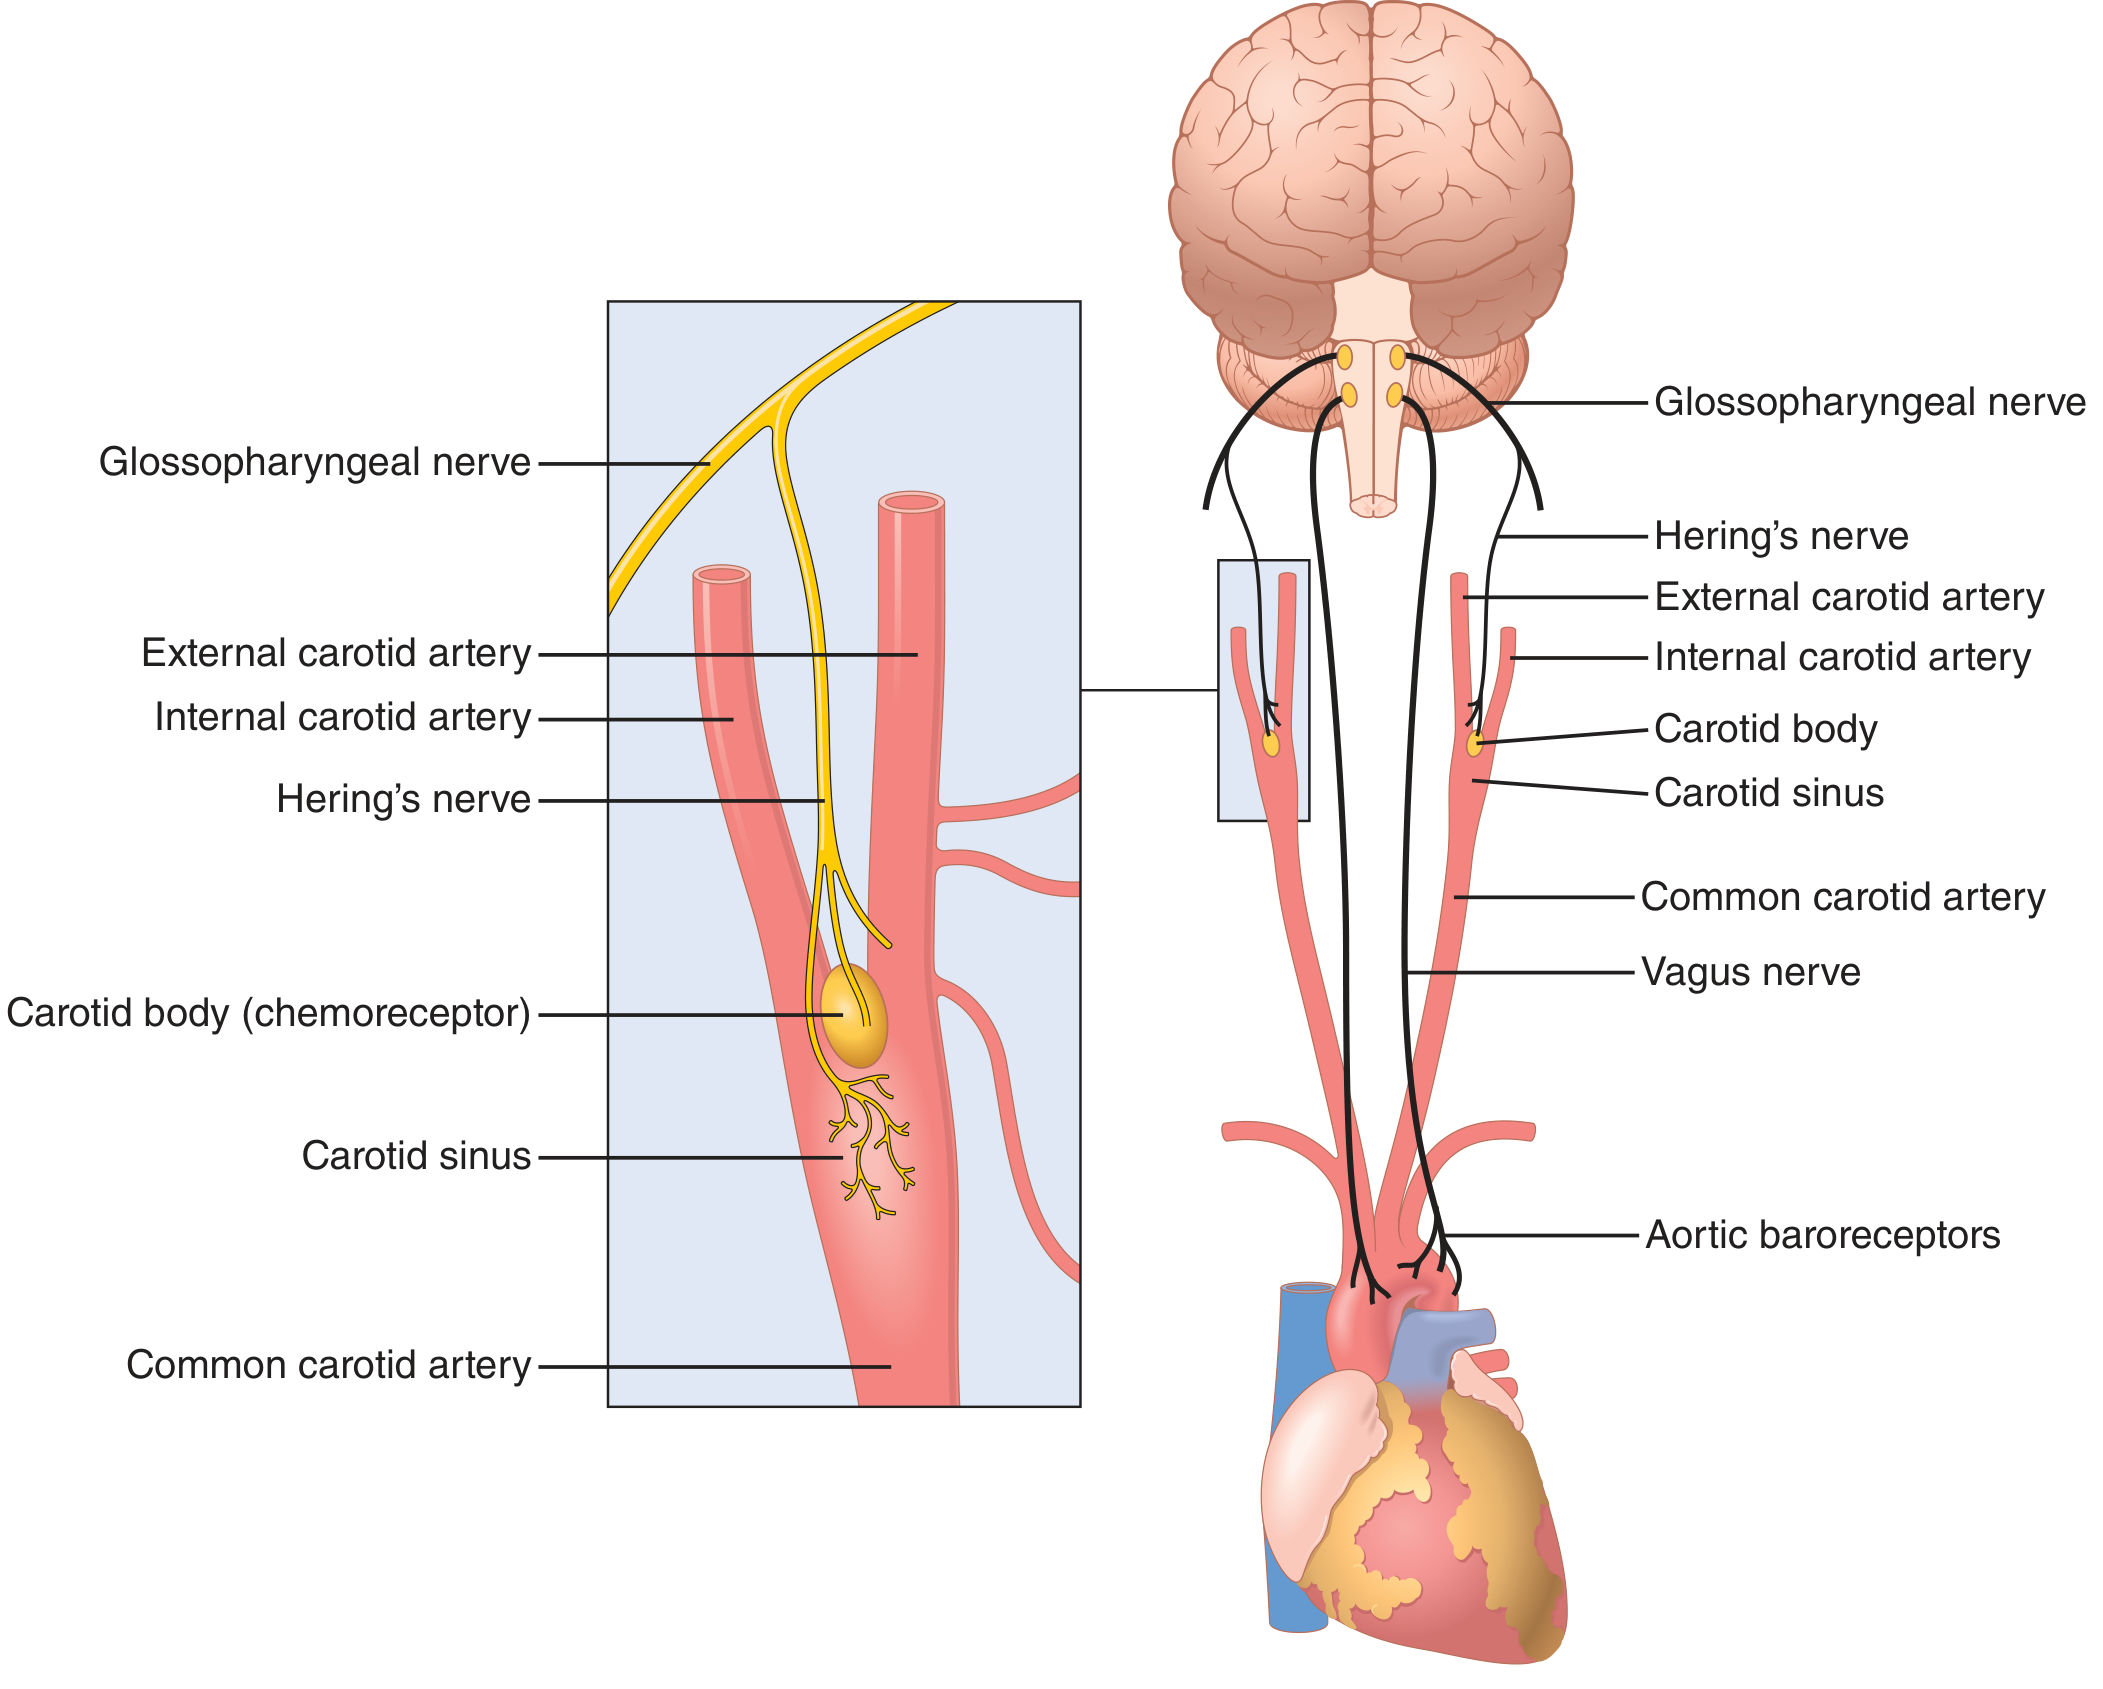
Figure 18.5 - Baroreceptor system for controlling arterial pressure. Left inset shows the carotid sinus and carotid body anatomy with Hering's nerve. Right shows the complete circuit from carotid sinus and aortic arch to the brain.
Response of the Baroreceptors to Changes in Arterial Pressure
Fig. 18.6 shows the effects of different arterial pressure levels on the rate of impulse transmission in Hering's carotid sinus nerve:
- Carotid sinus baroreceptors: not stimulated at pressures between 0 and 50-60 mm Hg; respond progressively above this level; reach maximum at about 180 mm Hg
- Aortic baroreceptors: similar but operate at arterial pressure levels about 30 mm Hg higher than carotid receptors
- Most sensitive range: around 100 mm Hg (normal operating range) - even a slight change in pressure causes a strong change in the baroreflex signal
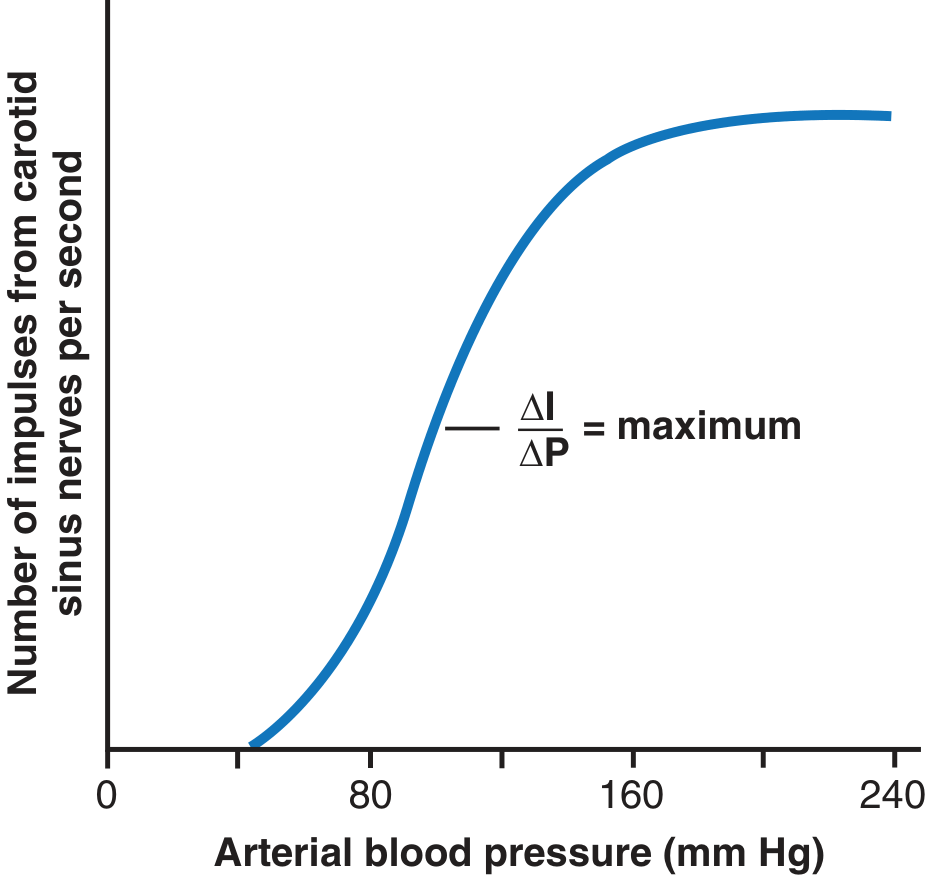
Figure 18.6 - Activation of the baroreceptors at different levels of arterial pressure. The slope (ΔI/ΔP) is maximum around the normal operating pressure of ~100 mmHg, making the system most sensitive where it is most needed.
The baroreceptors also respond to dynamic changes:
- Rate of impulse firing increases in the fraction of a second during each systole and decreases again during diastole
- Baroreceptors respond much more to a rapidly changing pressure than to a stationary pressure
- If mean arterial pressure is 150 mm Hg but is rising rapidly, the rate of impulse transmission may be as much as twice that when pressure is stationary at 150 mm Hg
Circulatory Reflex Initiated by the Baroreceptors
After baroreceptor signals enter the nucleus tractus solitarius of the medulla, secondary signals:
- Inhibit the vasoconstrictor center of the medulla
- Excite the vagal parasympathetic center
The net effects are:
- Vasodilation of veins and arterioles throughout the peripheral circulatory system
- Decreased heart rate and strength of heart contraction
Therefore, excitation of baroreceptors by high pressure reflexly causes arterial pressure to fall back toward normal. Conversely, low pressure has the opposite effect.
Baroreceptor Reflex Arc - Schematic:↑ Arterial Pressure │ ▼ Baroreceptors stretched (Carotid sinus + Aortic arch) │ ▼ Afferent signals CN IX (Hering's nerve → glossopharyngeal) CN X (vagus) → NTS of medulla │ ├──→ INHIBIT vasoconstrictor center │ → Arteriolar/venous dilation │ → ↓ Peripheral resistance │ └──→ EXCITE vagal (parasympathetic) center → ↓ Heart rate → ↓ Contractility → ↓ Cardiac output │ ▼ ↓ Arterial Pressure (restored toward normal)
Typical Carotid Sinus Reflex - Experimental Example
Fig. 18.7 shows the typical carotid sinus reflex effect on aortic arterial pressure caused by clamping both common carotid arteries (after cutting the two vagus nerves). When both carotid arteries are clamped, blood pressure in the carotid sinuses falls - baroreceptors are unloaded - vasomotor center is released from inhibition - arterial pressure rises sharply. This demonstrates the powerful tonic inhibitory effect of baroreceptors on the vasomotor center under normal conditions.
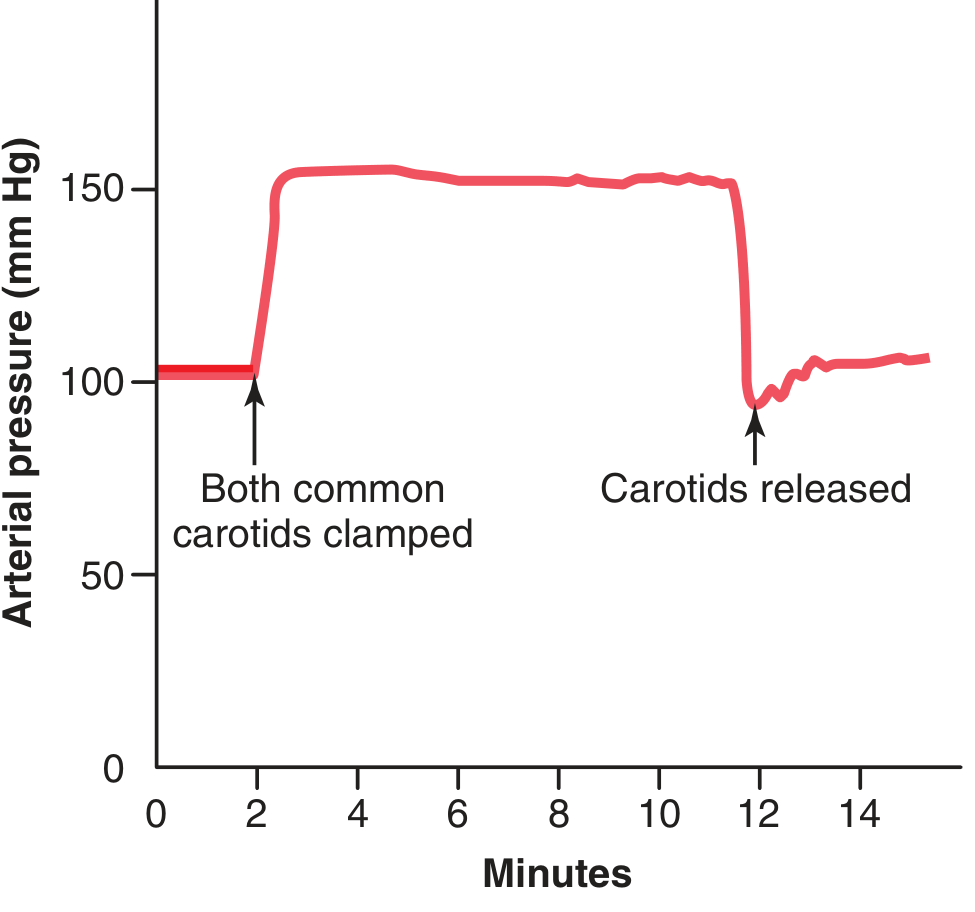
Figure 18.7 - Typical carotid sinus reflex effect: clamping both common carotid arteries causes a large, rapid rise in aortic arterial pressure because baroreceptors in the carotid sinuses are deprived of stretch, releasing the vasomotor center from inhibition.
Buffer Function of the Baroreceptors - Damping Day-to-Day Pressure Variation
Fig. 18.8 shows the importance of the buffer function of baroreceptors. The upper panel shows arterial pressure recording for 2 hours from a normal dog; the lower panel from a dog whose baroreceptor nerves from carotid sinuses and the aorta had been removed (denervated). Note the extreme variability of pressure in the denervated dog caused by simple events:
- Lying down / standing
- Excitement
- Eating
- Defecation
- Noises
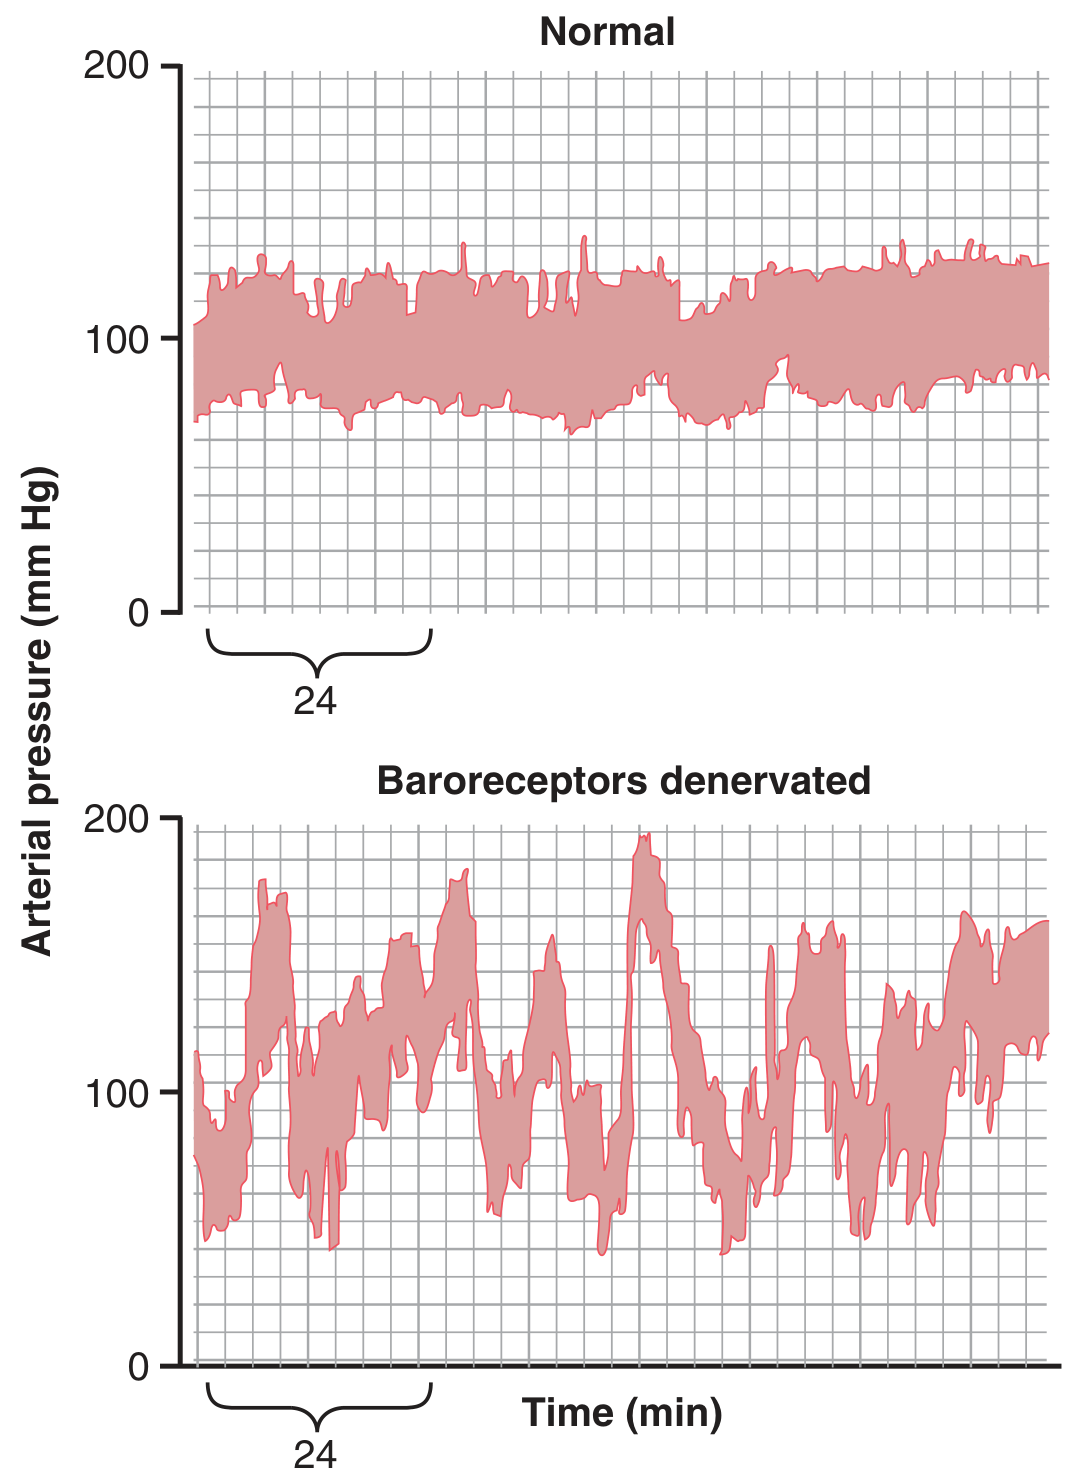
Figure 18.8 - Two-hour records of arterial pressure in a normal dog (top, narrow variation) and in the same dog after baroreceptor denervation (bottom, extreme variability with normal activities). (Modified from Cowley AW, Liard JF, Guyton AC, Circ Res. 1973)
Fig. 18.9 shows frequency distributions of mean arterial pressures for 24 hours:
- Normal dog: pressure remained within a narrow range of 85 to 115 mm Hg for most of the day, mostly at about 100 mm Hg
- Denervated dog: frequency distribution curve flattened - pressure range increased 2.5-fold, frequently falling to as low as 50 mm Hg or rising to more than 160 mm Hg
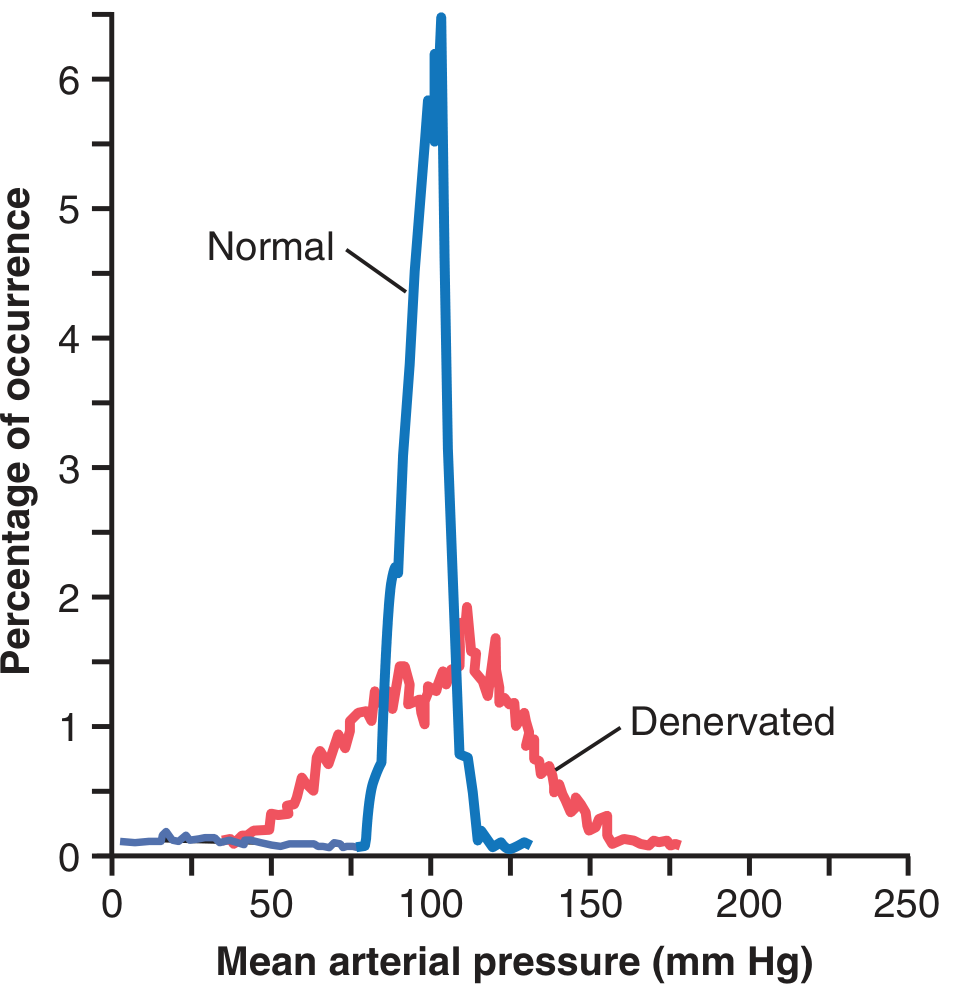
Figure 18.9 - Frequency distribution curves of arterial pressure for a 24-hour period in normal vs. baroreceptor-denervated dog. Normal: narrow peak at 100 mmHg. Denervated: flattened, widely spread distribution. (Modified from Cowley AW, Liard JP, Guyton AC, Circ Res. 1973)
A primary purpose of the arterial baroreceptor system is therefore to reduce the minute-by-minute variation in arterial pressure to about one-third that which would occur if the baroreceptor system were not present.
Are the Baroreceptors Important in Long-Term Regulation of Arterial Pressure?
The importance of baroreceptors in long-term blood pressure regulation has been controversial. One reason that baroreceptors have been considered by some physiologists to be relatively unimportant in chronic regulation is that they tend to reset in 1 to 2 days to whatever pressure level they are exposed to. That is, if arterial pressure rises to 160 mm Hg, the baroreceptors reset at the higher pressure and begin to maintain pressure at 160 mm Hg instead of 100 mm Hg.
However, more recent evidence suggests baroreceptors do play a role in long-term pressure control, particularly through their effects on renal function and renal sympathetic nerve activity, which in turn affects kidney sodium excretion and blood volume.
Control of Arterial Pressure by the Carotid and Aortic Chemoreceptors - Effect of Low Oxygen
Closely associated with the baroreceptor pressure control system is a chemoreceptor reflex. The chemoreceptors are small chemosensitive cells located in several chemoreceptor organs:
- Two carotid bodies - one near the bifurcation of each common carotid artery
- One to three aortic bodies - adjacent to the aorta
Each of these chemoreceptor organs receives its own blood supply through a small nutrient artery and has nerve fibers that pass to the vasomotor center.
Stimuli for chemoreceptors:
- Decreased oxygen in the blood (most important)
- Excess carbon dioxide
- Excess hydrogen ions
The chemoreceptors transmit signals to the vasomotor center to excite it, thereby raising arterial pressure. The chemoreceptor reflex is not a powerful controller of arterial pressure under normal conditions because normal arterial pressure is well above the threshold for significant oxygen deficiency. However, whenever arterial pressure falls below a critical level (roughly 80 mm Hg), the chemoreceptors become excited (because blood flow to them is insufficient, causing oxygen depletion and CO₂/acid buildup) and help raise arterial pressure back toward normal.
Atrial and Pulmonary Artery Reflexes (Low-Pressure Receptors)
The atria and pulmonary arteries have stretch receptors called low-pressure receptors (also called cardiopulmonary receptors or volume receptors). These receptors:
- Respond to volume changes rather than arterial pressure changes
- Are important in the control of blood volume and water intake/output
When atria become stretched (increased blood volume):
- The heart rate increases markedly (the Bainbridge reflex - increased heart rate when blood volume increases; mediated by both increased atrial stretch and sympathetic stimulation from the vasomotor center)
- The kidneys are signaled to excrete more sodium and water (through reduced ADH secretion and reduced aldosterone - helping to normalize blood volume)
Thus, the atrial reflex mechanisms help regulate blood volume, which in turn helps regulate arterial pressure in the long term.
Atrial Reflexes That Control Heart Rate - the Bainbridge Reflex
An increase in atrial pressure causes an increase in heart rate - sometimes called the Bainbridge reflex. The stretch of the atria:
- Directly stretches the sinoatrial (SA) node - can increase heart rate by 15% to 40%
- Sends nerve signals to the vasomotor center, which transmits reflex signals back to the heart via sympathetics to increase heart rate further
The significance of the Bainbridge reflex is to prevent damming up of blood in the veins, atria, and pulmonary circulation.
Decreased Blood Flow to the Brain - CNS Ischemic Response
When blood flow to the vasomotor center in the brain decreases sufficiently to cause nutritional deficiency (ischemia), the neurons in the vasomotor center respond strongly. This is called the CNS ischemic response (or Cushing's reaction). It is one of the most powerful activators of the sympathetic vasoconstrictor system. The mechanism is:
- Brain ischemia → local CO₂ accumulation + decreased O₂ + H⁺ accumulation → direct activation of vasomotor center neurons
- Intense sympathetic discharge → extreme vasoconstriction throughout the body
- Arterial pressure can rise to as high as 250 mm Hg within minutes
Cushing Reaction
When pressure in the cerebrospinal fluid (CSF) rises to approximately equal to arterial pressure, it compresses the entire brain and arteries in the brain and cuts off the blood supply to the brain. This ischemia of the vasomotor center elicits the CNS ischemic response (extreme sympathetic discharge), which raises arterial pressure. If the arterial pressure rises enough above the CSF pressure, blood flow to the brain is restored. This response is called the Cushing reaction. It acts as an emergency arterial pressure control mechanism to restore cerebral blood flow when brain compression threatens.
CNS Ischemic Response Sequence:↓ Cerebral blood flow (e.g., ↑ CSF pressure / severe hypotension) │ ▼ Brain ischemia: ↑ CO₂, ↓ O₂, ↑ H⁺ in vasomotor center neurons │ ▼ Maximal sympathetic discharge │ ▼ Extreme peripheral vasoconstriction + ↑ heart rate + ↑ contractility │ ▼ ↑↑↑ Arterial pressure (up to 250 mmHg) │ ▼ Cerebral blood flow restored → Ischemia relieved
Important note: The CNS ischemic response is not activated until arterial pressure falls below 60 mm Hg and becomes strongest between 15 and 20 mm Hg. Therefore, it serves as a last-resort emergency mechanism rather than a routine pressure control mechanism.
SPECIAL FEATURES OF NERVOUS CONTROL OF ARTERIAL PRESSURE
Role of the Skeletal Nerves and Skeletal Muscles in Increasing Cardiac Output and Arterial Pressure
During muscle exercise or other motor activities:
- The motor cortex activates skeletal muscles via motor nerve fibers
- Simultaneously, it transmits collateral signals to the vasomotor center to increase sympathetic activity
- The active skeletal muscles also compress the veins, pumping blood toward the heart (venous pump or muscle pump)
- Respiratory movements at the same time create intermittent negative pressure in the chest, helping to pull blood into the thorax and heart - respiratory pump
These combined effects can increase cardiac output by 4 to 7 times during strenuous exercise. Blood pressure increases moderately (mean arterial pressure rises to about 120-150 mmHg), but the increase in cardiac output is the dominant response.
RESPIRATORY WAVES IN THE ARTERIAL PRESSURE
The arterial pressure rises and falls with each respiratory cycle. This is because:
- Inspiration creates negative intrathoracic pressure → increases venous return to the right heart momentarily → increases pulmonary blood flow → a few seconds later increases left ventricular output → raises arterial pressure
- The respiratory muscles also activate the vasomotor center (via respiratory centers in the brainstem), causing mild cyclic sympathetic discharge
This results in respiratory pressure waves - typically 4 to 6 mm Hg amplitude at normal breathing rates.
Arterial Pressure Vasomotor Waves - Oscillation of Pressure Reflex Control Systems (Mayer Waves)
Often while recording arterial pressure, in addition to the small pressure waves caused by respiration, some much larger waves are also noted - as high as 10 to 40 mm Hg - that rise and fall more slowly than the respiratory waves. The duration of each cycle varies from:
- 26 seconds in the anesthetized dog
- 7 to 10 seconds in the unanesthetized human
These waves are called vasomotor waves or Mayer waves. They are illustrated in Fig. 18.11.
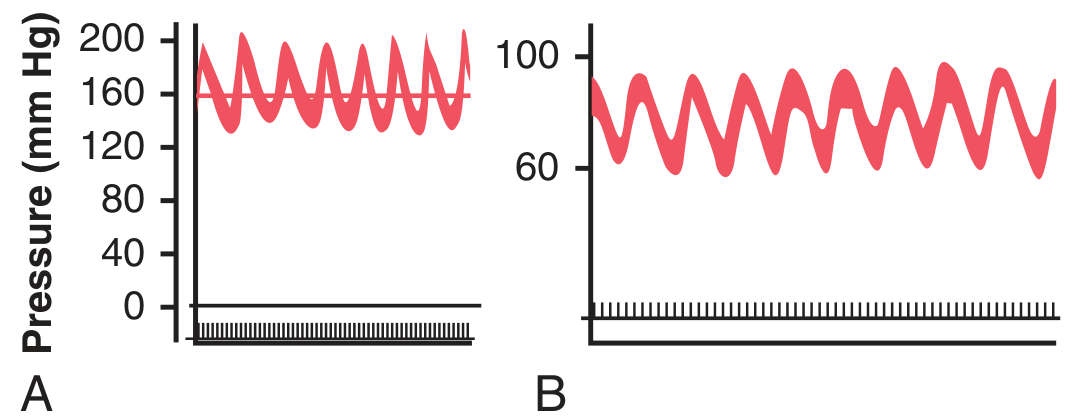
Figure 18.11 - (A) Vasomotor waves caused by oscillation of the CNS ischemic response - the pressure oscillates between ~150-200 mmHg. (B) Vasomotor waves caused by baroreceptor reflex oscillation - pressure oscillates between ~60-100 mmHg.
Vasomotor waves are coupled with oscillations of sympathetic nervous activity and are enhanced during states of sympathetic activation. The cause of vasomotor waves is reflex oscillation of one or more nervous pressure control mechanisms:
Oscillation of Baroreceptor and Chemoreceptor Reflexes
The vasomotor waves of Fig. 18.11B are caused mainly by oscillation of the baroreceptor reflex:
- High pressure excites baroreceptors → inhibits sympathetic nervous system → lowers pressure a few seconds later
- Decreased pressure reduces baroreceptor stimulation → vasomotor center becomes active again → elevates pressure to a high value
- This cycle repeats
The chemoreceptor reflex can also oscillate simultaneously with the baroreceptor reflex. It plays the major role in causing vasomotor waves when arterial pressure is in the range of 40 to 80 mm Hg, because in this low range, chemoreceptor control of the circulation becomes powerful, whereas baroreceptor control weakens.
Oscillation of the CNS Ischemic Response
The record in Fig. 18.11A resulted from oscillation of the CNS ischemic pressure control mechanism. In this experiment, the cerebrospinal fluid pressure increased to 160 mm Hg, which compressed cerebral vessels and initiated a CNS ischemic pressure response up to 200 mm Hg. When arterial pressure rose to such a high value:
- Brain ischemia was relieved
- Sympathetic nervous system became inactive
- Arterial pressure fell rapidly back to a much lower value
- Brain ischemia recurred → another rise in pressure
- This repeated cyclically as long as CSF pressure remained elevated
General Principle of Vasomotor Wave Formation
Any reflex pressure control mechanism can oscillate if:
- The intensity of feedback is strong enough, and
- There is a delay between excitation of the pressure receptor and the subsequent pressure response
The vasomotor waves illustrate that the nervous reflexes that control arterial pressure obey the same principles as those applicable to mechanical and electrical control systems. For example, if the feedback gain is too great in the guiding mechanism of an automatic pilot for an airplane, and there is also delay in the response time of the guiding mechanism, the plane will oscillate from side to side instead of following a straight course.
Summary - Chapter 18 Key Concepts
Chapter 18 Overview Diagram:┌─────────────────────────────────────────────────────────────────────┐ │ NERVOUS REGULATION OF CIRCULATION (Ch. 18) │ ├──────────────────────────────┬──────────────────────────────────────┤ │ SYMPATHETIC SYSTEM │ PARASYMPATHETIC SYSTEM │ │ (dominant) │ (mainly heart) │ ├──────────────────────────────┼──────────────────────────────────────┤ │ Vasomotor center (medulla) │ Vagus nerve → Heart │ │ 1. Vasoconstrictor area │ → ↓ HR, ↓ contractility │ │ 2. Vasodilator area │ │ │ 3. Sensory area (NTS) │ │ │ Neurotransmitter: NE │ │ │ Targets: arteries, arterioles,│ │ │ veins, heart │ │ ├──────────────────────────────┴──────────────────────────────────────┤ │ REFLEX MECHANISMS │ ├────────────────┬───────────────────┬────────────────────────────────┤ │ BARORECEPTORS │ CHEMORECEPTORS │ LOW-PRESSURE RECEPTORS │ │ Carotid sinus │ Carotid + aortic │ Atria + pulmonary vessels │ │ Aortic arch │ bodies │ │ │ Hering's n. │ Activated by: │ Respond to volume, not │ │ → CN IX → NTS │ ↓ O₂, ↑ CO₂, │ pressure │ │ Vagus → NTS │ ↑ H⁺ │ Bainbridge reflex │ │ Fastest BP │ Important below │ ADH, aldosterone control │ │ regulator │ 80 mmHg │ │ ├────────────────┴───────────────────┴────────────────────────────────┤ │ CNS ISCHEMIC RESPONSE │ │ Most powerful sympathetic activator │ │ Activated when BP < 60 mmHg (strongest at 15-20 mmHg) │ │ Can raise BP to 250 mmHg - LAST RESORT emergency mechanism │ │ Cushing reaction: ↑ CSF pressure → brain ischemia → ↑ BP │ ├─────────────────────────────────────────────────────────────────────┤ │ VASOMOTOR (MAYER) WAVES │ │ 7-10 sec cycles; 10-40 mmHg amplitude │ │ Caused by oscillation of baroreceptor, chemoreceptor, or │ │ CNS ischemic reflex feedback loops │ └─────────────────────────────────────────────────────────────────────┘
| Mechanism | Speed | Strength | Key Feature |
|---|---|---|---|
| Baroreceptor reflex | Seconds | Moderate | Most sensitive at 100 mmHg; resets in 1-2 days |
| Chemoreceptor reflex | Seconds | Moderate | Dominant when BP < 80 mmHg |
| CNS ischemic response | Seconds | Extreme | Last-resort; BP < 60 mmHg; raises BP to 250 mmHg |
| Atrial/cardiopulmonary reflexes | Minutes | Mild-moderate | Volume control; Bainbridge reflex; ADH/aldosterone |
| Sympathetic vasoconstrictor tone | Continuous | Moderate | Maintains vasomotor tone at rest |
Source: Guyton and Hall Textbook of Medical Physiology, 14th Edition, Chapter 18 - "Nervous Regulation of the Circulation and Rapid Control of Arterial Pressure," pp. 222-232
ch 19
Finding Sources
Finding Sources
Finding Sources
Reading File
Reading File
Reading File
Reading File
Reading File
Reading File
Reading File
Reading File
Loading Image
Loading Image
Reading File
I now have all the essential content for Chapter 19. Let me compile the complete chapter.
Chapter 19: Role of the Kidneys in Long-Term Control of Arterial Pressure and in Hypertension — The Integrated System for Arterial Pressure Regulation
Guyton and Hall Textbook of Medical Physiology, 14th Edition
In addition to the rapidly acting mechanisms for regulation of arterial pressure discussed in Chapter 18, the body also has powerful mechanisms for regulating arterial pressure week after week and month after month. This long-term control of arterial pressure is closely intertwined with body fluid volume homeostasis, which is determined by the balance between fluid intake and output. Multiple nervous and hormonal controls and local kidney control systems regulate excretion of salt and water. This chapter discusses the major role of these renal-body fluid systems in long-term blood pressure regulation.
RENAL-BODY FLUID SYSTEM FOR ARTERIAL PRESSURE CONTROL
The renal-body fluid system for arterial pressure control acts slowly but powerfully:
- If blood volume increases (and vascular capacitance is not altered), arterial pressure rises
- The rising pressure causes the kidneys to excrete the excess volume
- This returns pressure back toward normal
Evolutionary Perspective - the Hagfish Model
In the phylogenetic history of animal development, this renal-body fluid system is a primitive one. It is fully operative in one of the lowest vertebrates - the hagfish. This animal has a low arterial pressure of only 8 to 14 mm Hg, and this pressure increases almost directly in proportion to its blood volume. The hagfish continually drinks sea water → absorbed into blood → increases blood volume and blood pressure. When pressure rises too high, the kidney excretes excess volume into urine and relieves the pressure.
Although this primitive mechanism has survived throughout the ages, multiple nervous control systems, hormones, and local control systems have been added in higher vertebrates for regulation of salt and water excretion.
Pressure Diuresis and Pressure Natriuresis
In humans, an increase in arterial pressure of only a few mm Hg can:
- Double the renal output of water - called pressure diuresis
- Double the output of salt - called pressure natriuresis
These phenomena are the fundamental basis of the renal-body fluid pressure control system.
QUANTITATION OF PRESSURE DIURESIS AS A BASIS FOR ARTERIAL PRESSURE CONTROL
Fig. 19.1 shows the approximate average effect of different arterial pressure levels on the renal output of salt (pressure natriuresis) and water (pressure diuresis) by an isolated kidney - called the renal urinary output curve or renal function curve:
- At 50 mm Hg: urine output is nearly zero
- At 100 mm Hg: urine output is normal
- At 200 mm Hg: urine output is 4 to 6 times normal
Figure 19.1 (schematic - Renal Function Curve / Pressure Diuresis):Urine output (× normal) 6 | / | / 4 | / | / ← Steep in normal range 2 | / | / 1 |_____________ X ← Normal operating point (100 mmHg) | / 0 |__________/________________________________ 0 50 75 100 125 150 175 200 Arterial pressure (mm Hg)The renal function curve (pressure diuresis curve): urine output increases steeply with rising arterial pressure. At 100 mmHg, urine output equals intake (equilibrium). If intake > output, BP rises until a new equilibrium is reached.
The Equilibrium Point Concept
The critical concept is the equilibrium point where:
- Fluid intake = Renal fluid output
- This equilibrium point determines the long-term arterial pressure
If fluid intake is fixed, the long-term arterial pressure will settle at exactly the level at which the renal output curve crosses the intake line. If the renal function curve is shifted to the right (kidneys are less efficient at excreting sodium), the equilibrium point shifts to a higher pressure - producing chronic hypertension.
Figure 19.2 (schematic - Experimental Demonstration):Arterial pressure Cardiac output (mm Hg) (L/min) 200 | /\ blood infused 10 | /\ | / \ |/ \ 100 |/ \________ 5 | \______ | | 0 |_____________ 0 |_____________ 0 30min 60min 0 30min 60min Time Time (Infusion of 400mL blood raised BP to 205mmHg → kidneys excreted excess fluid over ~1 hour → BP returned to normal by fluid output)In dogs with all nervous reflexes blocked, infusion of 400 mL blood elevated mean arterial pressure to 205 mmHg and cardiac output to double normal. Within about 1 hour of diuresis, both returned to near-normal, demonstrating the power of the renal-body fluid system.
Failure of Increased Total Peripheral Resistance to Elevate Long-Term Arterial Pressure If Fluid Intake and Renal Function Do Not Change
Recalling the basic equation:
Arterial Pressure = Cardiac Output × Total Peripheral Resistance
When total peripheral resistance is acutely increased, arterial pressure rises immediately. Yet, if renal vascular resistance and the kidney output curve are unchanged, the acute rise in arterial pressure usually is not maintained. Instead, the arterial pressure returns all the way to normal within a few days.
Why? Because increasing vascular resistance everywhere except in the kidneys does not alter the equilibrium point of the renal function curve. The slight increase in pressure caused by the increased total peripheral resistance causes the kidneys to excrete extra fluid. This fluid loss reduces blood volume, venous return, and cardiac output until the pressure returns to the equilibrium point.
Key insight: In the long term, it is the kidney function - not peripheral resistance - that determines mean arterial pressure.
However, if the vascular resistance changes occur within the kidneys (renal arteriolar constriction), the renal function curve is shifted to the right (higher pressures needed to excrete the same amount of sodium), and hypertension does develop.
Figure 19.5 (schematic):Clinical condition | TPR | Cardiac Output | Arterial Pressure ---------------------|------------|----------------|------------------ Normal | Normal | Normal | 100 mmHg A-V fistula | ↓ (low) | ↑ (high) | 100 mmHg (same!) Polycythemia vera | ↑ (high) | ↓ (low) | 100 mmHg (same!) Anemia | ↓ (low) | ↑ (high) | 100 mmHg (same!)When kidneys function normally, changing total peripheral resistance causes equal and opposite changes in cardiac output but has NO long-term effect on arterial pressure. (Modified from Guyton AC, 1980)
Increased Fluid Volume Can Elevate Arterial Pressure By Increasing Cardiac Output or Total Peripheral Resistance
The overall mechanism whereby increased extracellular fluid volume may elevate arterial pressure is shown in Fig. 19.6. The sequential events are:
- Increased extracellular fluid volume
- → Increases blood volume
- → Increases mean circulatory filling pressure
- → Increases venous return of blood to the heart
- → Increases cardiac output
- → Increases arterial pressure
The increased arterial pressure, in turn, increases renal excretion of salt and water and may return extracellular fluid volume to nearly normal if kidney function is normal.
Figure 19.6 - Sequential steps diagram:↑ ECV (e.g., excess salt/water intake or impaired renal excretion) ↓ ↑ Blood volume ↓ ↑ Mean circulatory filling pressure ↓ ↑ Venous return → ↑ Cardiac output ↓ ↑ Arterial pressure ←──────────────────────┐ ↓ │ DIRECT: ↑ Pressure → ↑ Renal output │ ↓ │ INDIRECT: ↑ Flow → Autoregulation → │ ↑ TPR via vasoconstriction ─────────────────┘ (also: myogenic vasoconstriction)
Two mechanisms by which increased cardiac output raises arterial pressure:
- Direct effect - increased cardiac output directly raises pressure
- Indirect effect - increased blood flow through tissues triggers autoregulatory vasoconstriction (discussed in Ch. 17), raising total peripheral resistance. This secondary rise in resistance helps further increase arterial pressure.
Only a 5% to 10% increase in cardiac output can increase arterial pressure from 100 mm Hg up to 150 mm Hg because of this autoregulatory amplification.
Importance of Salt (NaCl) in the Renal-Body Fluid Mechanism
The amount of salt (NaCl) in the body is actually the primary determinant of blood volume and long-term arterial pressure - more so than the total amount of water. The reason is that sodium retains water in the extracellular fluid (due to osmotic effects). Therefore:
- Increased salt intake → increased extracellular osmolarity → thirst and increased water intake → expanded blood volume → elevated arterial pressure (if kidneys cannot compensate)
Salt Sensitivity of Blood Pressure
The degree to which blood pressure rises in response to increased salt intake is called salt sensitivity. Not all people respond the same way. Factors associated with increased salt sensitivity are listed in Table 19.1.
Table 19.1 - Some Factors Associated With Salt-Sensitivity of Blood Pressure
| Category | Specific Factors |
|---|---|
| Loss of Functional Kidney Nephrons | Old age; Surgical removal of kidney mass; Kidney diseases; Obesity and diabetes mellitus; Chronic hypertension |
| Renin-Angiotensin-Aldosterone System Abnormalities | Excessive angiotensin II formation (e.g., renin-secreting tumor); Excessive aldosterone secretion (e.g., primary aldosteronism); "Nonmodulators" (low, normal, or high renin) |
| Genetic Causes of Increased Distal/Collecting Tubule Renal Sodium Reabsorption | Liddle syndrome (excessive Na⁺ channel activity - ENaC mutations); Gordon syndrome (excessive NaCl co-transporter activity); Glucocorticoid-remediable aldosteronism; Congenital adrenal hyperplasia; Apparent mineralocorticoid excess |
| Administration of RAAS Blockers | Angiotensin II receptor blockers (ARBs); ACE inhibitors; Mineralocorticoid receptor antagonists |
Abnormalities of the renin-angiotensin-aldosterone (RAAS) system that prevent adequate suppression of angiotensin II or aldosterone when sodium intake is increased greatly increase salt sensitivity. Drugs that block the RAAS also greatly increase salt sensitivity - so reductions in salt intake cause much greater reductions in blood pressure in hypertensive patients on RAAS blockers.
Long-term high salt intake may also directly damage the kidneys, eventually making blood pressure more salt-sensitive.
CHRONIC HYPERTENSION (HIGH BLOOD PRESSURE) CAUSED BY IMPAIRED RENAL FUNCTION
When people have chronic hypertension, their arterial pressure is greater than the upper range of accepted normal pressure:
- Normal: systolic < 120 mmHg, diastolic < 80 mmHg (mean ≈ 90 mmHg)
- Stage 1 hypertension: systolic 130-139 mmHg or diastolic 80-89 mmHg
- Severe hypertension: mean arterial pressure 150-170 mmHg; diastolic up to 130 mmHg; systolic occasionally up to 250 mmHg
Even moderate elevation of arterial pressure leads to shortened life expectancy. At severely high pressures (mean BP 50% or more above normal), a person can expect to live no more than a few more years unless treated. The lethal effects of hypertension occur mainly through three mechanisms:
- Excess workload on the heart → coronary heart disease, early heart failure, pulmonary edema, or heart attack
- Damage to a major blood vessel in the brain → cerebral infarct (stroke/brain attack) → fatal or causes paralysis, dementia, blindness, other brain disorders
- Injury to the kidneys → renal destruction → kidney failure → uremia and death
Experimental Volume-Loading Hypertension
Fig. 19.7 shows volume-loading hypertension in dogs with 70% of kidney mass removed. Key findings:
- Removing kidney mass (leaving only 30% of normal) raised arterial pressure by only 6 mm Hg
- When given salt solution to drink, dogs drank 2-4 times normal volume → within a few days, average arterial pressure rose to about 40 mm Hg above normal
- When given tap water again → pressure returned to normal within 2 days
- Returning salt solution again → pressure rose rapidly again
Why? Reduction of kidney mass to 30% greatly reduced the ability of the kidneys to excrete salt and water → salt and water accumulated → in a few days, arterial pressure rose high enough to excrete the excess salt and water intake.
Sequential Changes in Circulatory Function During Volume-Loading Hypertension
The sequence:
- Increased fluid volume and blood volume
- Initially → increased cardiac output (dominant early change)
- Over time → local autoregulation causes vasoconstriction in tissues receiving excess flow
- Total peripheral resistance rises secondarily
- Cardiac output returns toward normal as blood pressure rises
- The long-term result: elevated arterial pressure with increased total peripheral resistance and near-normal cardiac output
Hypertension Caused By Excess Aldosterone
Another type of hypertension from reduced ability of the kidneys to excrete sodium is caused by excess aldosterone secretion - for example, a small tumor in one of the adrenal glands secreting large quantities of aldosterone - called primary aldosteronism. Aldosterone increases the rate of salt and water reabsorption by kidney tubules, thereby increasing:
- Blood volume
- Extracellular fluid volume
- Arterial pressure
If salt intake is increased at the same time, the hypertension becomes even greater. If the condition persists for months or years, the hypertension often causes pathological changes in the kidneys that make them retain even more salt and water. The hypertension can therefore eventually become lethal.
- Early stage: cardiac output often increased
- Later stage: cardiac output returns to nearly normal, total peripheral resistance becomes secondarily elevated
ROLE OF THE RENIN-ANGIOTENSIN SYSTEM IN ARTERIAL PRESSURE CONTROL
Aside from the capability of the kidneys to control arterial pressure through changes in extracellular fluid volume, the kidneys also have another powerful mechanism - the renin-angiotensin system (RAS). Renin is a protein enzyme released by the kidneys when arterial pressure falls too low or when salt intake is reduced. It raises arterial pressure in several ways.
COMPONENTS OF THE RENIN-ANGIOTENSIN SYSTEM
Fig. 19.9 shows the main functional steps of the renin-angiotensin system:
Figure 19.9 - Renin-Angiotensin-Aldosterone System Pathway:↓ Arterial pressure OR ↓ Salt (NaCl) delivery to macula densa OR ↑ Sympathetic activity (β-receptor stimulation) │ ▼ JUXTAGLOMERULAR (JG) CELLS of afferent arterioles │ Secrete RENIN into blood ▼ Angiotensinogen (α-2 globulin from liver) │ + Renin (enzyme) ▼ Angiotensin I (10-amino acid peptide - inactive) │ + ACE (Angiotensin Converting Enzyme) │ from lungs (and other tissues) ▼ Angiotensin II (8-amino acid peptide - ACTIVE) │ ├──→ Vasoconstriction (arterioles) → ↑ BP │ ├──→ Direct renal tubular effects: │ ↑ Na⁺ and water reabsorption │ ↓ GFR via efferent arteriolar constriction │ └──→ Stimulates Adrenal Cortex → ↑ ALDOSTERONE → ↑ Na⁺ and water reabsorption → ↑ Blood volume → ↑ Arterial pressure
Stimuli for Renin Secretion (3 Main Mechanisms)
- Pressure-sensitive baroreceptors in JG cells respond to decreased arterial pressure with increased renin release
- Decreased NaCl delivery to macula densa cells in the early distal tubule stimulates renin release
- Increased sympathetic nervous system activity stimulates renin release via beta-adrenergic receptors in JG cells; also activates alpha-adrenergic receptors to increase renal Na⁺Cl⁻ reabsorption and reduce GFR during strong sympathetic activation; also enhances sensitivity of renal baroreceptor and macula densa mechanisms
Important: Renin itself is an enzyme, not a vasoactive substance. It acts on angiotensinogen (renin substrate - a globulin produced by the liver) to release angiotensin I (10-amino acid peptide). Angiotensin I is then converted to angiotensin II (8-amino acid peptide) by angiotensin-converting enzyme (ACE), present mainly in small vessels of the lungs.
Angiotensin II is Rapidly Inactivated
Angiotensin II has a plasma half-life of only 1 to 2 minutes because it is rapidly inactivated by various blood and tissue enzymes (collectively called angiotensinases). Therefore, it acts as a hormone with rapid and short-lived effects.
Rapidity and Intensity of the Vasoconstrictor Pressure Response to the Renin-Angiotensin System
Fig. 19.10 shows the experiment demonstrating the pressure-compensating effect of the renin-angiotensin system after severe hemorrhage:
- Hemorrhage → acute decrease of arterial pressure to 50 mm Hg
- With renin-angiotensin system functioning: pressure rose back to 83 mm Hg
- With renin-angiotensin system blocked (renin-blocking antibody): pressure rose to only 60 mm Hg
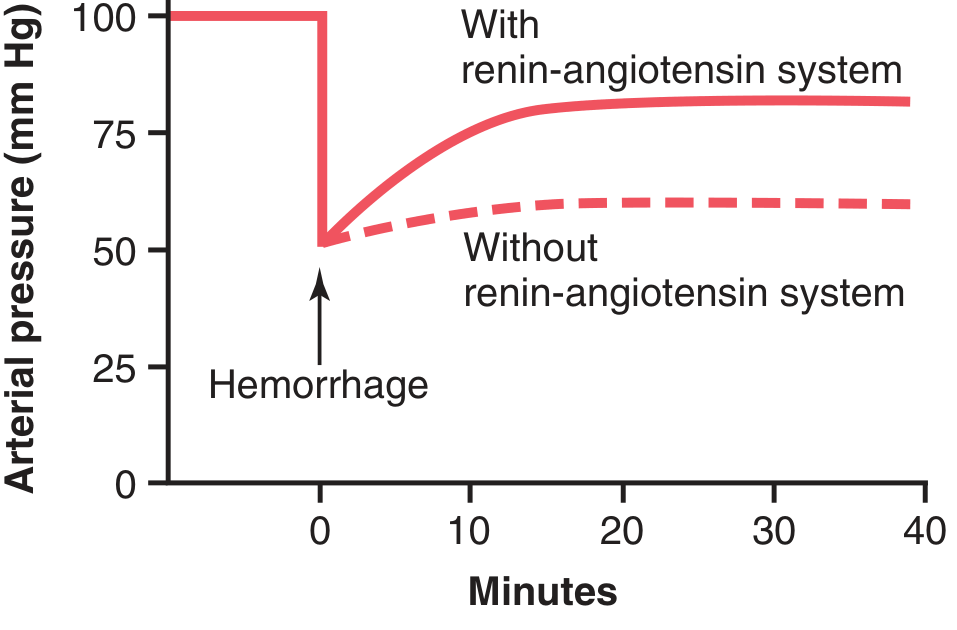
Figure 19.10 - The pressure-compensating effect of the renin-angiotensin vasoconstrictor system after severe hemorrhage. With the system functioning (solid), pressure recovers to 83 mmHg. Without the system (dashed), pressure only recovers to 60 mmHg. (Drawn from experiments by Dr. Royce Brough.)
The renin-angiotensin system demonstrates:
- Powerful enough to return arterial pressure at least halfway back to normal within a few minutes after severe hemorrhage - potentially lifesaving
- Requires about 20 minutes to become fully active (slower than nervous reflexes and sympathetic NE/epinephrine system)
Angiotensin II-Mediated Renal Salt and Water Retention Is an Important Mechanism for Long-Term Control
Angiotensin II causes the kidneys to retain both salt and water in two major ways:
-
Direct renal tubular effect: acts directly on the kidneys to increase tubular reabsorption of salt and water. Specifically:
- Constricts renal arterioles (especially efferent arterioles) → decreases blood flow through kidneys → reduces peritubular capillary pressure → increases reabsorption of fluid from tubules
- Direct actions on tubular cells to increase tubular reabsorption of Na⁺ and water
- Combined effects can decrease urine output to less than one-fifth of normal
-
Aldosterone-mediated effect: Angiotensin II is one of the most powerful stimulators of aldosterone secretion by the adrenal glands. Aldosterone acts on distal tubules and collecting ducts to increase Na⁺ reabsorption, which also increases water retention.
When renin secretion and angiotensin II formation are increased (e.g., due to hemorrhage or salt/water depletion), the salt and water retaining actions act slowly but powerfully to return arterial pressure toward normal.
Role of the Renin-Angiotensin System in Maintaining Normal Arterial Pressure
The renin-angiotensin-aldosterone system helps buffer arterial pressure against changes in salt intake:
- High salt intake → expanded blood volume → increased arterial pressure → suppression of renin → decreased angiotensin II and aldosterone → kidneys excrete more sodium → blood pressure returns toward normal
- Low salt intake → reduced blood volume → decreased arterial pressure → increased renin → increased angiotensin II and aldosterone → kidneys retain more sodium → blood pressure rises back toward normal
This buffering effect means that people can eat vastly different amounts of salt with relatively small changes in arterial pressure as long as the RAAS is functioning normally.
HYPERTENSION CAUSED BY RENIN-ANGIOTENSIN SYSTEM ABNORMALITIES
One-Kidney Goldblatt Hypertension
If a constricting clamp is placed on the renal artery of one kidney after the other kidney has been removed, the following sequence occurs:
One-Kidney Goldblatt Hypertension Sequence:Clamp on renal artery (after contralateral kidney removed) ↓ ↓ Pressure in kidney's afferent arterioles ↓ ↑ Renin secretion by JG cells ↓ ↑ Angiotensin II formation ↓ ├──→ Vasoconstriction → ↑ Arterial pressure (acute rise) └──→ Salt and water retention → ↑ Blood volume → ↑ Arterial pressure ↓ Arterial pressure rises until blood flow through the ischemic kidney returns toward normal (pressure beyond clamp normalized) ↓ Renin secretion decreases back toward normal ↓ Chronic hypertension maintained by volume loading (NOT primarily by angiotensin II in chronic phase)
The chronic hypertension in one-kidney Goldblatt is maintained mainly by volume loading (salt and water retention), not by persistent high renin levels.
Fig. 19.14 demonstrates the time course: renal artery pressure distal to the clamp falls immediately at clamping, renin secretion spikes, systemic arterial pressure rises, and as pressure normalizes in the kidney, renin secretion falls back toward normal. The pressure stays elevated due to volume retention.
Two-Kidney Goldblatt Hypertension
Hypertension also results when the artery to only one kidney is constricted while the artery to the other kidney is normal:
- The constricted kidney secretes renin AND retains salt/water (due to decreased renal arterial pressure)
- The "normal" opposite kidney retains salt and water because of angiotensin II and aldosterone produced by the ischemic kidney's renin
- Both kidneys become salt and water retainers for different reasons → hypertension develops
The clinical counterpart occurs when there is stenosis of a single renal artery (e.g., from atherosclerosis) in a person with two kidneys.
Hypertension From Diseased Kidneys That Secrete Renin Chronically
When patchy areas of one or both kidneys are diseased and become ischemic (due to local vascular constrictions or infarctions), while other areas are normal, almost identical effects occur as in two-kidney Goldblatt hypertension. One of the most common causes of renal hypertension, especially in older persons, is this patchy ischemic kidney disease.
Other Types of Hypertension Caused By Combinations of Volume Loading and Vasoconstriction
Coarctation of the Aorta
About 1 in every 3000 to 4000 babies is born with pathological constriction or blockage of the aorta at a point above the renal arteries (coarctation). Results:
- Blood flow to the lower body is carried by multiple small collateral arteries → high vascular resistance between upper and lower aorta
- Arterial pressure in the upper part of the body may be 40% to 50% higher than in the lower body
The mechanism is almost identical to one-kidney Goldblatt hypertension:
- Constrictor on aorta above renal arteries → blood pressure in both kidneys falls initially → renin secreted → angiotensin and aldosterone formed → hypertension in upper body
- Arterial pressure in the lower body (at kidney level) rises approximately to normal → kidneys are no longer ischemic → renin and angiotensin return to nearly normal
- Upper body: persistently elevated arterial pressure
Role of Autoregulation in Aortic Coarctation Hypertension
A significant feature: blood flow in the arms (where pressure is 40-60% above normal) is almost exactly normal, and blood flow in the legs (where pressure is not elevated) is also almost exactly normal. This is because autoregulation of blood flow in both upper and lower body tissues adjusts their vascular resistance in proportion to the respective pressures. In the upper body, increased vascular resistance (due to autoregulation against excess pressure) maintains normal blood flow at the high pressure. In the lower body, normal vascular resistance maintains normal blood flow at normal pressure.
PRIMARY (ESSENTIAL) HYPERTENSION
About 90% to 95% of all people with hypertension have primary hypertension (also called essential hypertension). These terms mean that the hypertension is of unknown origin, in contrast to secondary hypertension (known causes such as renal artery stenosis or monogenic forms).
In most patients with primary hypertension, excess weight gain and a sedentary lifestyle appear to play a major role in elevating blood pressure. Excess adiposity may account for as much as 65% to 75% of the risk for developing primary hypertension.
Characteristics of Primary Hypertension Caused by Excess Weight Gain and Obesity
-
↑ Cardiac output - in part because of additional blood flow required for extra adipose tissue; also blood flow in heart, kidneys, GI tract, and skeletal muscle increases with weight gain due to increased metabolic rate. As hypertension is sustained for months/years, total peripheral vascular resistance may become increased.
-
↑ Sympathetic nerve activity (especially in kidneys) in overweight and obese patients. Causes:
- Hormones such as leptin released from fat cells may directly stimulate hypothalamic regions, which have excitatory influence on vasomotor centers of brain medulla
- Reduced sensitivity of arterial baroreceptors for buffering increases in arterial pressure
- Activation of chemoreceptors (especially in those who also have obstructive sleep apnea)
-
↑ Angiotensin II and aldosterone levels in many obese patients - caused partly by increased sympathetic nerve stimulation → increased renal renin release → increased angiotensin II → stimulates adrenal gland to secrete aldosterone.
-
Renal-pressure natriuresis mechanism is impaired - the kidneys will not excrete adequate amounts of salt and water unless the arterial pressure is high or kidney function is otherwise improved. If mean arterial pressure is 150 mm Hg, acute reduction to 100 mm Hg (without otherwise altering renal function) will cause almost-total anuria - the person retains salt and water until pressure rises back to 150 mm Hg.
Causes of impaired renal pressure natriuresis in obesity hypertension:
- Increased renal tubular reabsorption of salt and water due to increased sympathetic nerve activity
- Increased levels of angiotensin II and aldosterone
- Physical compression of the kidneys by excessive adipose tissue surrounding them or invading the renal sinuses
- If hypertension is not treated effectively, vascular damage in kidneys → reduced GFR → worsening hypertension
- Eventually: severe vascular injury → loss of kidney function
Graphic Analysis of Primary Hypertension
Fig. 19.15 shows sodium-loading renal function curves for primary hypertension. Key finding: the renal function curve in patients with primary hypertension is shifted to the right (higher arterial pressure required to achieve the same level of sodium excretion compared to normal). This rightward shift means that the equilibrium point (where sodium intake = sodium output) is established at a higher arterial pressure.
Figure 19.15 (schematic - Sodium-Loading Renal Function Curves):Urinary sodium output (mEq/day) 300 | Normal Essential | / hypertension | / / 200 | / / | / / ← Shifted right | / / 100 |______X _________________ X_______ ← Daily sodium intake | / / | / / 0 |_________________________ 80 100 120 140 160 180 200 Mean arterial pressure (mmHg) Normal equilibrium: ~100 mmHg Hypertensive equilibrium: ~150-160 mmHg
SUMMARY OF INTEGRATED MULTIFACETED SYSTEMS FOR ARTERIAL PRESSURE REGULATION
It is clear that arterial pressure is regulated not by a single pressure-controlling system but instead by several interrelated systems, each performing a specific function. Fig. 19.16 shows the approximate immediate (seconds and minutes) and long-term (hours and days) control responses, expressed as feedback gain, of eight arterial pressure control mechanisms.
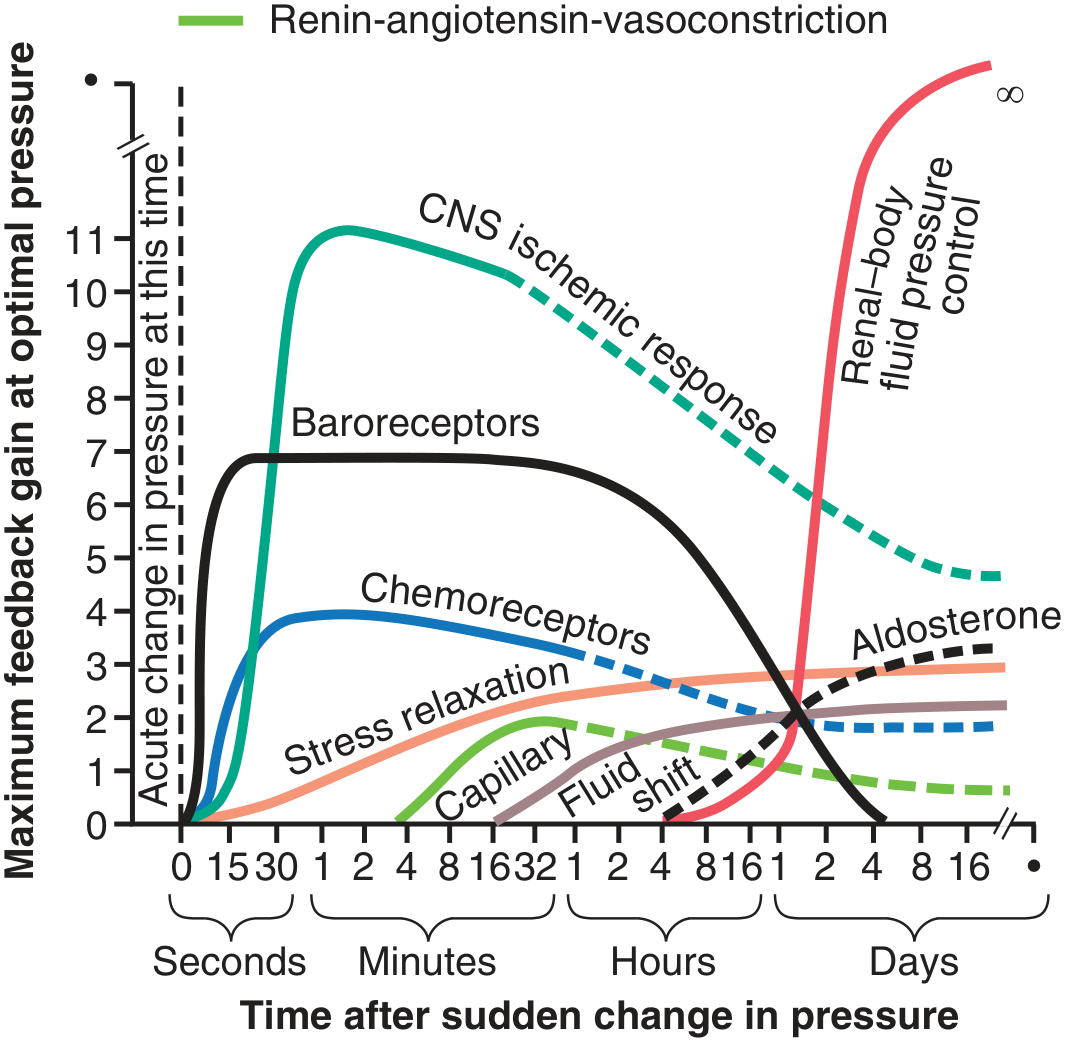
Figure 19.16 - Approximate potency (feedback gain) of various arterial pressure control mechanisms at different time intervals after the onset of a disturbance. Note especially the near-infinite gain (∞) of the renal-body fluid pressure control mechanism after a few weeks. CNS, Central nervous system. (Modified from Guyton AC, 1980)
These mechanisms are divided into three groups:
Group 1 - Mechanisms That Act Rapidly (Within Seconds or Minutes)
Mainly acute nervous reflexes or other autonomic nervous system responses:
- Baroreceptor feedback mechanism - most sensitive at normal arterial pressure
- CNS ischemic mechanism - most powerful; activated when BP < 60 mmHg
- Chemoreceptor mechanism - dominant when BP in 40-80 mmHg range
After any acute fall in pressure (e.g., severe hemorrhage), these three mechanisms combine to cause:
- Constriction of veins → transfer of blood to heart
- Increased heart rate and contractility → greater pumping capability
- Constriction of most peripheral arterioles → All occurring almost instantly to raise arterial pressure back into a survival range
Group 2 - Mechanisms That Act After Many Minutes
Three mechanisms exhibiting significant responses only after a few minutes:
- Renin-angiotensin vasoconstrictor mechanism - semiacute means for increasing arterial pressure (~20 min to full effect)
- Stress relaxation of the vasculature - when pressure in blood vessels becomes too high, the vessels gradually dilate over minutes to hours because of stress relaxation. Conversely, when pressure is too low, the vessels contract. This response is called the reverse stress relaxation or the vascular stress relaxation mechanism.
- Shift of fluid through tissue capillary walls - readjusts blood volume. When blood pressure rises suddenly too high, elevated capillary pressure causes fluid to shift from capillaries into the tissue spaces, reducing blood volume. This helps lower blood pressure back toward normal.
Group 3 - Long-Term Arterial Pressure Regulation
The renal-body fluid pressure control mechanism rises slowly over a period of days but is eventually by far the most powerful of all arterial pressure controllers. As shown in Fig. 19.16, this mechanism has a feedback gain that approaches infinity (∞) - meaning it can theoretically return arterial pressure all the way to exactly the level required to maintain fluid balance (i.e., the equilibrium point of the renal function curve).
Two additional long-term mechanisms:
- Aldosterone control mechanism - supplements the renal-body fluid system by adjusting sodium reabsorption in proportion to circulating angiotensin II levels
- Vascular remodeling - over weeks to months, blood vessels and the heart adapt structurally to sustained changes in pressure
Summary Table - All 8 Arterial Pressure Control Mechanisms:
Mechanism Time of Action Max Feedback Gain Duration Baroreceptor reflex Seconds (15-30 sec) ~7 Diminishes over hours (resets) CNS ischemic response Seconds (15-30 sec) ~11 Emergency only; diminishes Chemoreceptor reflex Seconds (30 sec) ~4 Diminishes over hours Renin-angiotensin vasoconstriction Minutes (20 min) ~3 Sustained for hours Stress relaxation Minutes (hours) ~2 Hours Capillary fluid shift Minutes-hours ~2 Hours Aldosterone-renal mechanism Hours-days ~3 Long-term sustained Renal-body fluid mechanism Days ∞ (infinite) Permanent - most powerful
The renal-body fluid system is the ultimate long-term determinant of arterial pressure. All other mechanisms help in the short run, but the kidneys - through pressure diuresis and natriuresis - ultimately determine the long-term steady-state arterial pressure.
Key Physiological Principle of Chapter 19
"The mean arterial pressure will always stabilize at the level at which the renal output of water and salt exactly equals the intake of water and salt - the equilibrium point of the renal function curve." — A.C. Guyton
If anything shifts the renal function curve to the right (impairs renal pressure natriuresis), the long-term equilibrium pressure rises, and hypertension develops - regardless of what happens to peripheral resistance, cardiac output, or nervous reflexes in the short term.
Source: Guyton and Hall Textbook of Medical Physiology, 14th Edition, Chapter 19 - "Role of the Kidneys in Long-Term Control of Arterial Pressure and in Hypertension: The Integrated System for Arterial Pressure Regulation," pp. 233-250
ch 20 now
Finding Sources
Finding Sources
Reading File
Reading File
Reading File
Reading File
Reading File
Reading File
Loading Image
Loading Image
Loading Image
dont give textbook , i donnt want textbook , i want a detailed oriented notes of that chapter
Reading File
Reading File
Reading File
Reading File
Reading File
Reading File
This is a shared conversation. Sign in to Orris to start your own chat.