
Atrial fibrillation in ecg how to find out
atrial fibrillation ECG rhythm strip
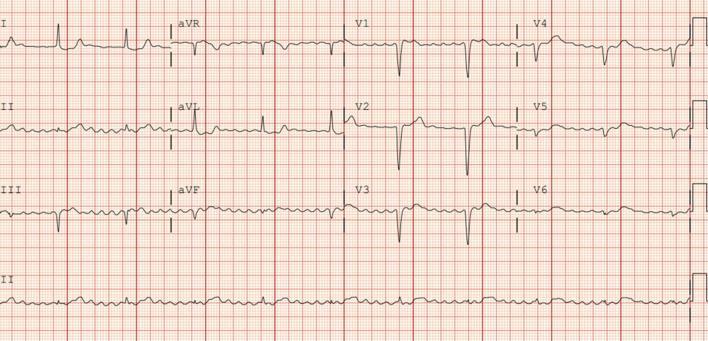
This diagnostic image is a 12-lead electrocardiogram (ECG) featuring leads I, II, III, aVR, aVL, aVF, and V1-V6. The rhythm strips demonstrate a classic presentation of atrial fibrillation characterized by the total absence of discrete P waves and the presence of irregular fibrillatory (f) waves best seen in lead V1 and the rhythm strip of lead II. Notably, there is rate regularization, where the R-R intervals are consistent and regular despite the underlying atrial chaos. This combination of atrial fibrillation with a regular ventricular response is highly suggestive of high-grade or complete atrioventricular (AV) block, indicating that the ventricles are being paced by an independent junctional or ventricular escape rhythm. The QRS complexes appear relatively narrow, suggesting a high junctional escape origin. No significant ST-segment elevations or T-wave inversions are visualized across the precordial or limb leads. This ECG serves as a critical educational example of how a regular rhythm in the setting of atrial fibrillation indicates advanced conduction system disease.
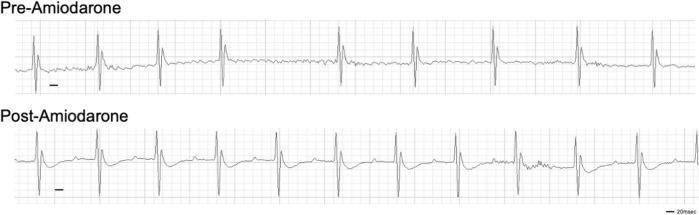
A comparison of two electrocardiogram (ECG) rhythm strips demonstrating pharmacological cardioversion in a murine model. The top strip, labeled 'Pre-Amiodarone,' shows atrial fibrillation (AF) characterized by an irregularly irregular ventricular rhythm, varying R-R intervals, and the absence of distinct P waves. The baseline exhibits fibrillatory activity (f-waves). The bottom strip, labeled 'Post-Amiodarone,' displays a return to sinus rhythm following the administration of the Class III anti-arrhythmic agent. Key features of the post-treatment trace include a regular rhythm with consistent R-R intervals, clearly visible P waves preceding each QRS complex, and well-defined T waves. The ECG grids include a 20 msec scale bar for temporal reference. This visual comparison illustrates the efficacy of amiodarone in converting a tachydysrhythmia back to normal sinus rhythm, serving as a representative example of pharmacological intervention for atrial arrhythmias in translational cardiology research.
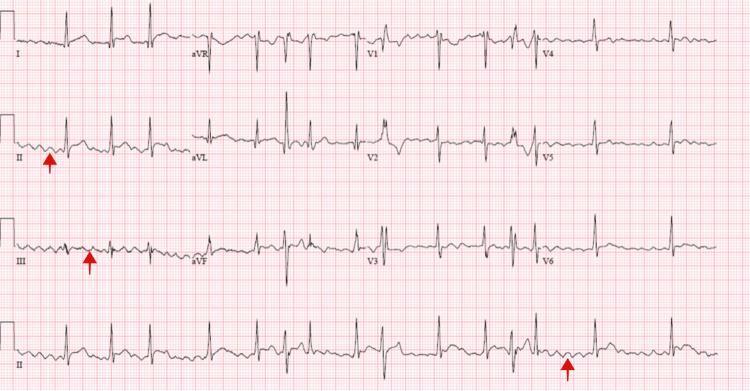
A 12-lead electrocardiogram (ECG) with a rhythm strip at the bottom demonstrating atrial fibrillation and aberrant ventricular conduction. The tracing shows an 'irregularly irregular' rhythm characterized by variable R-R intervals and the absence of organized P waves. Instead, low-amplitude fibrillatory waves are visible along the baseline, specifically highlighted by red arrows in leads II, III, and the continuous rhythm strip. The QRS complexes exhibit polymorphic features, with varying morphologies and widths across different beats, suggesting intermittent intraventricular conduction disturbances or Ashman phenomenon. T-wave morphology is inconsistent, and baseline fluctuations are present. This diagnostic image illustrates the electrical manifestations of atrial arrhythmia commonly associated with clinical scenarios such as hyperthyroidism or cardiac tamponade. The tracing is presented on standard grid paper, facilitating the assessment of heart rate and interval durations for cardiology education and clinical diagnosis.
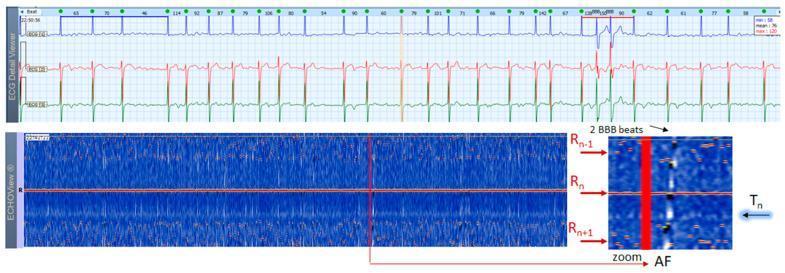
This diagnostic composite image displays a 3-lead Holter ECG strip (top) alongside a corresponding ECHOView color map (bottom), illustrating persistent atrial fibrillation (AF) in an 84-year-old male. The ECG strip shows characteristic rhythm irregularity with fluctuating heart rates between 46 and 150 bpm and prominent 'f' waves (gross AF). Two wide QRS complexes are visible, identified as aberrant ventricular conduction due to the Ashman phenomenon. The ECHOView panel transforms ECG amplitudes into a color-coded format. A central horizontal red line (Rn) represents aligned R-peaks. The irregularity of AF is demonstrated by the scattered, non-linear arrangement of red dots representing the previous (Rn-1) and subsequent (Rn+1) R-wave peaks. Notably, the stable blue-white band typically seen in sinus rhythm (representing P-waves) is absent; it is replaced by randomly distributed white dots corresponding to atrial fibrillatory waves. An inset zoom highlights these features and labels ventricular repolarization (Tn) as a blue-white trace. This visual tool aids in differentiating AF from other tachyarrhythmias like atrial flutter or multifocal atrial tachycardia by emphasizing P-wave absence and RR-interval variability.
How to Identify Atrial Fibrillation on an ECG
1. Absent / No Discernible P Waves
- In normal sinus rhythm, each QRS complex is preceded by a clear P wave.
- In AF, no organized P waves are visible because multiple small areas of the atrial myocardium fire chaotically (atrial rate >600 beats/min).
- Instead of P waves, you see either:
- A flat (isoelectric) baseline, or
- A chaotic, wavy/fibrillatory baseline (called "f waves"), most prominent in lead V1.
2. Irregularly Irregular Ventricular Rhythm
- This is the most recognizable feature. The R-R intervals are completely random - no two consecutive R-R intervals are the same.
- This happens because the chaotic atrial impulses conduct through the AV node unpredictably.
- Tip: If you can find a regular pattern in the R-R intervals, it is probably NOT AF.
3. Narrow QRS Complexes
- The QRS complexes are typically narrow (<120 ms / 3 small squares), meaning ventricular conduction is normal.
- Exception: QRS will be wide if there is a pre-existing bundle branch block or a pre-excitation syndrome (e.g. Wolff-Parkinson-White).
Ventricular Rate in AF
| Condition | Ventricular Rate |
|---|---|
| Untreated AF (normal AV node) | 120-170 beats/min |
| With AV-slowing drugs or disease | Slower (<100 bpm = "slow AF") |
| With accessory/bypass tract | Can exceed 200 beats/min (dangerous!) |
Real ECG Examples - Three Patterns of AF
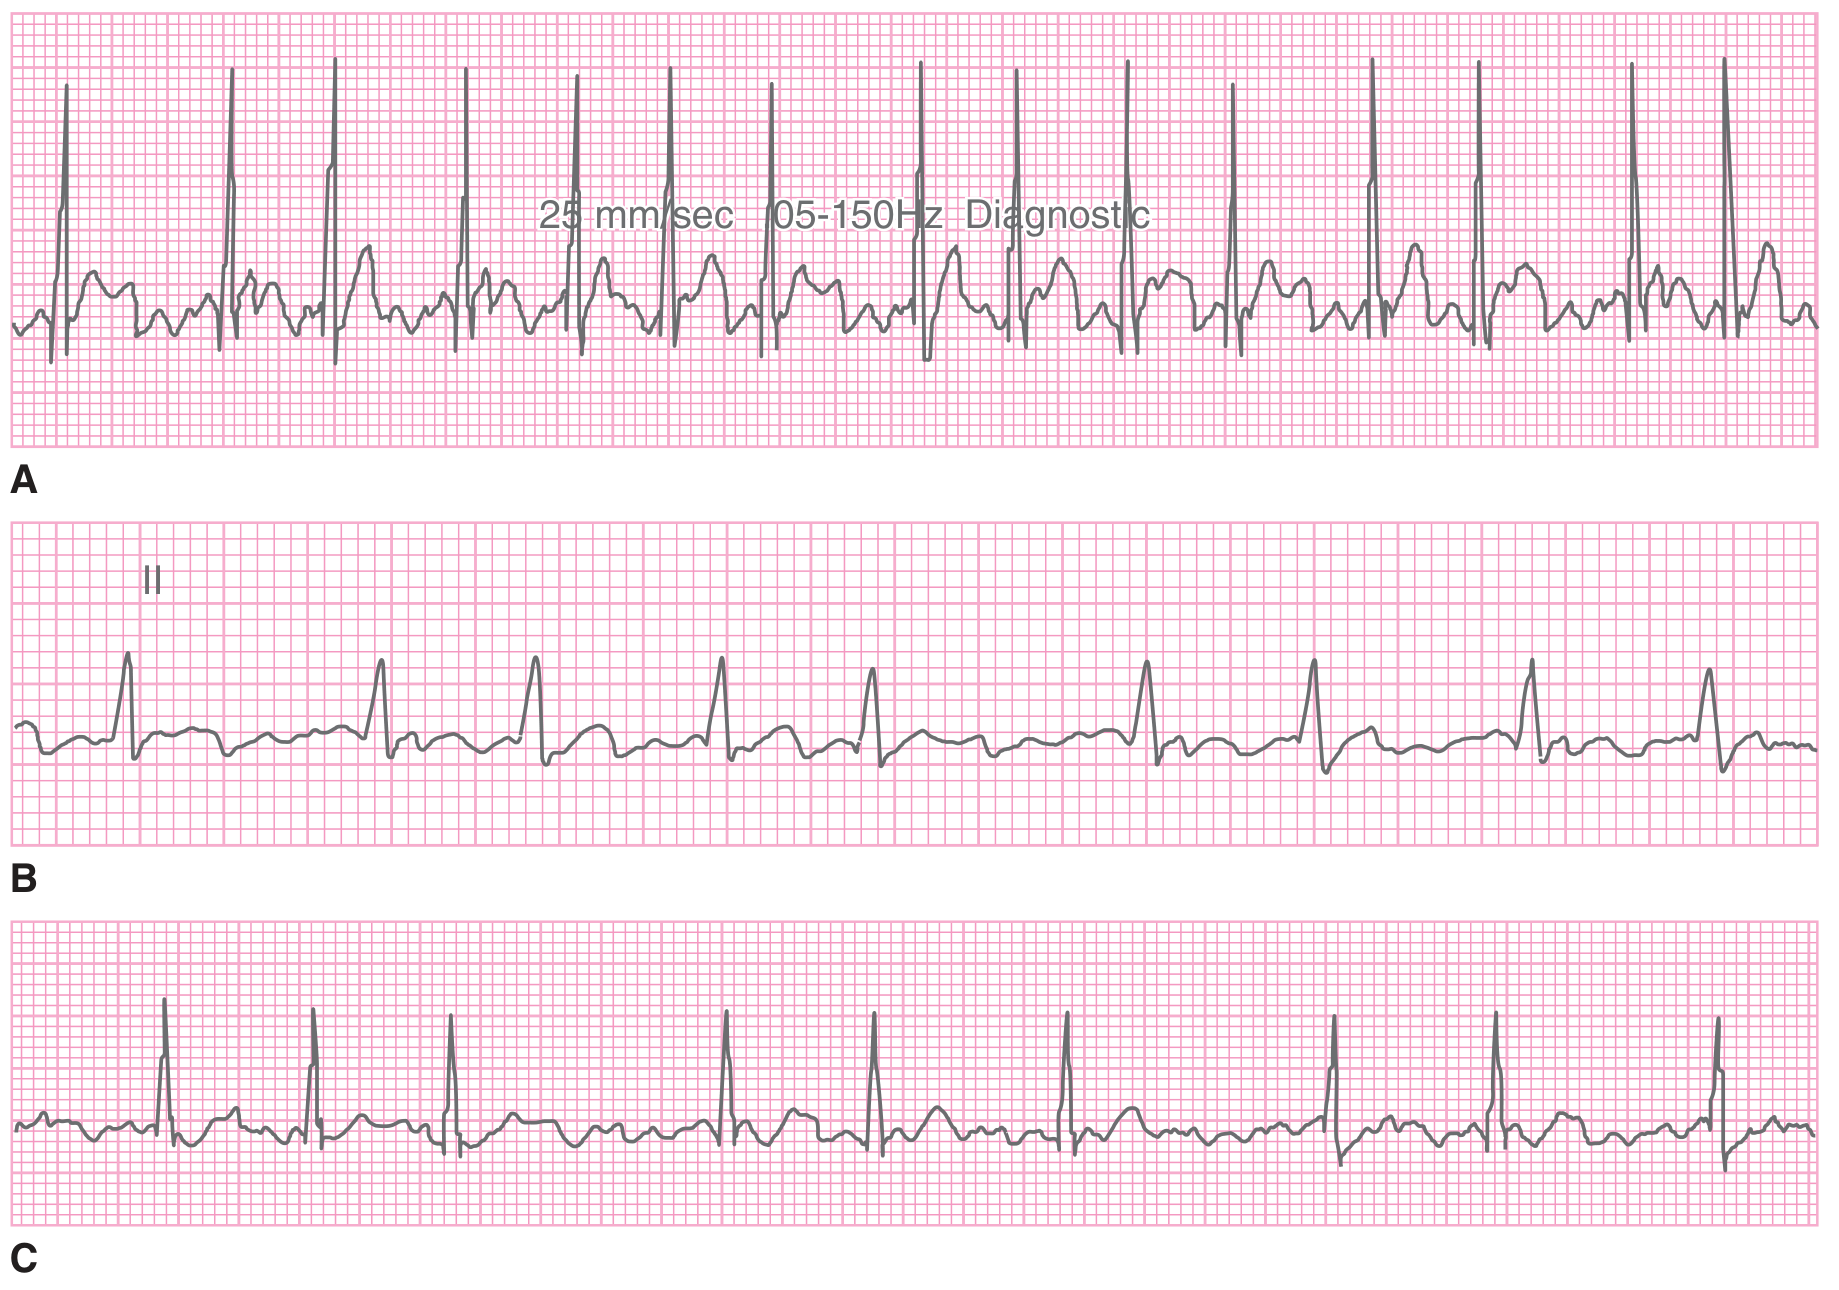
- Strip A (top): Rapid AF with chaotic baseline and fast, irregular QRS complexes
- Strip B (middle, Lead II): Classic AF - note the completely flat baseline between QRS complexes (no P waves) and clearly irregular spacing
- Strip C (bottom): AF with a slower ventricular rate, still showing irregular R-R intervals
12-Lead ECG Example
Quick 3-Step Bedside Check
- Look for P waves - Can you see a clear P wave before every QRS? If no P waves visible → suspicious for AF.
- Check the baseline - Is it flat/chaotic between QRS complexes (no clean isoelectric line)? → supports AF.
- Measure R-R intervals - Are consecutive R-R intervals all different with no repeating pattern? → AF confirmed.
What AF is NOT (Key Differentials)
| Feature | AF | Atrial Flutter | Sinus Tachycardia |
|---|---|---|---|
| P waves | Absent | Sawtooth flutter waves (~300/min) | Present, upright |
| Rhythm | Irregularly irregular | Usually regular | Regular |
| Baseline | Chaotic/flat | Sawtooth pattern | Clean |
| Rate (ventricular) | Variable | ~150 bpm (2:1 block) | Varies |
- Tintinalli's Emergency Medicine: A Comprehensive Study Guide, Table 18-8, p. 148