
Explain limit dextrin biochemistry in simplest language
glycogen structure limit dextrin alpha 1,6 branch points

This molecular diagram depicts the chemical structure of an alpha-glucan, a complex carbohydrate (polysaccharide) isolated from the mushroom Agaricus bisporus. The structure is represented as a polymeric repeating unit enclosed in brackets with a subscript 'n'. The primary chain consists of a series of alpha-D-glucopyranose rings (glucose monomers) linked via (1→4) glycosidic bonds. A characteristic branching point is shown where a single glucose unit is attached to the main chain via an alpha-(1→6) glycosidic linkage. Each pyranose ring displays hydroxyl (-OH) functional groups and a primary alcohol group (-CH2OH), highlighting the hydrophilic nature of the molecule. This structure is chemically similar to glycogen and is studied in medical research for its immunomodulatory properties, specifically its ability to activate macrophages and stimulate tumor necrosis factor-alpha (TNF-alpha) production, which is relevant to immunology and pharmacology.
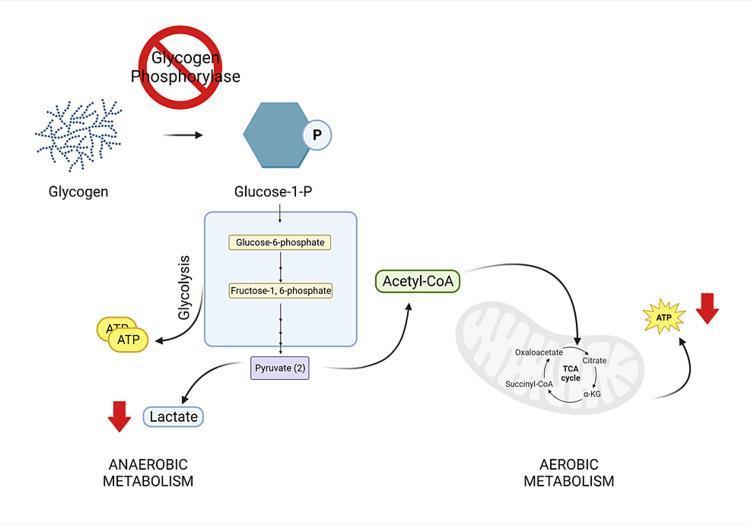
This pathophysiology diagram illustrates the metabolic consequences of Glycogen Phosphorylase deficiency, characteristic of McArdle disease (Glycogen Storage Disease Type V). The visual shows the metabolic flow starting with glycogen conversion to glucose-1-phosphate, which is overlaid with a red 'prohibited' sign on the Glycogen Phosphorylase enzyme, indicating an enzymatic block. The downstream effects are depicted through glycolysis (including glucose-6-phosphate and fructose-1,6-phosphate) leading to pyruvate. Two primary metabolic pathways are followed: 1) Anaerobic metabolism, where a red downward arrow indicates decreased lactate production, and 2) Aerobic metabolism, showing the transition of acetyl-CoA into the mitochondrion for the TCA cycle (featuring citrate, alpha-ketoglutarate, succinyl-CoA, and oxaloacetate). A yellow starburst labeled ATP is accompanied by a red downward arrow, signifying impaired adenosine triphosphate production in muscle cells. This diagram serves as an educational tool for understanding the biochemical basis of exercise intolerance and the lack of lactate rise during ischemic exercise tests in patients with McArdle disease.
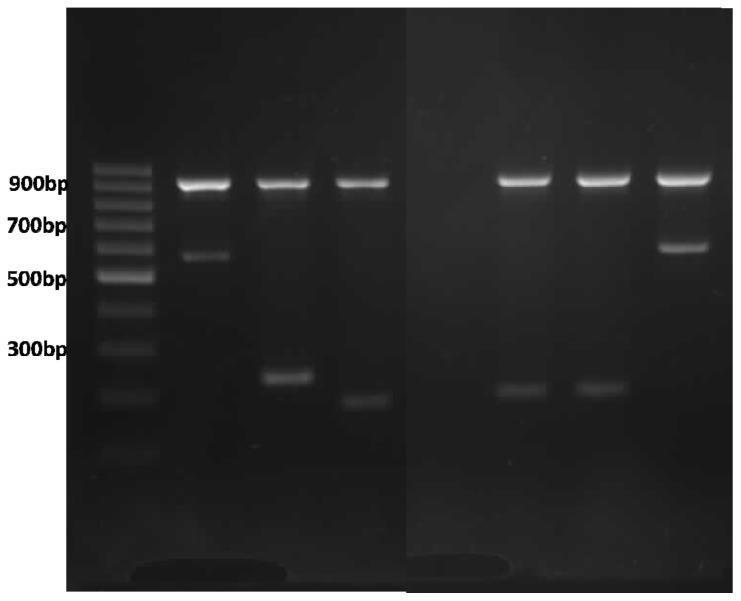
This diagnostic image shows an agarose gel electrophoresis result from a multiplex Amplification Refractory Mutation System (ARMS)-PCR genotype analysis of the alpha-globin gene cluster, used for detecting alpha-thalassemia mutations. The layout consists of eight lanes. Lane 1 contains a DNA ladder with marked reference points at 300bp, 500bp, 700bp, and 900bp. Lanes 2–4 serve as positive controls for specific mutations: Cd 59 (G > A), Cd 125 (T > C), and Hb CS (term Cd TAA > CAA). Lane 5 is a non-template control (NTC), appearing empty. Lanes 6–8 contain patient samples showing Hb CS and Cd 59 genotypes. A consistent internal control band at approximately 930 bp is visible across all sample lanes (2–4 and 6–8), representing a segment of the 3′ UTR of the LIS1 gene. Secondary bands of varying molecular weights indicate the presence of specific alpha-globin gene mutations. The visual demonstrates molecular diagnostic techniques used in clinical genetics to characterize thalassemic haplotypes.
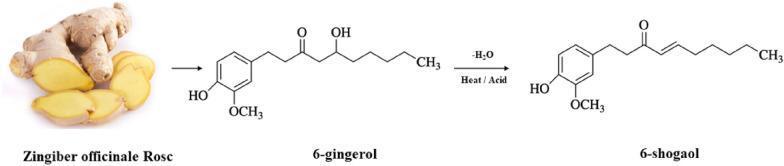
This pathophysiology diagram and clinical photograph illustrate the metabolic transformation of active compounds in Zingiber officinale Rosc (ginger). On the left, a clinical photograph shows a light-brown, knobby ginger rhizome and its sliced yellow-tan interior. An arrow points to the chemical structure of 6-gingerol, characterized by a hydroxyl (-OH) group on its alkyl chain. A subsequent reaction arrow, labeled with '-H2O' and 'Heat / Acid', denotes a dehydration process. This results in the formation of 6-shogaol, which features an alpha,beta-unsaturated carbonyl group (a Michael acceptor) where the hydroxyl group was previously located. The diagram highlights the chemical source and structural modifications required to produce 6-shogaol, a compound studied for its enhanced anti-cancer, anti-inflammatory, and anti-oxidant biological activities compared to its precursor. This visual is suitable for educational modules in pharmacognosy, biochemistry, and oncology research.
![This composite educational image illustrates the development and in vivo validation of a knottin-based PET ligand targeting integrin alpha-v-beta-6 (αvβ6).
Panels a–c focus on molecular structure: (a) shows the primary amino acid sequence of the R01-MG peptide, highlighting the engineered active loop-1 (blue) containing the RTDLxxL binding motif and the cysteine-knot disulfide connectivity (yellow); (b) provides a 3D NMR structural ensemble; and (c) displays the X-ray crystal structure with associated HPLC traces and binding affinity curves.
Panels d–f demonstrate preclinical diagnostic imaging using mouse models. (d) Coronal and axial PET images compare [64Cu]DOTA-labeled variants (R01, R01-MR, R01-MG), showing high renal uptake (K) and specific tumor accumulation (cyan arrows). (e) PET comparison of [18F]FP-R01-MG in αvβ6-positive versus αvβ6-negative tumor models, confirming target specificity, alongside a [68Ga]NODAGA-labeled variant. (f) High-resolution volume-rendered PET/CT fusion images visualize the biodistribution of [18F]FP and [68Ga] labels, highlighting tracer localization in the tumor (cyan arrow), kidneys (K), and bladder (B).](https://cdn.orris.care/cdss_images/pmc_clinical_VQA_8fcaa31f5032ee073872937eb2bd9d5a9e99c44e5be75a96be85b014d7b97d97.jpg)
This composite educational image illustrates the development and in vivo validation of a knottin-based PET ligand targeting integrin alpha-v-beta-6 (αvβ6). Panels a–c focus on molecular structure: (a) shows the primary amino acid sequence of the R01-MG peptide, highlighting the engineered active loop-1 (blue) containing the RTDLxxL binding motif and the cysteine-knot disulfide connectivity (yellow); (b) provides a 3D NMR structural ensemble; and (c) displays the X-ray crystal structure with associated HPLC traces and binding affinity curves. Panels d–f demonstrate preclinical diagnostic imaging using mouse models. (d) Coronal and axial PET images compare [64Cu]DOTA-labeled variants (R01, R01-MR, R01-MG), showing high renal uptake (K) and specific tumor accumulation (cyan arrows). (e) PET comparison of [18F]FP-R01-MG in αvβ6-positive versus αvβ6-negative tumor models, confirming target specificity, alongside a [68Ga]NODAGA-labeled variant. (f) High-resolution volume-rendered PET/CT fusion images visualize the biodistribution of [18F]FP and [68Ga] labels, highlighting tracer localization in the tumor (cyan arrow), kidneys (K), and bladder (B).
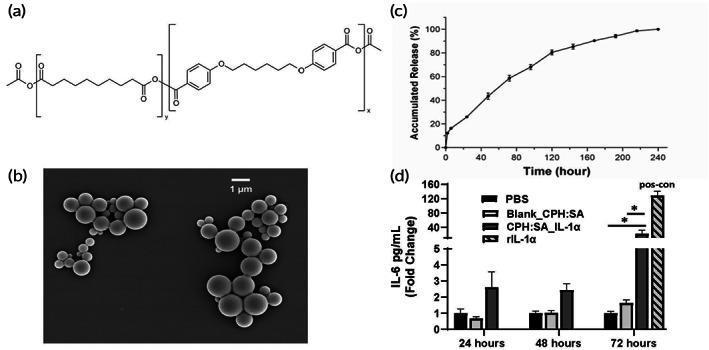
This composite educational graphic illustrates the chemical and biological characterization of interleukin-1 alpha (IL-1̑)-loaded polyanhydride microparticles (CPH:SA MPs) designed for immunotherapy. Panel (a) displays the chemical structure of the CPH:SA copolymer (1,6-bis(p-carboxyphenoxy)hexane and sebacic acid). Panel (b) is a scanning electron micrograph (SEM) showing spherical microparticles with smooth surfaces, ranging in size near 1 μm, presented in clusters. Panel (c) is a line graph depicting the in vitro release kinetics of IL-1̑ over 240 hours, demonstrating an initial burst followed by a sustained release reaching approximately 100% accumulation by day 10. Panel (d) is a bar chart representing an in vitro activity test measuring IL-6 secretion (pg/mL) from human PBMCs at 24, 48, and 72 hours. The results show significant bioactivity of the IL-1̑-loaded microparticles compared to blank particles and PBS controls, with a marked increase in IL-6 production at the 72-hour mark, indicating successful preservation of the cytokine's biological function after encapsulation.
Limit Dextrin - Explained Simply
What is Glycogen First?
- Most links are alpha-1,4 bonds (straight chains - like the trunk and branches)
- At every fork point, there's an alpha-1,6 bond (the branching point)
What is a Limit Dextrin?
"Phosphorylase sequentially cleaves the alpha-1,4 bonds until four glucosyl units remain on each chain at a branch point. The resulting structure is called a limit dextrin, and phosphorylase cannot degrade it any further."
- Lippincott's Illustrated Reviews: Biochemistry, 8th ed., p. 384
A Simple Analogy
What Happens to the Limit Dextrin?
- Transferase activity: It picks up 3 of the 4 remaining glucose units from a stub and moves them to the end of another chain (making it longer again, so phosphorylase can keep working there).
- Glucosidase activity: It then snips off the last single glucose unit sitting at the branch point (via the alpha-1,6 bond), releasing it as free glucose.
"This can be further degraded only by the debranching enzyme."
- Robbins & Cotran Pathologic Basis of Disease, p. 1519
Summary in 4 Steps
| Step | Enzyme | What Happens |
|---|---|---|
| 1 | Glycogen phosphorylase | Chops glucose from chain tips; stops 4 units from each branch point |
| 2 | Limit dextrin formed | Stubby branched structure remains; phosphorylase is stuck |
| 3 | Debranching enzyme (transferase) | Moves 3 glucose units off each stub to another chain |
| 4 | Debranching enzyme (glucosidase) | Releases the last glucose at the branch point as free glucose |
Why Does It Matter Clinically?
- Enlarged liver (hepatomegaly)
- Low blood sugar (hypoglycemia)
- Muscle weakness
"When debranching enzyme is defective, glycogen breakdown is incomplete, resulting in abnormal glycogen accumulation with short outer chains, resembling limit dextrin."
- Harrison's Principles of Internal Medicine, 22nd ed.
Quick Recap
| Term | Simple meaning |
|---|---|
| Glycogen | Branched glucose storage tree |
| Phosphorylase | Enzyme that trims branches, but stops near forks |
| Limit dextrin | The leftover stubby structure phosphorylase cannot trim further |
| Debranching enzyme | The rescue enzyme that dismantles the stubs so the rest can be digested |