
Give me a chart showing weight range ideal for children 1 to 12 years, indian asper standard guideline
IAP Indian Academy of Pediatrics ideal weight chart children 1 to 12 years standard guidelines 2024
Indian children weight growth standards IAP reference
https://indianpediatrics.net/jan2015/jan-47-55.htm
A clean, professional medical growth chart titled "Ideal Weight Range for Indian Children (Ages 1-12 Years)" based on IAP 2015 and WHO 2006 guidelines. The chart is a grouped bar or line-range chart with age on the X-axis (1, 2, 3, 4, 5, 6, 7, 8, 9, 10, 11, 12 years) and weight in kilograms on the Y-axis (0-55 kg). Show three lines/bands: a green shaded band between the 3rd and 97th percentile (normal range), a blue line for the 50th percentile (median/ideal), for both boys and girls combined as average. Include a data table below the chart showing: Age | Boys 3rd-97th | Boys 50th (median) | Girls 3rd-97th | Girls 50th (median). Data rows: 1yr: Boys 7.7-12.0kg, median 9.6; Girls 7.0-11.5kg, median 8.9 | 2yr: Boys 9.7-15.3kg, median 12.2; Girls 9.0-14.8kg, median 11.5 | 3yr: Boys 11.3-17.3kg, median 14.3; Girls 10.8-16.8kg, median 13.9 | 4yr: Boys 12.7-19.5kg, median 16.3; Girls 12.3-19.5kg, median 15.8 | 5yr: Boys 13.2-24.2kg, median 17.1; Girls 12.3-25.0kg, median 16.4 | 6yr: Boys 14.5-28.3kg, median 19.3; Girls 13.7-29.1kg, median 18.7 | 7yr: Boys 16.0-33.4kg, median 21.9; Girls 15.0-32.5kg, median 20.8 | 8yr: Boys 17.5-39.4kg, median 24.8; Girls 16.5-37.2kg, median 23.5 | 9yr: Boys 19.1-45.5kg, median 27.9; Girls 17.9-43.8kg, median 26.4 | 10yr: Boys 20.7-51.8kg, median 31.1; Girls 19.7-50.0kg, median 30.2 | 11yr: Boys 22.6-58.7kg, median 34.7; Girls 22.0-56.5kg, median 34.5 | 12yr: Boys 24.9-65.0kg, median 39.0; Girls 25.0-63.0kg, median 39.0. Title at top, footnote at bottom: "Source: WHO Child Growth Standards 2006 (age 0-5 yrs) and IAP Revised Growth Charts 2015 (age 5-18 yrs). Normal range = 3rd to 97th percentile." Use a white background, blue and pink color scheme for boys and girls, clear gridlines, readable fonts.
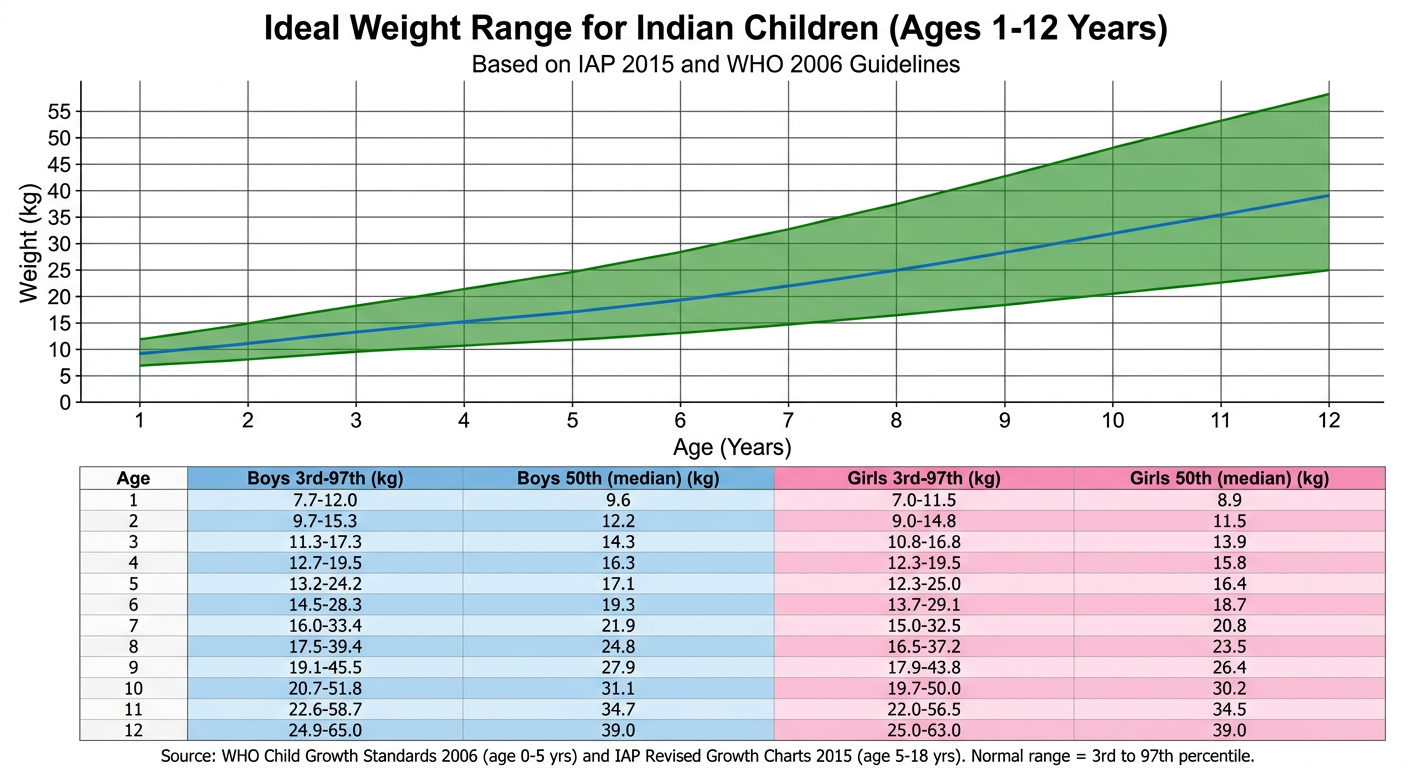
Ideal Weight Range for Indian Children (Ages 1-12 Years)
Boys - Weight in kg (3rd to 97th Percentile)
| Age | Low (3rd %ile) | Normal Low (10th) | Median (50th) | Normal High (90th) | High (97th %ile) |
|---|---|---|---|---|---|
| 1 yr | 7.7 | 8.4 | 9.6 | 11.0 | 12.0 |
| 2 yr | 9.7 | 10.5 | 12.2 | 13.9 | 15.3 |
| 3 yr | 11.3 | 12.3 | 14.3 | 16.2 | 17.3 |
| 4 yr | 12.7 | 13.8 | 16.3 | 18.6 | 19.5 |
| 5 yr | 13.2 | 14.3 | 17.1 | 21.3 | 24.2 |
| 6 yr | 14.5 | 15.8 | 19.3 | 24.6 | 28.3 |
| 7 yr | 16.0 | 17.6 | 21.9 | 28.6 | 33.4 |
| 8 yr | 17.5 | 19.5 | 24.8 | 33.2 | 39.4 |
| 9 yr | 19.1 | 21.5 | 27.9 | 38.0 | 45.5 |
| 10 yr | 20.7 | 23.5 | 31.1 | 43.0 | 51.8 |
| 11 yr | 22.6 | 25.9 | 34.7 | 48.7 | 58.7 |
| 12 yr | 24.9 | 28.7 | 39.0 | 55.0+ | 65.0+ |
Girls - Weight in kg (3rd to 97th Percentile)
| Age | Low (3rd %ile) | Normal Low (10th) | Median (50th) | Normal High (90th) | High (97th %ile) |
|---|---|---|---|---|---|
| 1 yr | 7.0 | 7.8 | 8.9 | 10.4 | 11.5 |
| 2 yr | 9.0 | 9.8 | 11.5 | 13.3 | 14.8 |
| 3 yr | 10.8 | 11.8 | 13.9 | 16.2 | 16.8 |
| 4 yr | 12.3 | 13.3 | 15.8 | 18.7 | 19.5 |
| 5 yr | 12.3 | 13.4 | 16.4 | 21.3 | 25.0 |
| 6 yr | 13.7 | 15.1 | 18.7 | 24.6 | 29.1 |
| 7 yr | 15.0 | 16.7 | 20.8 | 29.3 | 32.5 |
| 8 yr | 16.5 | 18.4 | 23.5 | 33.8 | 37.2 |
| 9 yr | 17.9 | 20.2 | 26.4 | 38.5 | 43.8 |
| 10 yr | 19.7 | 22.4 | 30.2 | 43.5 | 50.0 |
| 11 yr | 22.0 | 25.4 | 34.5 | 48.8 | 56.5 |
| 12 yr | 25.0 | 29.5 | 39.0 | 54.0 | 63.0 |
Key Guidelines
- Normal range = 3rd to 97th percentile (any child in this band is considered normal)
- Underweight concern = below 3rd percentile
- Overweight concern = above 90th percentile
- Obesity concern = above 97th percentile
- For ages 0-5 years, the IAP recommends using WHO 2006 Growth Standards
- For ages 5-18 years, the IAP recommends using IAP 2015 Revised Growth Charts (based on data from 87,000+ Indian children)
Note: The wide range at older ages (especially 9-12 years) is expected because children vary greatly in the timing of their pre-pubertal growth spurts. Always track the child's growth trend over time rather than a single measurement.