
Second heart sound, it's complications and significance
second heart sound S2 aortic pulmonary component splitting diagram
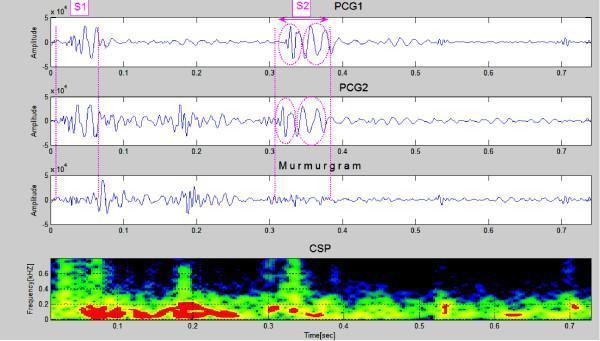
This diagnostic graphic displays cardiac acoustic data from a patient with Atrial Septal Defect (ASD). The visualization consists of four vertically aligned panels spanning a 0.7-second time frame. The top two panels show successive Phonocardiogram (PCG) waveforms (PCG1 and PCG2), identifying the first heart sound (S1) at approximately 0.05s and a clearly split second heart sound (S2) between 0.3s and 0.4s. The S2 split is highlighted with pink circles, indicating the asynchronous closure of the aortic and pulmonary valves. The third panel, labeled 'Murmurgram,' represents the subtraction of the two PCG cycles, revealing high-amplitude signal activity in the systolic interval between S1 and S2, which corresponds to a mid-systolic murmur. The bottom panel is a Cyclic Spectral Profile (CSP) or spectrogram, illustrating frequency components of the heart sounds and murmur. The murmur exhibits frequency peaks reaching approximately 400-600 Hz. This dataset serves as an educational tool for identifying the fixed splitting of S2 and the associated systolic murmur characteristic of ASD.
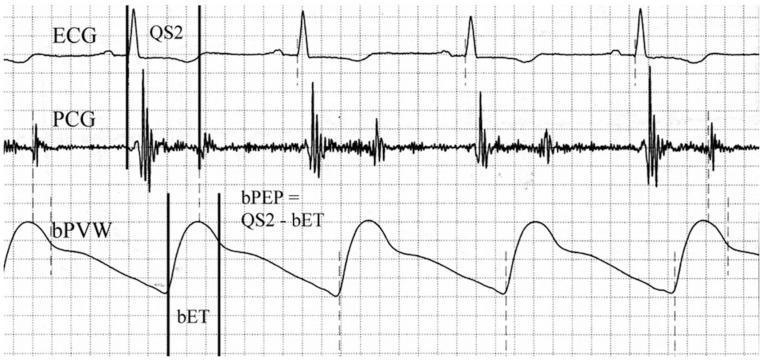
This physiological waveform diagram displays a simultaneous recording of three cardiac parameters used for assessing cardiovascular hemodynamics. The top trace is an Electrocardiogram (ECG) showing standard QRS complexes representing ventricular depolarization. The middle trace is a Phonocardiogram (PCG) capturing acoustic vibrations of heart sounds, specifically the S1 and S2 sounds. The bottom trace is a Brachial Pulse Volume Waveform (bPVW) illustrating the peripheral arterial pressure pulse. Vertical markers indicate temporal relationships between these signals to calculate systolic time intervals. The 'QS2' interval is marked from the onset of the QRS complex on the ECG to the aortic component of the second heart sound on the PCG, representing the total electromechanical systolic interval. The 'bET' (Brachial Ejection Time) is delineated on the bPVW from the waveform foot to the dicrotic notch. An annotated formula shows the calculation of the Brachial Pre-ejection Period (bPEP) as the difference between QS2 and bET (bPEP = QS2 - bET). This diagram is an educational tool for understanding the non-invasive assessment of cardiac systolic function and arterial stiffness.
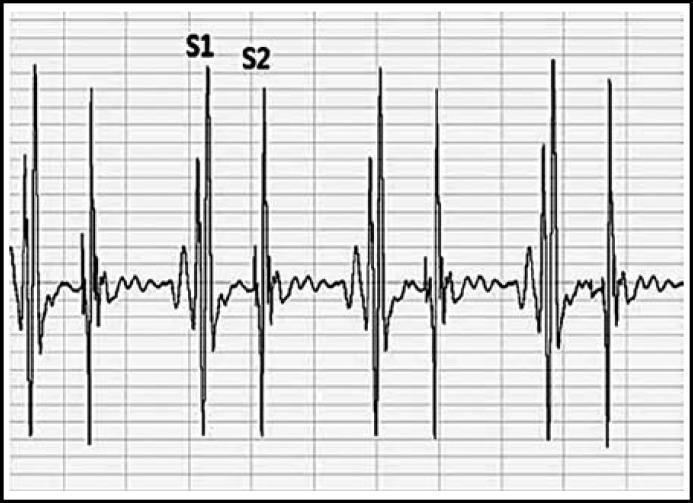
This diagnostic image displays a phonocardiogram tracing showing the amplitude waves of heart sounds recorded via an esophageal stethoscope. The waveform presents a rhythmic, repeating sequence of high-amplitude vertical spikes against a grid background. Key cardiac cycle components are labeled: 'S1' indicates the first heart sound (associated with mitral and tricuspid valve closure during ventricular systole) and 'S2' indicates the second heart sound (associated with aortic and pulmonic valve closure during ventricular diastole). Visually, S1 exhibits a slightly higher peak amplitude and sharper complex compared to S2. The interval between S1 and S2 represents the systolic phase, while the longer interval following S2 before the next S1 represents the diastolic phase. The baseline activity between these primary peaks is relatively stable with minimal noise, demonstrating the clinical utility of filtered esophageal recording for monitoring cardiac acoustic signals and assessing correlations between heart sound intensity and hemodynamic parameters like systolic blood pressure.
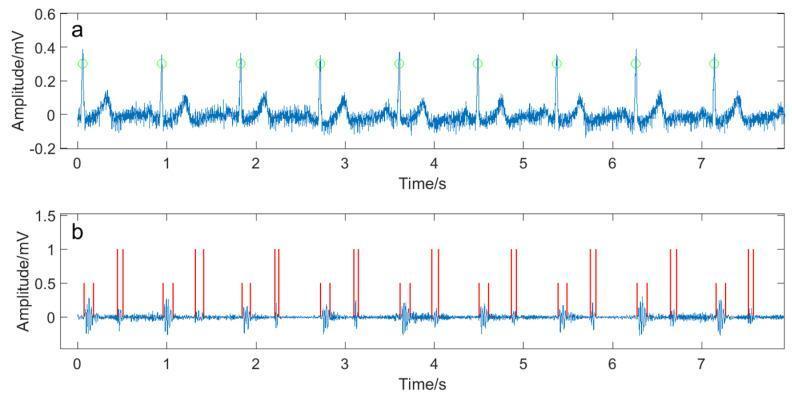
The image presents a dual-paneled physiological signal display from a patient with pulmonary hypertension, illustrating the synchronization of cardiac electrical and acoustic activity. Panel (a) shows a Lead II Electrocardiogram (ECG) trace over a 7.5-second interval. The y-axis measures amplitude in millivolts (mV), ranging from -0.2 to 0.6 mV. Green circular markers identify the detected R-waves, defining the beginning of each cardiac cycle. Panel (b) displays a corresponding heart sound signal (phonocardiogram) over the same time axis. The amplitude for the acoustic signal ranges from approximately -0.3 to 0.5 mV. Red vertical lines of varying heights indicate the detected components of the heart sound: shorter lines mark the first heart sound (S1) and longer lines mark the second heart sound (S2). This comparative visualization is used in clinical research to study the temporal relationships between electrical depolarization and mechanical valvular closure, specifically for detecting patterns or murmurs associated with pulmonary hypertension.
The Second Heart Sound (S2)
1. Origin and Normal Physiology
- A2 - aortic valve closure (occurs first, under higher systemic pressure)
- P2 - pulmonic valve closure (occurs slightly after A2 due to lower pulmonary pressures and longer right ventricular ejection time)
- Fuster and Hurst's The Heart, 15th Edition
2. Physiologic (Normal) Splitting of S2
- Enhanced venous return to right heart chambers
- Increased pulmonary vascular capacitance
- These together prolong right ventricular ejection time, delaying P2
- Left ventricular ejection time does not change significantly
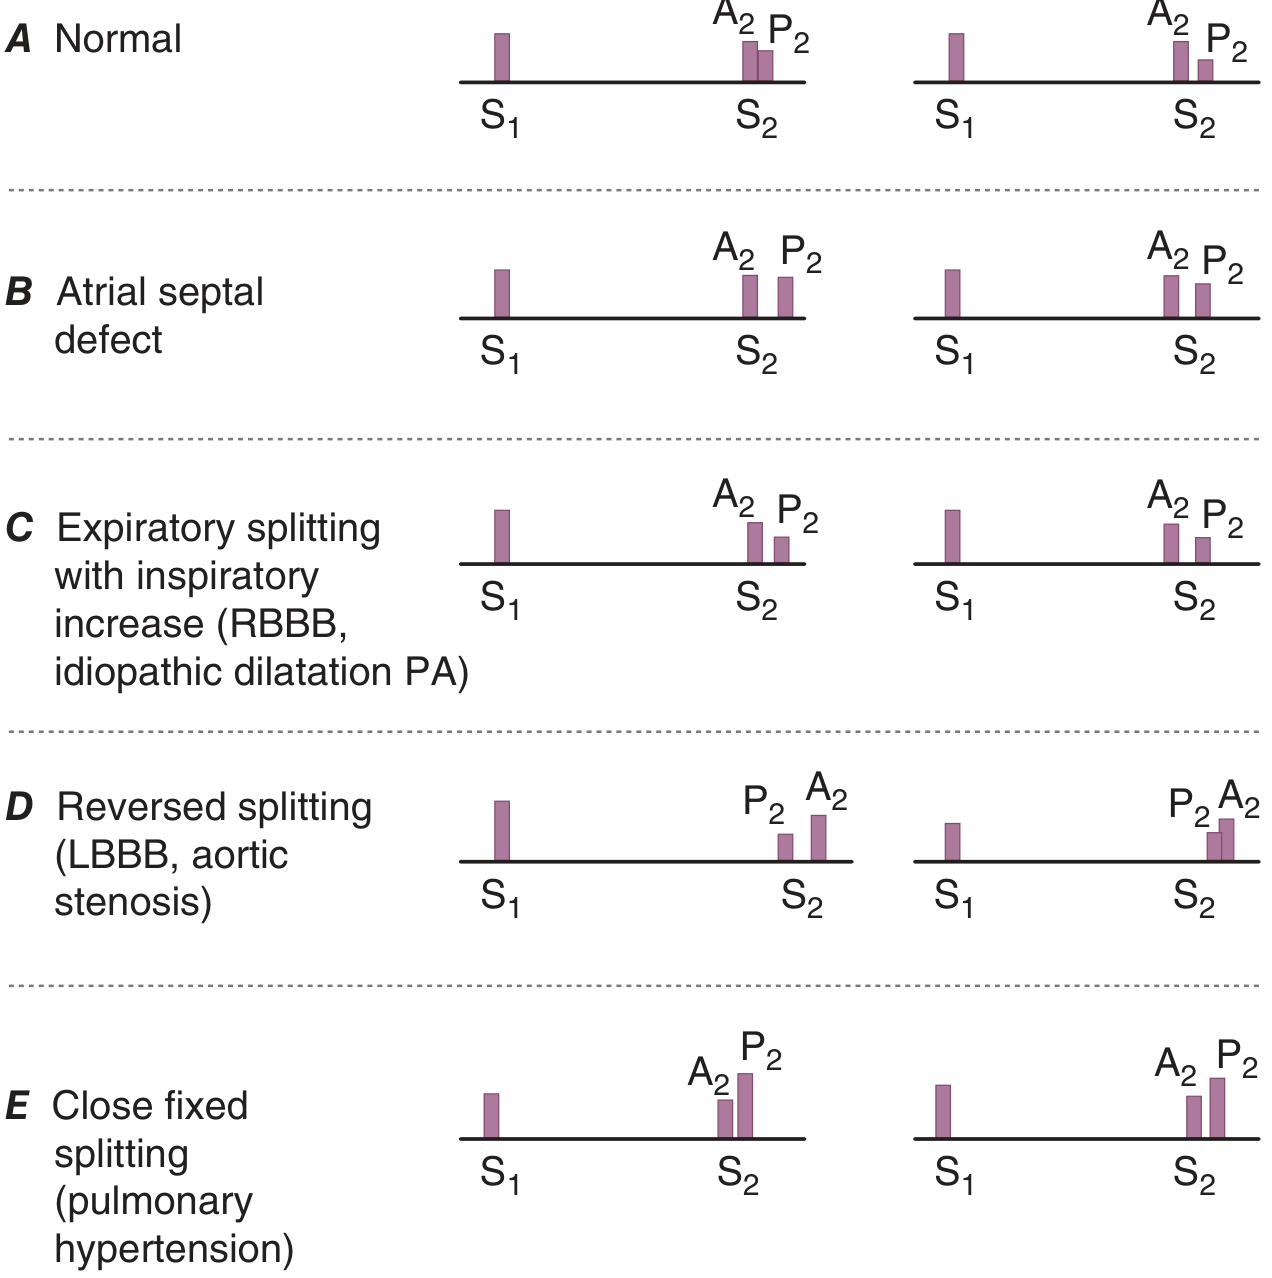
- Harrison's Principles of Internal Medicine 22E
3. Abnormal Splitting of S2
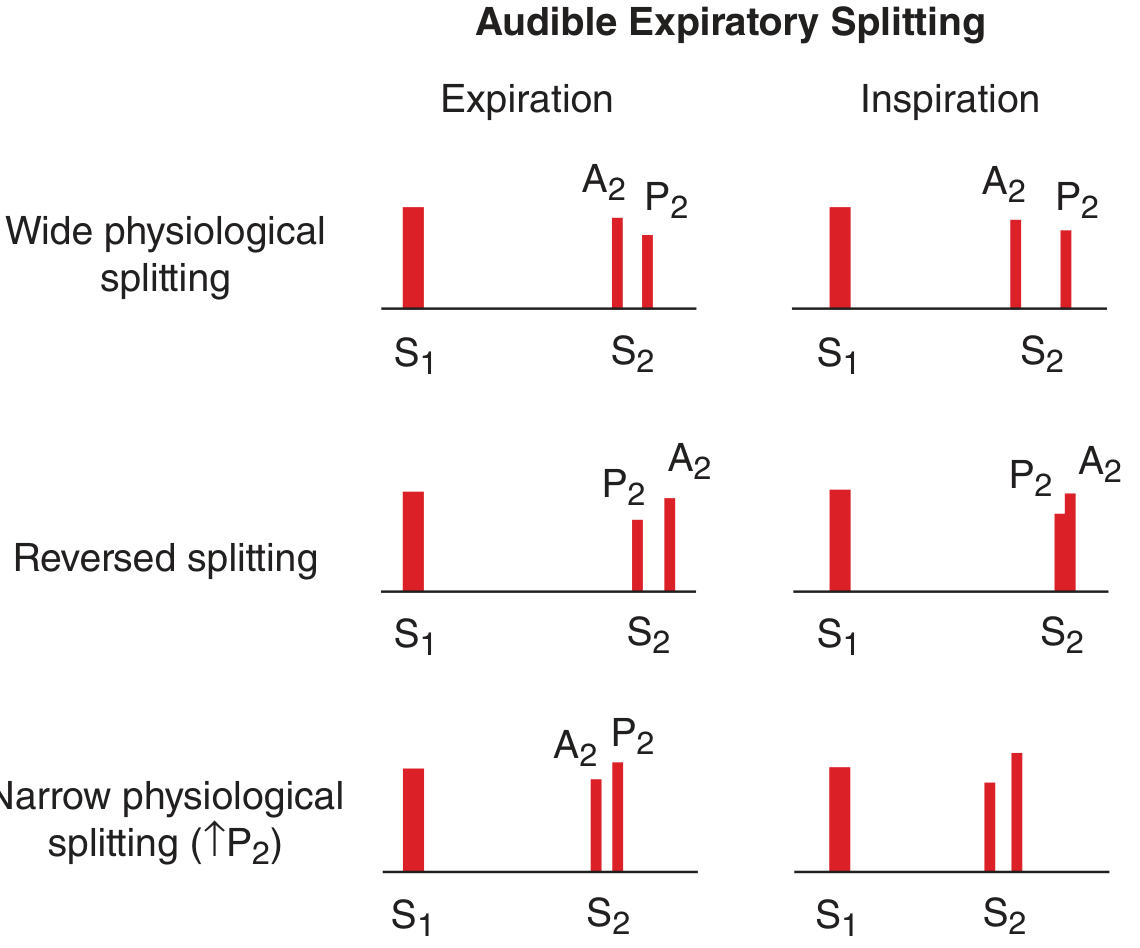
A. Paradoxical (Reversed) Splitting
- P2 precedes A2 (reversed order)
- Splitting is heard on expiration and disappears on inspiration (the opposite of normal)
- Mechanism: delayed aortic valve closure due to prolonged LV ejection time (>300 ms)
| Cause | Mechanism |
|---|---|
| Left bundle branch block (LBBB) | Delayed LV lateral wall activation |
| Right ventricular pacing | Delayed LV activation |
| Severe aortic stenosis | Prolonged LV ejection against high resistance |
| Hypertrophic obstructive cardiomyopathy (HOCM) | Dynamic LV outflow obstruction (most common cause in practice) |
| Acute myocardial ischemia | Non-uniform LV contraction |
| Wolff-Parkinson-White type B | Accessory pathway delays LV activation |
Note: In severe calcific aortic stenosis, A2 is often absent or inaudible, so paradoxical splitting is rarely appreciated despite the prolonged ejection time.
Patients with paradoxical splitting of S2 and reduced LV systolic function appear to respond favorably to cardiac resynchronization therapy (CRT).
- Fuster and Hurst's The Heart, 15th Edition
B. Persistent (Wide) Splitting
- S2 is widely split at baseline (both A2 and P2 audible)
- With inspiration, the A2-P2 interval widens further (inspiratory increase, but not fixed)
- Mechanism: underlying delay in P2, reflecting abnormal right ventricular ejection hemodynamics
- Right bundle branch block (RBBB) - most common cause in clinical practice
- Severe pulmonary hypertension - increased RV afterload prolongs ejection
- Severe MR - premature aortic valve closure (early A2 moves away from P2)
- Idiopathic dilation of the pulmonary artery
C. Fixed Splitting
- S2 is widely split at baseline AND the A2-P2 interval shows minimal or no change with respiration
- Classic sign of ostium secundum atrial septal defect (ASD)
-
RV volume overload (ASD, partial anomalous pulmonary venous return)
-
RV pressure overload (pulmonic stenosis)
-
RBBB
-
Occasionally normal in children
-
Fuster and Hurst's The Heart, 15th Edition; Harrison's Principles of Internal Medicine 22E
4. Abnormalities of S2 Component Intensity
Loud P2
- Pulmonary arterial hypertension - the most important cause; P2 may be palpable in severe cases
- Clinical significance by where P2 is audible:
- Left upper chest only: normal
- Left lower sternal border: moderate pulmonary hypertension
- Apex: severe pulmonary hypertension
- Narrow or single S2 also occurs in pulmonary hypertension
Diminished / Absent P2
- Increased anteroposterior thoracic distance (barrel chest, COPD) - most common cause of single S2 in practice
- Pectus excavatum: paradoxically loud P2 (reduced AP dimension)
- Severe valvular pulmonic stenosis - diminished or absent P2
- Congenitally corrected transposition of the great arteries - posterior pulmonary valve position makes P2 inaudible; leads to a single, loud S2
- Tetralogy of Fallot (TOF), pulmonary atresia, transposition of the great arteries (TGA)
Loud A2
- Systemic arterial hypertension - increased aortic diastolic pressure causes A2 to be accentuated
- Historically: "tambour-like" A2 in syphilitic aortitis (rarely seen today)
Diminished / Absent A2
- Calcific aortic stenosis - classic finding; an absent A2 indicates severe disease
- Important marker of disease severity: presence of a normal A2 in presumed "severe AS" should prompt investigation for subaortic or supravalvular obstruction
Single S2
-
Pulmonary hypertension (narrow split merges)
-
Single semilunar valve (pulmonary atresia, aortic atresia, truncus arteriosus)
-
Severe pulmonic stenosis (TOF, TGA) - P2 inaudible
-
Severe calcific AS
-
COPD (most common practical cause)
-
Occasionally normal
-
Fuster and Hurst's The Heart, 15th Edition; Harriet Lane Handbook, 23rd Ed
5. Clinical Summary Table
| Pattern | Respiratory Behavior | Key Causes |
|---|---|---|
| Physiologic split | Split on inspiration, single on expiration | Normal |
| Wide physiologic split | Split on expiration, widens on inspiration | RBBB, severe MR, idiopathic PA dilation |
| Fixed split | No respiratory variation, always wide | ASD (secundum), PAPVR, severe PS |
| Paradoxical (reversed) split | Split on expiration, single on inspiration | LBBB, HOCM, severe AS, RV pacing, WPW type B |
| Narrow split / single S2 | Barely audible or single throughout | Pulmonary hypertension, severe AS, COPD |
| Loud P2 | - | Pulmonary hypertension (moderate to severe) |
| Absent A2 | - | Severe calcific aortic stenosis |
6. Diagnostic and Clinical Significance
- S2 splitting and intensity provide crucial non-invasive information about valve function, ventricular conduction, and pulmonary/systemic pressures
- Fixed splitting of S2 is a bedside hallmark of ASD before any murmur is identified
- Paradoxical splitting suggests LV conduction delay or outflow obstruction; may predict CRT response
- A loud, palpable P2 strongly suggests pulmonary arterial hypertension
- Absent A2 is a bedside severity marker in aortic stenosis
- Single S2 in COPD is the most common practical cause (obscured by lung hyperinflation)