
Cardic cycle , cardiac output , ecg - physiology 12m ans
Reading File
Now let me search the library for all three topics in parallel.
Finding Sources
Finding Sources
Finding Sources
Good. Now let me read the key physiology textbook sections in parallel - Costanzo for cardiac cycle and cardiac output, Guyton for cardiac cycle, and a direct ECG heading search.
Reading File
Reading File
Finding Sources
Finding Sources
Reading File
Reading File
Reading File
Reading File
Finding Sources
Reading File
Loading Image
I now have excellent material from Costanzo, Guyton & Hall, and Miller's Anesthesia. Let me compile the comprehensive 12-mark answer.
Cardiac Cycle, Cardiac Output & ECG - Physiology (12-Mark Answer)
1. CARDIAC CYCLE
The cardiac cycle refers to all the events that occur from the beginning of one heartbeat to the beginning of the next. At a heart rate of 72 beats/min, each cycle lasts approximately 0.833 seconds (systole ~0.3 s + diastole ~0.5 s).
Each cycle is initiated by spontaneous depolarization of the SA node (right atrium). The impulse travels through both atria, is delayed at the AV node (>0.1 sec), then spreads through the His-Purkinje system to the ventricles.
Phases of the Cardiac Cycle (7 Phases - Costanzo)
The classic Wiggers diagram below summarizes all events:
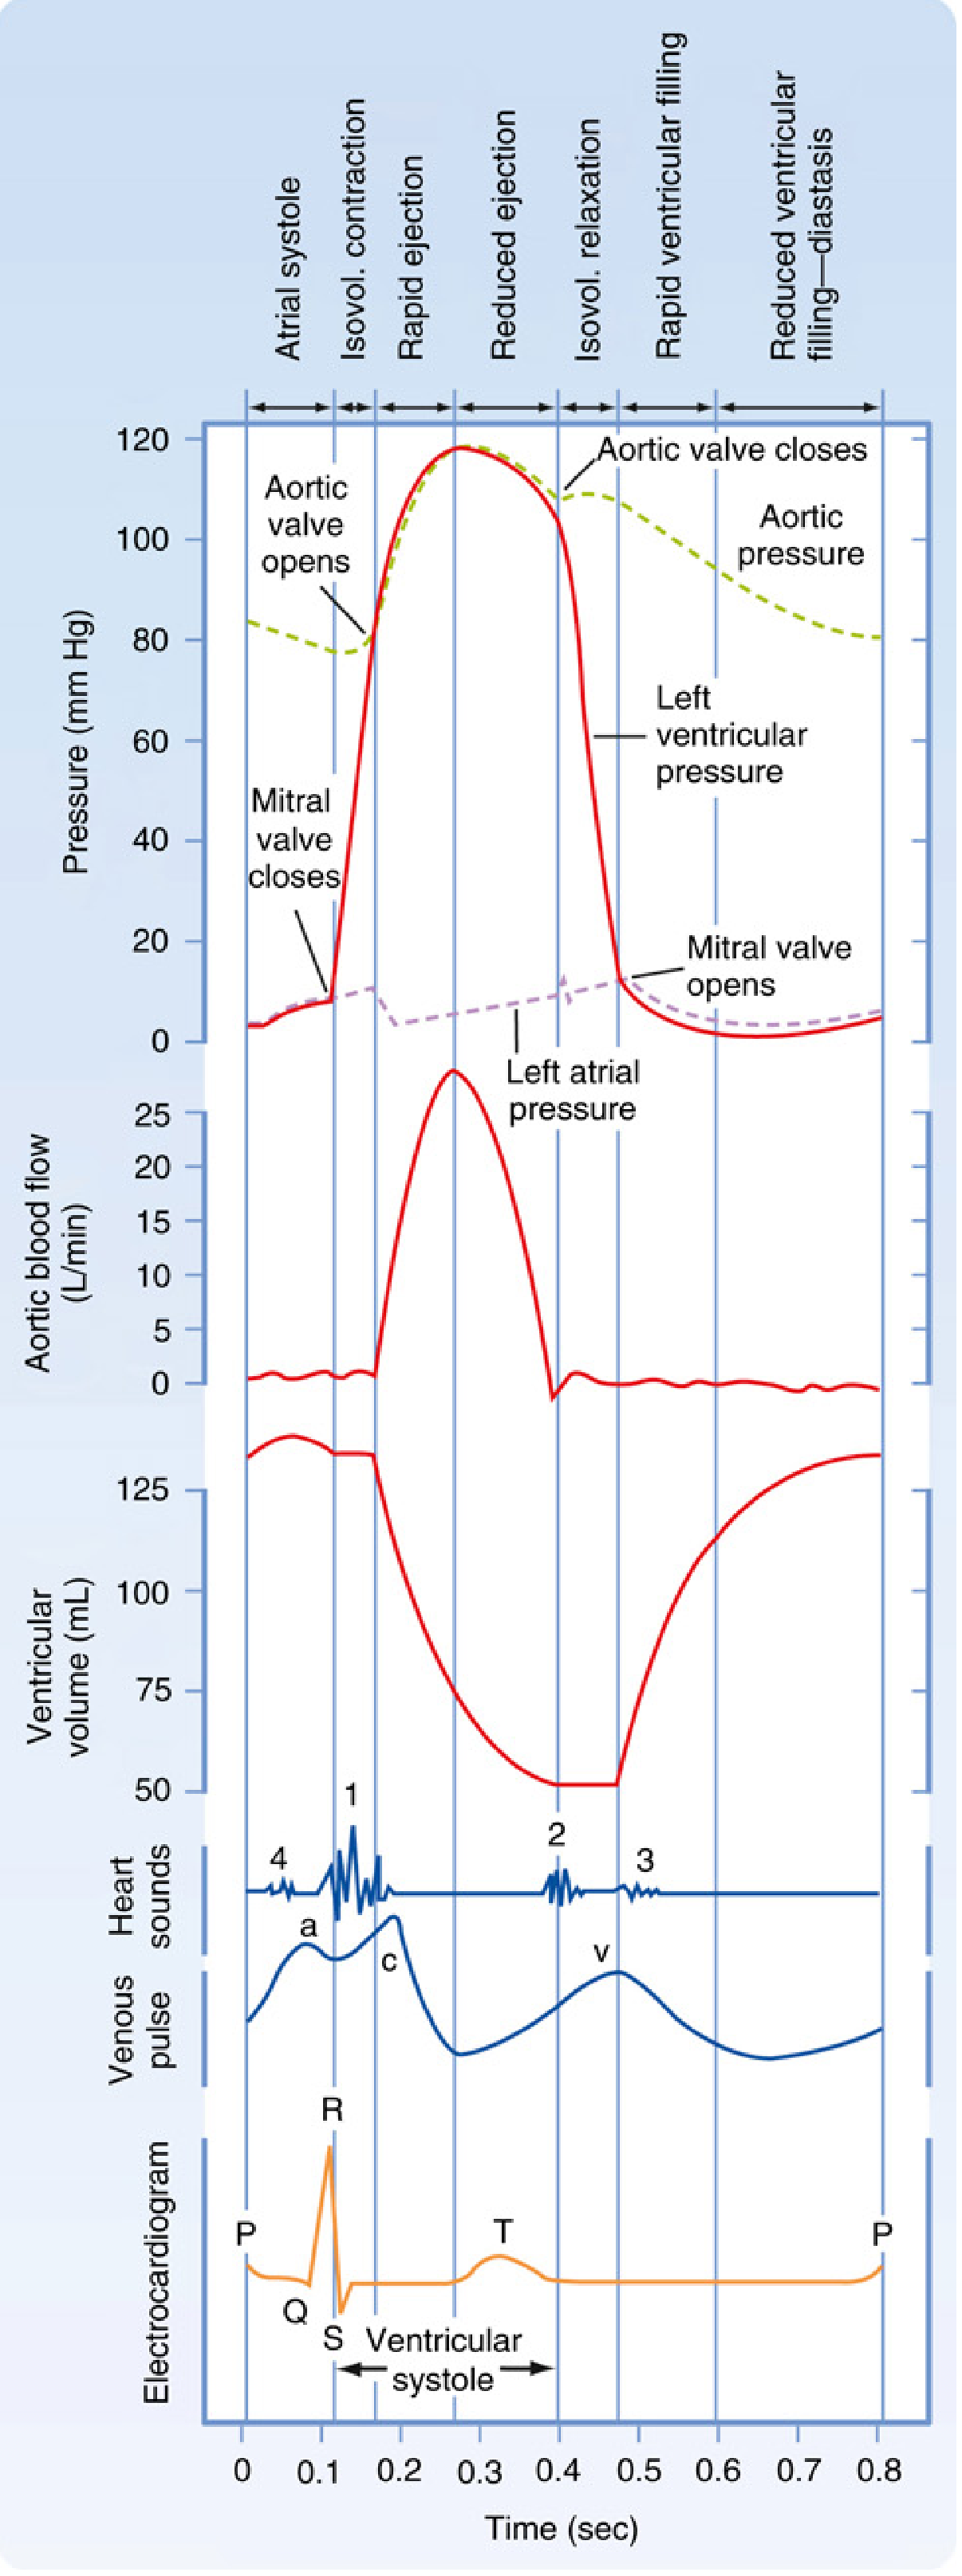
| Phase | Events | ECG | Valves | Heart Sound |
|---|---|---|---|---|
| A - Atrial Systole | Atria contract; final ventricular filling (atrial "kick" = 25% of filling) | P wave, PR interval | Mitral open | S4 (if heard) |
| B - Isovolumetric Ventricular Contraction | Ventricles contract; pressure rises; all valves closed; volume constant | QRS complex | Mitral closes | S1 |
| C - Rapid Ventricular Ejection | Ventricular pressure exceeds aortic; rapid ejection; peak pressure ~120 mmHg | ST segment | Aortic opens | - |
| D - Reduced Ventricular Ejection | Slower ejection; ventricle reaches minimum volume (ESV) | T wave | - | - |
| E - Isovolumetric Ventricular Relaxation | Ventricles relax; pressure falls; all valves closed; volume constant | - | Aortic closes | S2 |
| F - Rapid Ventricular Filling | AV valve opens; passive ventricular filling (~75% of total) | - | Mitral opens | S3 (if heard) |
| G - Reduced Ventricular Filling (Diastasis) | Slow filling continues until next atrial systole | - | - | - |
Key Pressure Values (Left Heart)
- Left atrial pressure: ~5-12 mmHg
- Left ventricular end-diastolic pressure (LVEDP): ~8-12 mmHg
- Peak LV systolic pressure: ~120 mmHg
- Aortic diastolic pressure: ~80 mmHg (dicrotic notch marks aortic valve closure)
Effect of Heart Rate on the Cycle
When heart rate increases, the duration of the entire cycle decreases, but diastole shortens proportionally more than systole. At very high heart rates, incomplete ventricular filling reduces stroke volume.
2. CARDIAC OUTPUT (CO)
Definition: Cardiac output is the volume of blood pumped by each ventricle per minute.
Formula
CO = Stroke Volume (SV) × Heart Rate (HR)
Normal values (70 kg adult male):
- CO = 70 mL × 72 beats/min = ~5 L/min
- Female values are ~15% lower (~4.9 L/min)
- Cardiac Index (CI) = CO ÷ Body Surface Area = ~3 L/min/m² (BSA ~1.7 m² in a 70 kg person)
Stroke Volume - Components
- EDV (End-Diastolic Volume) = ~120-130 mL (volume before contraction)
- ESV (End-Systolic Volume) = ~50-60 mL (volume after contraction)
- SV = EDV - ESV = ~70 mL
- Ejection Fraction (EF) = SV/EDV = 70/140 = ~50-65% (normal ≥55%)
Determinants of Cardiac Output
1. Preload - ventricular volume at end-diastole (EDV). Increased venous return → increased EDV → increased SV (Frank-Starling law).
2. Afterload - the resistance the ventricle must overcome to eject blood (i.e., aortic pressure/systemic vascular resistance). Increased afterload → decreased SV.
3. Contractility (Inotropy) - intrinsic force of myocardial contraction independent of preload/afterload. Increased by catecholamines, digoxin; decreased by heart failure, beta-blockers.
4. Heart Rate - increased HR generally increases CO, but excessive rates reduce diastolic filling time and lower SV.
Frank-Starling Law
The volume ejected by the ventricle depends on the volume present at end-diastole (EDV). As venous return increases → EDV increases → sarcomere length increases (up to optimal 2.2 µm) → greater force of contraction → greater SV. This mechanism ensures that cardiac output equals venous return in steady state.
Measurement of Cardiac Output
- Fick's principle: CO = O₂ consumption ÷ (arterial O₂ content - venous O₂ content)
- Thermodilution (Swan-Ganz catheter): most common clinical method
- Echocardiography: non-invasive
3. ELECTROCARDIOGRAM (ECG)
The ECG records the electrical activity of the heart at the body surface. It reflects differences in electrical potential generated by sequential cardiac depolarization and repolarization.
Normal ECG Waveforms
P Wave
- Caused by atrial depolarization
- Duration: <0.12 sec (3 small squares)
- Amplitude: <2.5 mm
- Represents SA node → atrial muscle conduction
PR Interval
- From start of P wave to start of QRS
- Normal: 0.12-0.20 sec
- Represents conduction through AV node, Bundle of His, and bundle branches
- Prolonged PR = 1st degree heart block
QRS Complex
- Caused by ventricular depolarization
- Duration: 0.06-0.12 sec (<3 small squares)
- Q wave = initial septal depolarization (left → right)
- R wave = main ventricular depolarization (apex → base)
- S wave = terminal depolarization (base)
- Wide QRS (>0.12 s) = bundle branch block or ventricular origin
ST Segment
- Isoelectric line between QRS end and T wave onset
- Represents ventricular plateau (phase 2 of action potential)
- Elevation >1 mm = STEMI or pericarditis
- Depression = ischemia, NSTEMI
T Wave
- Caused by ventricular repolarization
- Normally upright in most leads
- Inverted T = ischemia, ventricular hypertrophy
- Tall/peaked T = hyperkalemia
QT Interval
- From start of QRS to end of T wave
- Normal: 0.36-0.44 sec (corrected QTc = QT/√RR)
- Prolonged QT → risk of torsades de pointes
U Wave
- Small, follows T wave
- Represents repolarization of Purkinje fibers or papillary muscles
- Prominent U wave = hypokalemia
ECG Leads
- Limb leads: I, II, III (bipolar); aVR, aVL, aVF (unipolar)
- Chest leads: V1-V6 (unipolar precordial)
- Lead II most commonly shows clear PQRST (parallel to cardiac axis)
Depolarization vs. Repolarization Waves (Guyton)
- Depolarization waves (P, QRS): When the wave front travels toward an electrode, the deflection is positive (upward).
- Repolarization (T wave): The ventricles repolarize from epicardium to endocardium (opposite to depolarization), so the T wave is upright in most leads despite repolarization being the "opposite" electrical event.
Correlation with Cardiac Cycle
| ECG Event | Cardiac Mechanical Event |
|---|---|
| P wave | Atrial depolarization → atrial contraction (systole) |
| PR interval | AV node delay (allows ventricular filling) |
| QRS complex | Ventricular depolarization → ventricular systole begins, S1 (mitral valve closure) |
| ST segment | Rapid ventricular ejection |
| T wave | Ventricular repolarization → diastole begins, S2 (aortic valve closure) |
Sources: Costanzo Physiology 7th Ed., p. 155-160 | Guyton & Hall Medical Physiology, Ch. 9 & 11 | Miller's Anesthesia 10th Ed., p. 1364-1368
This is a shared conversation. Sign in to Orris to start your own chat.