Ecg changes common 10
Reading File
Finding Sources
Finding Sources
Finding Sources
Reading File
Finding Sources
Reading File
Finding Sources
Finding Sources
Reading File
Reading File
Finding Sources
Finding Sources
Reading File
Loading Image
Here are the 10 Common ECG Changes you need to know, compiled from Harrison's, Washington Manual, Rosen's Emergency Medicine, and Comprehensive Clinical Nephrology:
10 Common ECG Changes
1. 🫀 Acute STEMI (ST-Elevation Myocardial Infarction)
Classic evolutionary sequence:
- Hyperacute T waves (peaked, earliest change)
- ST-segment elevation (>1 mm) in ≥2 contiguous leads
- Pathological Q waves (≥0.04 s wide, ≥0.1 mV deep) — develop within hours to days
- T-wave inversion (later phase)
- New LBBB = STEMI equivalent
Swanson's Family Medicine Review
2. 💔 NSTEMI / Unstable Angina (Subendocardial Ischemia)
- ST depression in concordant leads
- T-wave inversion (without Q waves)
- May be normal or nonspecific
Rosen's Emergency Medicine
3. ⚡ Hyperkalemia
Progressive changes with rising K⁺:
| K⁺ (mmol/L) | ECG Change |
|---|---|
| 6–7 | Peaked (tented) T waves |
| 7–8 | Flattened P waves, prolonged PR, depressed ST |
| 8–9 | Atrial standstill, wide QRS |
| >9 | Sine-wave pattern → VF → asystole |
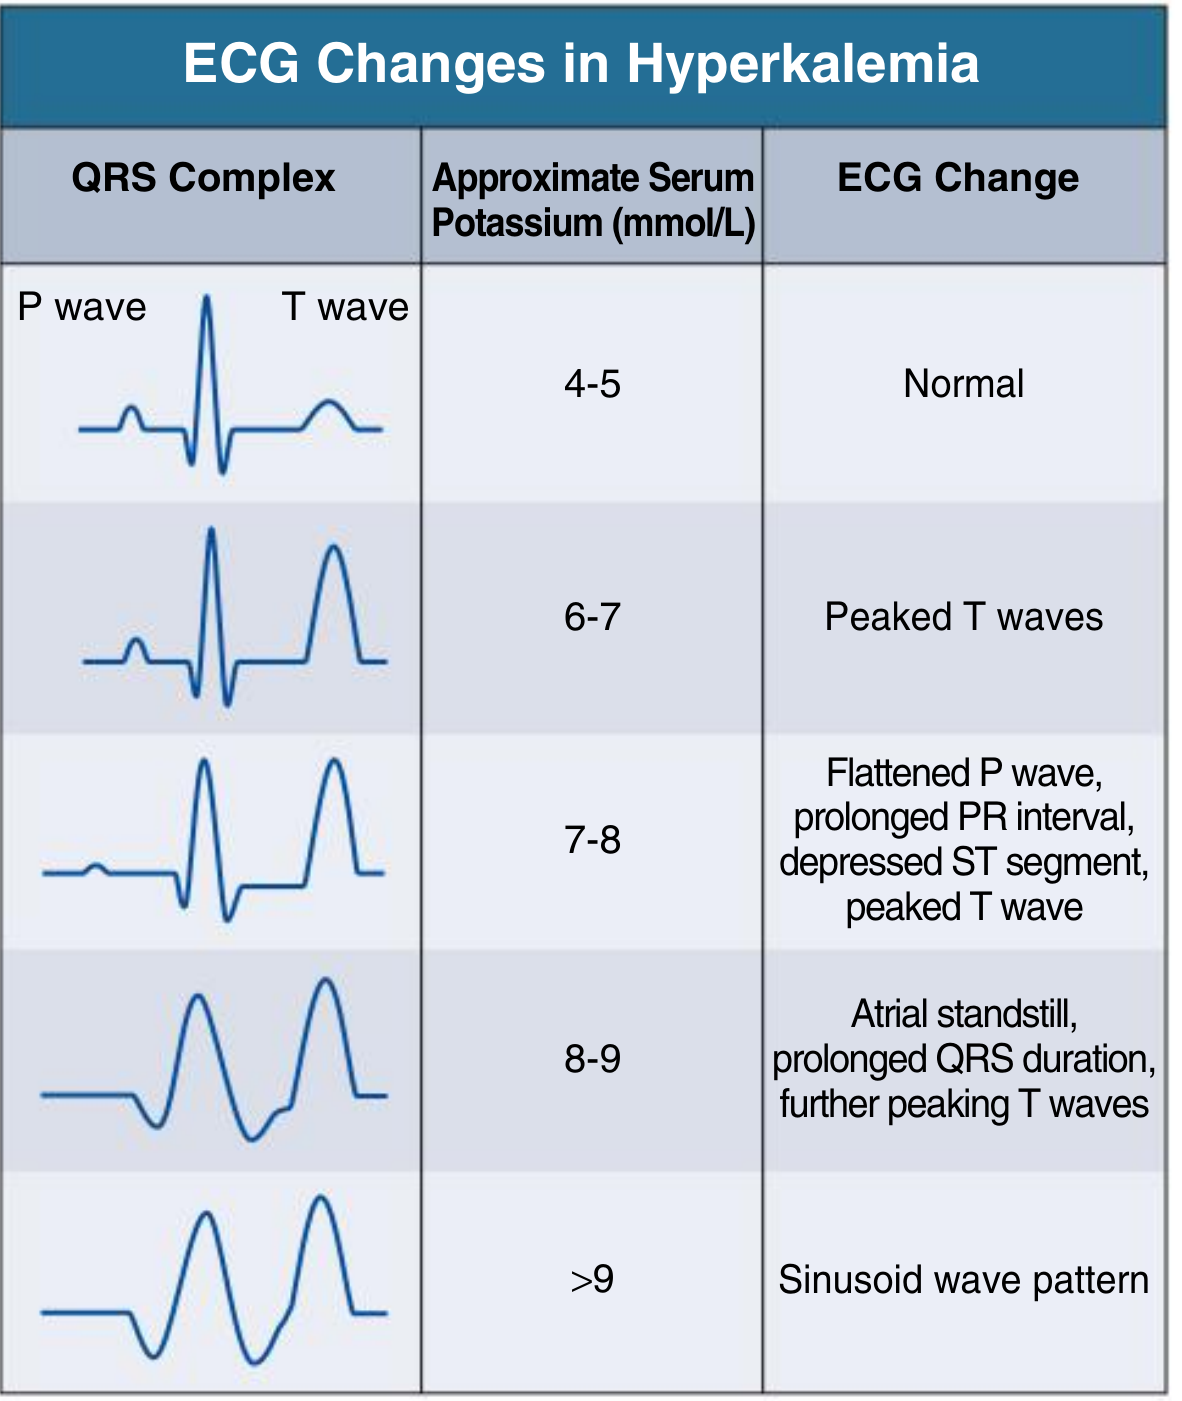
Comprehensive Clinical Nephrology, 7th Ed.
4. 🔋 Hypokalemia
- Flattened/inverted T waves
- Prominent U waves (hallmark)
- Depressed ST segment
- Prolonged QU interval (looks like QT prolongation)
- Delayed depolarization
Harrison's Principles of Internal Medicine, 22E
5. 🫁 Pulmonary Embolism (PE)
- S1Q3T3 pattern: Deep S in lead I, Q wave + T-wave inversion in lead III (classic but insensitive)
- RV strain: T-wave inversion in V1–V4
- Sinus tachycardia (most common finding)
- Right axis deviation, RBBB (acute cor pulmonale)
Rosen's Emergency Medicine
6. 💧 Pericarditis
- Diffuse (saddle-shaped) ST elevation in most leads (except aVR, V1 — which show ST depression)
- PR-segment depression (very specific sign)
- Electrical alternans → suggests pericardial effusion/tamponade
Rosen's Emergency Medicine; Washington Manual
7. 🧂 Hypocalcemia
- Prolonged QT interval (specifically the ST/QTc portion is extended)
- Predisposes to Torsades de Pointes
8. 🧂 Hypercalcemia
- Shortened QT interval
- May shorten ST segment
Harrison's Principles of Internal Medicine, 22E
9. 💊 Digitalis Effect / Toxicity
- "Scooped" ST-T wave (sagging ST depression — the "Salvador Dalí moustache" sign) = therapeutic effect
- Toxicity: PAT with block, bidirectional VT, PVCs, AV blocks
- Shortens QT interval
Harrison's Principles of Internal Medicine, 22E
10. 🌡️ Hypothermia
- Osborn wave (J wave): Characteristic convex hump at the J point, best seen in V5–V6 and leads II/aVF
- Bradycardia
- Prolonged PR, QRS, QT intervals
- Shivering artifact
- Risk of VF at core temperature <30°C
Harrison's Principles of Internal Medicine, 22E
Bonus Summary Table
| Condition | Key ECG Finding |
|---|---|
| STEMI | ST elevation, hyperacute T, Q waves |
| NSTEMI/UA | ST depression, T inversion |
| Hyperkalemia | Peaked T → sine wave |
| Hypokalemia | Prominent U waves, flat T |
| PE | S1Q3T3, RV strain, tachycardia |
| Pericarditis | Diffuse ST↑, PR depression |
| Hypocalcemia | Long QT |
| Hypercalcemia | Short QT |
| Digitalis | Scooped ST, short QT |
| Hypothermia | Osborn (J) wave, bradycardia |
Quick memory tip:
"STEMI peaks early, Peri-PR drops, K+ tents then sines, Hypo-Ca stretches QT, Hypo-K shows U, PE strains the right, Dig scoops, Hypo-therm Osborns"
Each ecg explain with images of ecg and markings
Searching Images
STEMI ST elevation myocardial infarction ECG 12 lead
Searching Images
hyperkalemia peaked T waves sine wave ECG changes
Searching Images
pericarditis diffuse ST elevation PR depression ECG
Searching Images
hypokalemia U wave flat T wave ECG
Searching Images
pulmonary embolism S1Q3T3 right ventricular strain ECG
Searching Images
hypothermia Osborn J wave ECG bradycardia
Searching Images
NSTEMI ST depression T wave inversion subendocardial ischemia ECG
Searching Images
digitalis effect scooped ST depression ECG digoxin toxicity
Searching Images
hypocalcemia prolonged QT interval ECG hypercalcemia short QT
Here are all 10 Common ECG Changes with Images and Markings:
📊 10 Common ECG Changes — With Images
1. 🔴 STEMI (ST-Elevation Myocardial Infarction)

What to look for (markings):
| Finding | Location | Significance |
|---|---|---|
| ▲ ST elevation (convex/tombstone) | V1–V6 (anterior), II/III/aVF (inferior) | Acute injury = STEMI |
| ▲ Hyperacute T waves (tall, peaked, broad-based) | Same leads as STE | Earliest sign |
| ▼ Reciprocal ST depression | Opposite leads (e.g., II/III/aVF if anterior) | Confirms STEMI |
| Q waves (wide ≥0.04s, deep ≥0.1mV) | Infarcted territory | Necrosis |
| New LBBB | All leads | STEMI equivalent |
🔑 Rule: ST elevation >1 mm in ≥2 contiguous leads. New LBBB = automatic cath lab activation.
2. 🟠 NSTEMI / Unstable Angina (Subendocardial Ischemia)
What to look for:
| Finding | Description |
|---|---|
| ▼ Horizontal/downsloping ST depression | ≥0.5 mm; most specific for ischemia |
| T-wave inversion (deep, symmetric) | Subendocardial or Wellens pattern |
| No Q waves | Differentiates from STEMI |
| May be normal | High-risk feature: troponin rise confirms |
🔑 Key: ST depression (not elevation). Troponin + = NSTEMI; Troponin − = Unstable Angina.
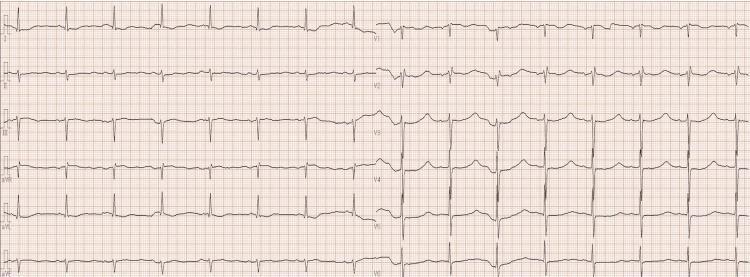
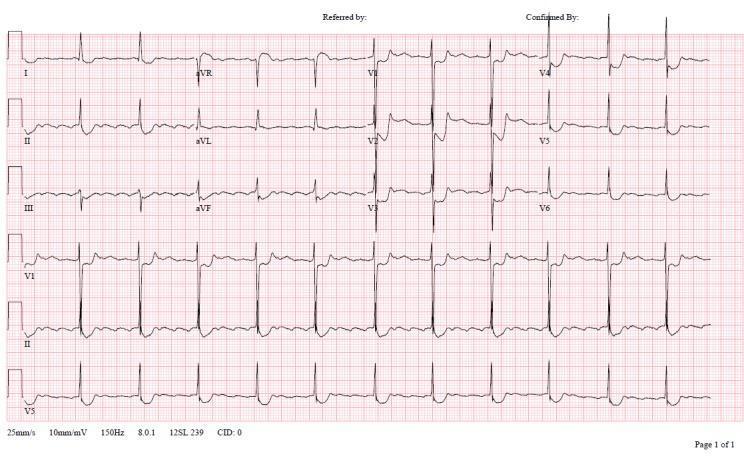
3. 🟡 Hyperkalemia
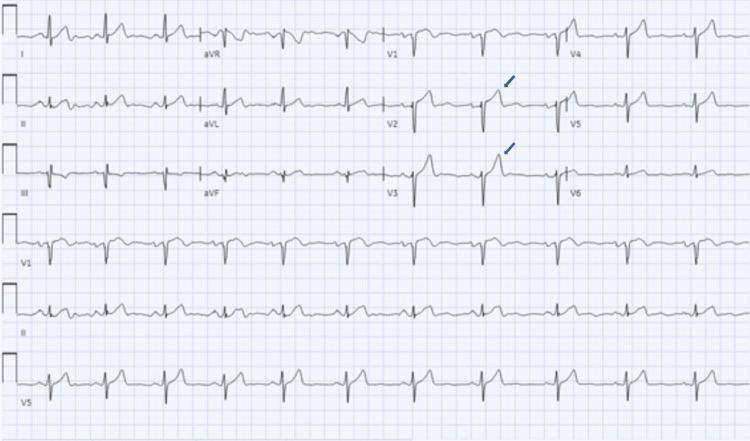
Peaked (tented) T waves with blue arrow annotations at K⁺ = 7.3 mmol/L
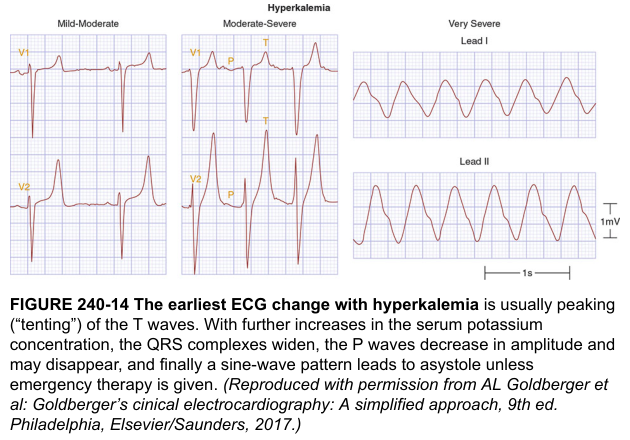
Progressive stages: Mild-Moderate → Moderate-Severe → Very Severe sine wave (Harrison's)
Sequential ECG changes:
| K⁺ Level | ECG Finding |
|---|---|
| 6–7 mmol/L | 🔺 Tall, narrow-based, peaked (tented) T waves |
| 7–8 mmol/L | Flat P waves, ↑PR interval, depressed ST |
| 8–9 mmol/L | Absent P waves (atrial standstill), wide QRS |
| >9 mmol/L | Sine wave pattern → VF → Asystole |
🔑 Memory: "The K+ rises, T peaks, P flattens, QRS widens, then sine-wave = EMERGENCY"
4. 🟢 Hypokalemia
Hallmark: flattened T waves + prominent U waves (V3–V6), "camel-hump" morphology
What to look for:
| Finding | Description |
|---|---|
| Flat/inverted T waves | Most prominent in lateral leads (I, V4–V6) |
| ▲ Prominent U wave (positive hump after T) | Best seen V2–V4; U > T amplitude = severe |
| "Camel-hump" T-U fusion | Looks like prolonged QT — actually QU interval |
| ST depression | Mild, diffuse |
🔑 U waves are the hallmark. Best seen in V2–V3. If U wave > T wave → K⁺ likely <2.5 mEq/L.
5. 🫁 Pulmonary Embolism (PE)
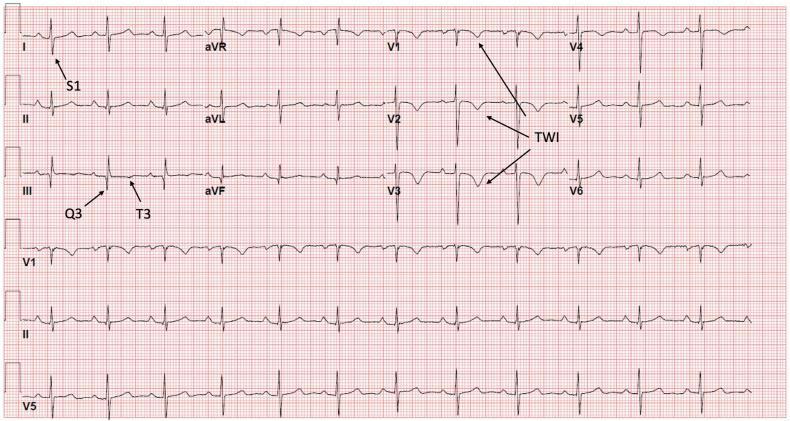
Classic S1Q3T3 pattern with labeled arrows + T-wave inversions V1–V6 (RV strain)
What to look for:
| Finding | Lead | Significance |
|---|---|---|
| S1 – deep S wave | Lead I | Right axis deviation |
| Q3 – Q wave | Lead III | RV strain |
| T3 – inverted T | Lead III | RV strain |
| T-wave inversions | V1–V4 | Anterior RV strain |
| Sinus tachycardia | All | Most common finding overall |
| Incomplete/complete RBBB | V1 rSR' | Acute cor pulmonale |
| Right axis deviation | Frontal | RV overload |
🔑 S1Q3T3 = classic but only present in ~20% of PE. Sinus tachycardia + RV strain pattern is more sensitive.
6. 💧 Pericarditis

Diffuse concave "saddle-shaped" ST elevation + PR depression in lead II + Spodick's sign
What to look for:
| Finding | Description |
|---|---|
| Diffuse concave (saddle-shaped) ST elevation | Nearly all leads except aVR, V1 |
| PR depression (most specific sign) | Lead II, V4–V6; PR elevation in aVR |
| Spodick's sign | Downsloping TP segment |
| Electrical alternans | Alternating QRS voltage = pericardial effusion/tamponade |
| NO reciprocal ST depression | Distinguishes from STEMI |
🔑 Pericarditis vs STEMI: Diffuse (not regional) ST↑, PR depression, concave (not convex) shape, no reciprocal changes.
7. 🧂 Hypocalcemia + Hypercalcemia (Combined)
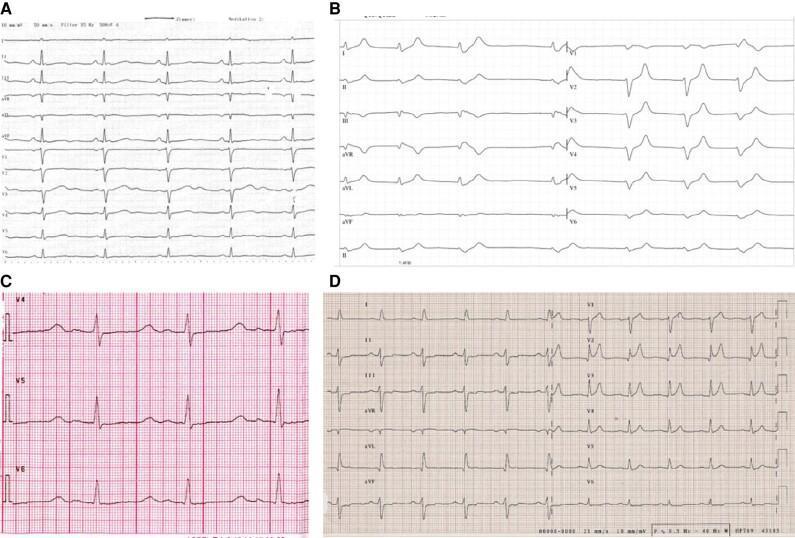
Panel C (Hypocalcemia): Long ST segment → long QT. Panel D (Hypercalcemia): Short ST → short QT
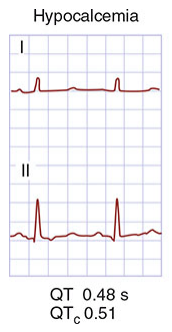
QT = 0.48s, QTc = 0.51 in hypocalcemia (Harrison's)
Hypocalcemia:
| Finding | Description |
|---|---|
| ↑ QT interval (specifically ST segment prolonged) | T wave unchanged; ST is lengthened |
| Risk of Torsades de Pointes | Polymorphic VT if QTc >500 ms |
Hypercalcemia:
| Finding | Description |
|---|---|
| ↓ Short QT interval | ST segment abbreviated |
| Short/absent ST segment | T wave sits close to QRS |
🔑 Ca²⁺ and QT: Low Ca = Long QT. High Ca = Short QT. Think: "Calcium Controls the ST segment length."
8. 💊 Digitalis Effect / Toxicity
Atrial fibrillation + classic "scooped" down-sloping ST depression V4–V6 (digoxin effect)
Therapeutic Effect vs Toxicity:
| State | ECG Finding |
|---|---|
| Digoxin effect (therapeutic) | "Scooped" / Salvador Dalí moustache ST depression, short QT |
| Toxicity | PVCs/bigeminy, PAT with block, AV blocks (2°/3°), bidirectional VT |
🔑 "Scooped" ST depression = digoxin effect (normal/therapeutic). PVCs + AV block = toxicity.
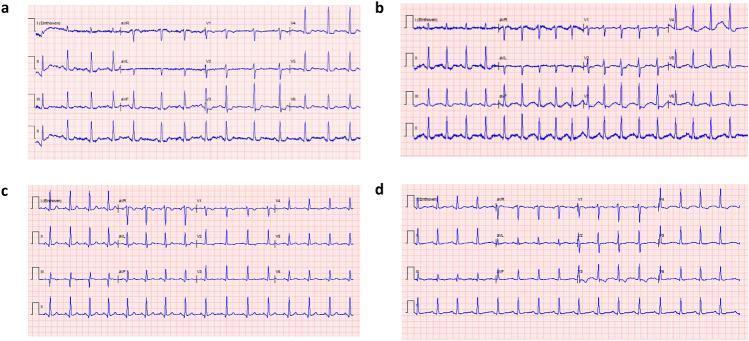
9. 🌡️ Hypothermia
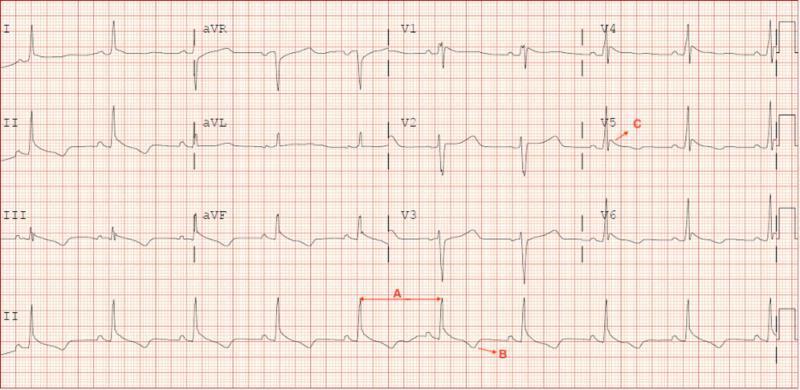
A = Sinus bradycardia. C = Osborn (J) wave hump at J-point in V5. B = T-wave inversions.
What to look for:
| Finding | Description |
|---|---|
| Osborn (J) wave | Convex hump at J-point (between QRS and ST); best in V5–V6, II/aVF |
| Sinus bradycardia | Most common rhythm |
| ↑ PR, QRS, QT intervals | All intervals prolonged |
| Shivering artifact | Baseline tremor on tracing |
| VF risk | Core temp <30°C |
🔑 Osborn wave = pathognomonic of hypothermia. Size of J wave inversely proportional to core temperature.
10. 📈 Hyperkalemia Pretreatment vs Post-Treatment
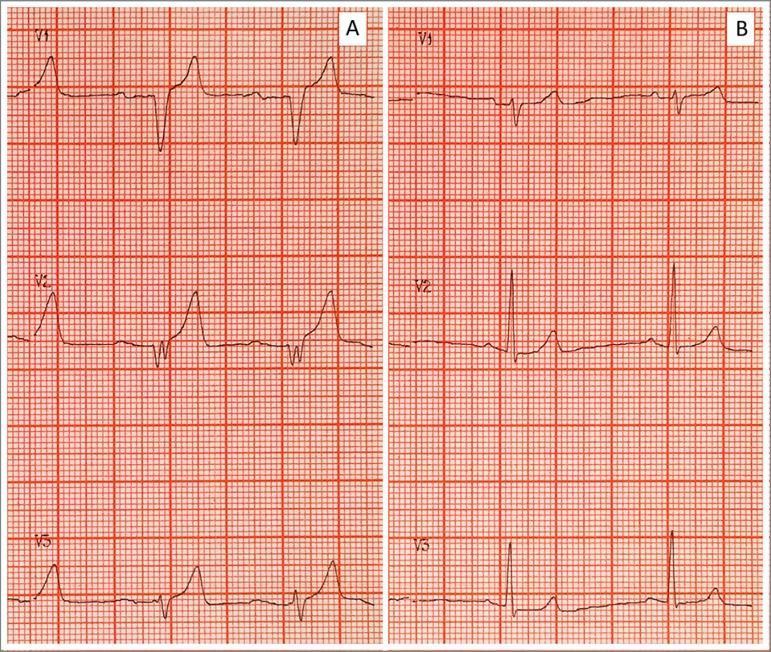
Panel A: K⁺ = 9.25 mEq/L — peaked T, wide QRS, absent P, sine wave. Panel B: After treatment — normal P waves, narrow QRS, normal T waves restored.
🗺️ Quick Visual Summary
| # | Condition | Key ECG Feature | Best Lead to See It |
|---|---|---|---|
| 1 | STEMI | ST elevation (convex) + Q waves | V1–V6 / II,III,aVF |
| 2 | NSTEMI | ST depression + T inversion | Ischemic territory |
| 3 | Hyperkalemia | Peaked T → sine wave | V2–V3 |
| 4 | Hypokalemia | U waves + flat T | V2–V4 |
| 5 | PE | S1Q3T3 + RV strain | I, III, V1–V4 |
| 6 | Pericarditis | Diffuse ST↑ + PR depression | Lead II, all leads |
| 7 | Hypocalcemia | Long QT (ST lengthened) | V2–V5 |
| 8 | Hypercalcemia | Short QT | V2–V5 |
| 9 | Digitalis | Scooped ST depression | V4–V6 |
| 10 | Hypothermia | Osborn (J) wave | V5–V6, II |
Sources: Harrison's Principles of Internal Medicine 22E, Rosen's Emergency Medicine, Comprehensive Clinical Nephrology 7th Ed, Washington Manual of Medical Therapeutics
Treatment for hyperaemia
Reading File
You've run out of free credits. Sign up for a free account to continue using Orris.
This is a shared conversation. Sign in to Orris to start your own chat.