Ecg
Asking for Preferences
Reading File
Finding Sources
Searching Images
ECG electrocardiogram normal waves intervals PQRST
Finding Sources
Finding Sources
Reading File
Finding Sources
Finding Sources
Finding Sources
Reading File
Reading File
Finding Sources
Reading File
Reading File
Reading File
Loading Image
Loading Image
Reading File
Reading File
I now have comprehensive information from Goldman-Cecil Medicine, Medical Physiology, and Harriet Lane Handbook. Here is a thorough guide to ECG basics and interpretation:
ECG Basics & Interpretation
1. What Is an ECG?
An electrocardiogram (ECG/EKG) is a graphic recording of the electrical activity of the heart over time. It is recorded on paper (or digitally) at a standard speed of 25 mm/sec, with voltage on the vertical axis (10 mm = 1 mV) and time on the horizontal axis.
Grid reference:
- 1 small box = 1 mm = 0.04 sec (40 msec)
- 1 large box = 5 mm = 0.2 sec (200 msec)
- A standard ECG records 10 seconds of cardiac activity
2. The Cardiac Conduction System
The electrical impulse follows this pathway:
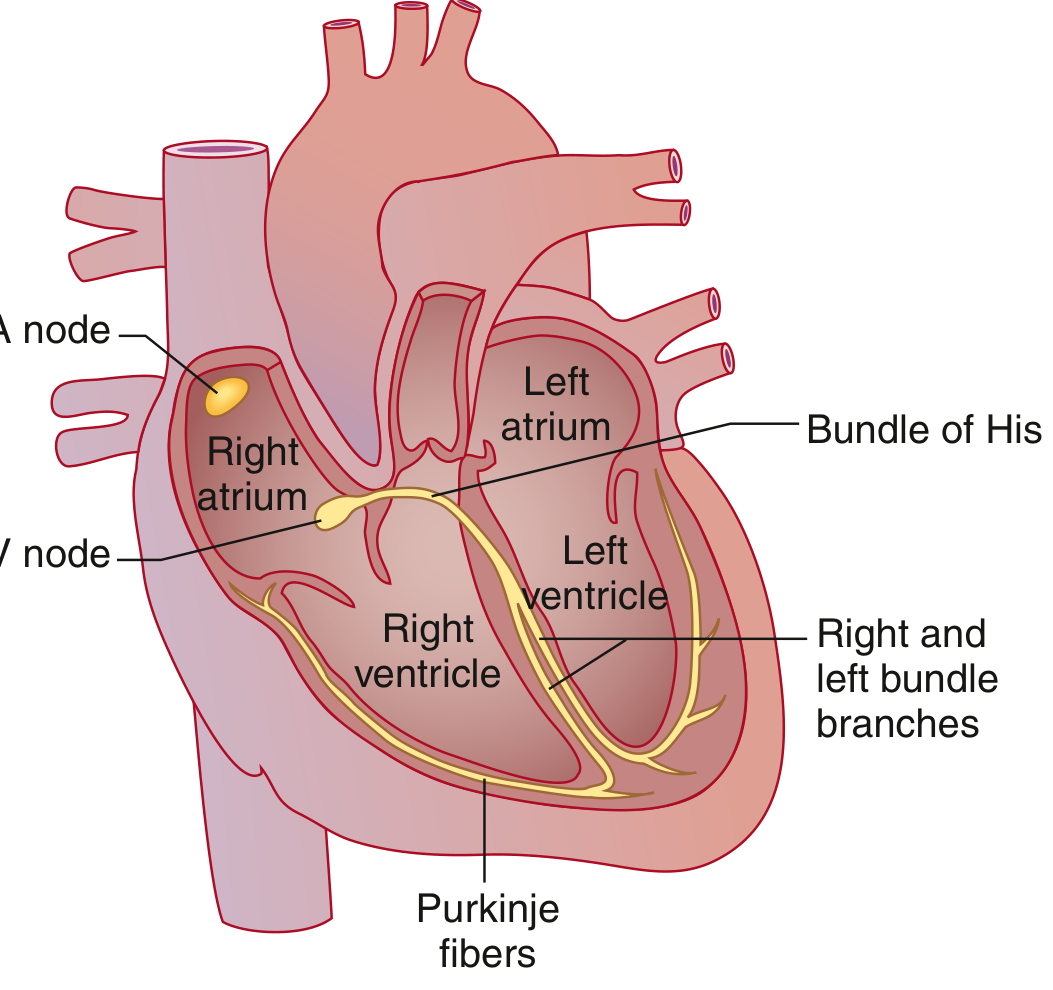
SA node → Atrial muscle (+ Bachmann bundle to left atrium) → AV node (physiologic delay) → Bundle of His → Right & Left bundle branches (left divides into anterior and posterior fascicles) → Purkinje fibers → Ventricular muscle
3. The ECG Waves — What Each Represents
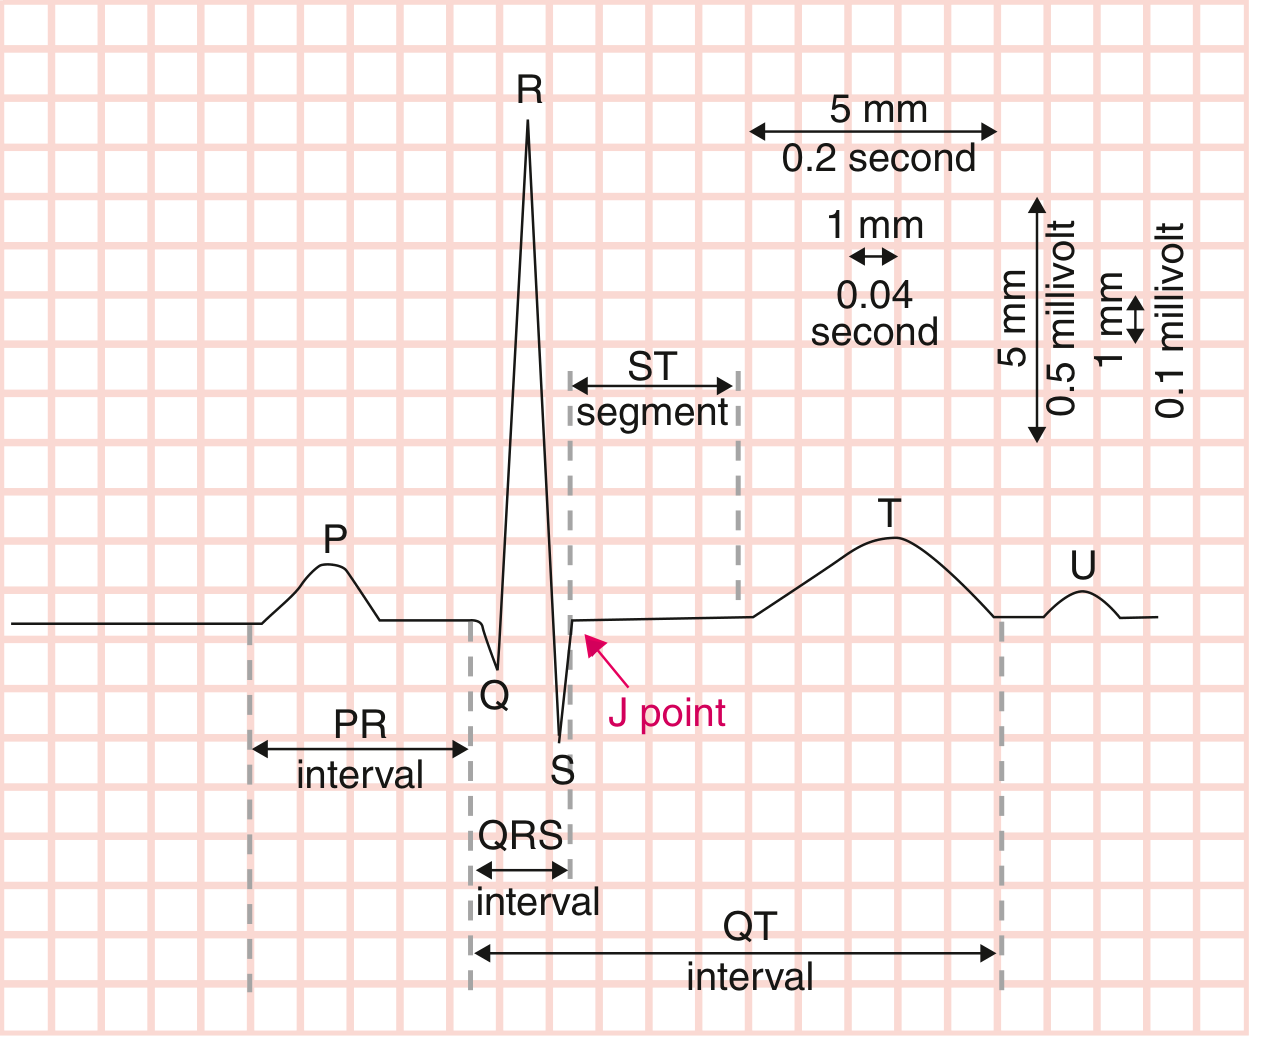
| Wave / Segment | Electrical Event |
|---|---|
| P wave | Atrial muscular depolarization |
| PR interval | Conduction through atria → AV node → His-Purkinje |
| QRS complex | Ventricular muscular depolarization |
| ST segment | Early ventricular repolarization (isoelectric phase) |
| T wave | Ventricular repolarization |
| U wave | Small deflection after T wave (same polarity); exact origin debated |
| J point | Junction between end of QRS and beginning of ST segment |
Note: Atrial repolarization is buried within the QRS complex (too low amplitude to see).
4. Normal Intervals & Values
(Goldman-Cecil Medicine, Table 42-1)
| Parameter | Normal Range |
|---|---|
| Heart rate | 50–100 bpm |
| P wave duration | < 0.12 sec (120 msec) |
| PR interval | 0.09–0.20 sec (90–200 msec) |
| QRS duration | 0.075–0.11 sec (75–110 msec) |
| QTc (males) | 0.39–0.45 sec (390–450 msec) |
| QTc (females) | 0.39–0.46 sec (390–460 msec) |
| QRS axis | −30° to +90° |
5. Calculating Heart Rate
Two quick methods:
- Formula: HR = 60,000 ÷ RR interval (msec), or HR = 300 ÷ number of large boxes between R waves
- Shortcut (large boxes between R waves):
- 1 box → 300 bpm
- 2 boxes → 150 bpm
- 3 boxes → 100 bpm
- 4 boxes → 75 bpm
- 5 boxes → 60 bpm
6. Systematic Approach to Reading an ECG
Use this 7-step framework every time:
| Step | What to Assess |
|---|---|
| 1. Rate | Calculate from RR interval |
| 2. Rhythm | Regular vs. irregular? P before every QRS? |
| 3. P waves | Present, uniform, upright in I & aVF? |
| 4. PR interval | 0.09–0.20 sec? Constant? |
| 5. QRS complex | Duration < 0.12 sec? Morphology normal? |
| 6. ST segment & T wave | Elevation/depression? T wave inversion? |
| 7. QT interval | Calculate QTc; normal per gender |
Sinus rhythm criteria: Every QRS preceded by a P wave + upright P in leads I and aVF + normal, consistent PR interval.
7. The 12 Leads — What They "Look At"
A standard 12-lead ECG uses electrodes placed on limbs and chest to view the heart from 12 angles:
| Lead Group | Leads | View |
|---|---|---|
| Inferior | II, III, aVF | Inferior wall (RCA territory) |
| Lateral | I, aVL, V5, V6 | Lateral wall (LCx territory) |
| Anterior/Septal | V1–V4 | Anterior wall (LAD territory) |
| Right-sided | aVR | Cavity/right heart |
8. Key Intervals — Clinical Significance
- Long PR (> 0.20 sec): First-degree AV block (delayed AV node conduction)
- Short PR: Pre-excitation (Wolff-Parkinson-White), junctional rhythm
- Wide QRS (> 0.12 sec): Bundle branch block, paced rhythm, hyperkalemia, accessory pathway
- Long QTc: Risk of torsades de pointes (caused by drugs, electrolyte abnormalities, congenital LQTS)
- ST elevation: Myocardial infarction (STEMI), pericarditis, Brugada
- ST depression / T inversion: Ischemia, NSTEMI, strain pattern
9. QTc Calculation (Bazett's Formula)
$$QTc = \frac{QT}{\sqrt{RR}}$$
(QT and RR both measured in seconds)
Measure QT from the beginning of the QRS to the end of the T wave. Use leads II, V5, or V6 and average 3–5 cycles.
Quick Abnormality Summary
| Finding | Think of |
|---|---|
| Delta wave + short PR | WPW pre-excitation |
| Tall peaked T waves | Hyperkalemia |
| Flattened T + U wave | Hypokalemia |
| J wave (Osborn wave) | Hypothermia |
| Diffuse ST elevation, saddle-shaped | Pericarditis |
| ST elevation in specific territory | STEMI |
| Wide QRS + LBBB pattern | LV conduction delay, cardiomyopathy |
Sources: Goldman-Cecil Medicine 26th Ed., Chapter 42 (Electrocardiography); Medical Physiology (Boron & Boulpaep); Harriet Lane Handbook 23rd Ed., Chapter 7.
Would you like to go deeper into any specific topic — such as bundle branch blocks, axis deviation, ischemia/infarction patterns, or arrhythmia recognition?
This is a shared conversation. Sign in to Orris to start your own chat.