
From the basic of complete cardio vascular and other important topic before Ecg, Then complete master class of Ecg,TMT,haltter and Echo.
What format do you want this master class content in? · What is your background/level?
- Cardiovascular basics + pre-ECG topics
- ECG master class
- TMT (Treadmill Test)
- Holter monitoring
- Echocardiography
CARDIOVASCULAR & CARDIAC INVESTIGATIONS - COMPLETE MASTER CLASS
For Medical Students | Sources: Braunwald's Heart Disease, Fuster's The Heart, Textbook of Clinical Echocardiography
PART 1: CARDIOVASCULAR BASICS (Pre-ECG Foundation)
1.1 CARDIAC ANATOMY
Gross Anatomy
- The heart weighs ~250-350 g in adults, located in the mediastinum, tilted left.
- 4 chambers: Right Atrium (RA), Right Ventricle (RV), Left Atrium (LA), Left Ventricle (LV).
- The LV wall is 3x thicker than the RV wall (~9-11 mm vs ~3-4 mm) because it pumps against systemic resistance.
Cardiac Layers
| Layer | Description |
|---|---|
| Pericardium | Fibrous outer sac + serous inner layer (parietal + visceral/epicardium). Contains ~15-50 mL pericardial fluid |
| Myocardium | Middle muscular layer - the working muscle |
| Endocardium | Inner lining; lines chambers and covers valves |
Heart Valves
| Valve | Location | Leaflets | Opens When |
|---|---|---|---|
| Tricuspid | RA-RV junction | 3 | RV diastole (filling) |
| Pulmonary | RV outflow | 3 (semilunar) | RV systole (ejection) |
| Mitral | LA-LV junction | 2 | LV diastole (filling) |
| Aortic | LV outflow | 3 (semilunar) | LV systole (ejection) |
Coronary Circulation
- Left main coronary artery (LMCA) divides into:
- LAD (Left Anterior Descending): supplies anterior LV wall, septum, apex - "widow maker"
- LCx (Left Circumflex): supplies lateral wall of LV
- RCA (Right Coronary Artery): supplies RV, inferior LV wall, SA node (60%), AV node (85%)
- Dominance: RCA-dominant in 70% of people (RCA supplies posterior descending artery - PDA)
1.2 CARDIAC MICROANATOMY & EXCITATION-CONTRACTION COUPLING
Cardiomyocytes
- Roughly brick-shaped: ~150 × 20 × 12 μm
- Constitute ~75% of ventricular volume/weight but only 1/3 of total cell number
- ~50% of cell volume = myofibrils; ~30% = mitochondria
- Atrial myocytes are smaller and more spindle-shaped
- Connected end-to-end by intercalated discs (contain gap junctions for electrical coupling)
Sarcomere - The Contractile Unit
- Sarcomere = basic unit between two Z-lines (Z-discs)
- Components:
- Actin (thin filament) - associated with troponin complex
- Myosin (thick filament) - the motor protein with ATPase activity
- Titin - elastic protein; acts as a molecular spring, senses sarcomere length
- Troponin complex: Troponin C (Ca2+ binding), Troponin I (inhibitory), Troponin T (tropomyosin binding)
Excitation-Contraction (E-C) Coupling
- Action potential travels down T-tubules (transverse tubules that invaginate from sarcolemma)
- Voltage-gated L-type Ca2+ channels (dihydropyridine receptors) open → small Ca2+ entry
- This triggers massive Ca2+ release from sarcoplasmic reticulum (SR) via ryanodine receptors (RyR2) - called calcium-induced calcium release (CICR)
- [Ca2+]i rises from ~0.1 μM to ~1 μM → Ca2+ binds Troponin C → tropomyosin moves off actin binding sites
- Cross-bridge cycling: Myosin heads attach to actin, ADP+Pi released → power stroke → muscle shortens
- Relaxation (diastole): Ca2+ removed by:
- SERCA2a pump (SR Ca-ATPase) - returns Ca2+ to SR (dominant mechanism)
- Na/Ca exchanger (NCX) - extrudes Ca2+ across sarcolemma
- Phospholamban normally inhibits SERCA; PKA phosphorylation removes this inhibition (sympathetic effect)
Frank-Starling Law
- Definition: The more the myocardium is stretched during filling (preload), the greater the force of subsequent contraction.
- Molecular basis: Increased sarcomere length increases Ca2+ sensitivity of troponin C (length-dependent activation).
- Clinical importance: Explains why increased venous return increases cardiac output.
1.3 CARDIAC ACTION POTENTIAL & CONDUCTION SYSTEM
Types of Cardiac Cells
| Cell Type | Location | Key Feature |
|---|---|---|
| Pacemaker cells | SA node, AV node | Automatic depolarization (funny current If) |
| Conducting cells | Bundle of His, Purkinje | Fast conduction, no automaticity |
| Contractile cells | Atria, ventricles | Mechanical work |
Ventricular Action Potential (5 Phases)
Phase 0 - Rapid depolarization: Fast Na+ channels open → rapid upstroke
Phase 1 - Early repolarization: Transient K+ outward current (Ito)
Phase 2 - Plateau: L-type Ca2+ channels open (Ca2+ in) balanced by K+ out → prolonged plateau; triggers contraction
Phase 3 - Rapid repolarization: K+ channels (IKr, IKs) dominate; Ca2+ channels close
Phase 4 - Resting membrane potential: Na/K ATPase restores gradients; -90 mV in ventricles
SA Node Action Potential (Pacemaker)
- No true resting potential - spontaneously depolarizes
- Funny current (If): HCN channels open during diastole → slow Na+ influx → spontaneous depolarization
- Threshold reached → L-type Ca2+ channels (not Na+) fire → upstroke
- Rate: SA node ~60-100 bpm, AV node ~40-60 bpm, Purkinje ~20-40 bpm (hierarchy of automaticity)
Normal Conduction Pathway
SA NODE (right atrium, near SVC)
    ↓  (0.04 sec - atrial depolarization → P wave)
AV NODE (junction of atria/ventricles - Koch's triangle)
    ↓  (0.1 sec delay - allows atrial emptying; PR interval)
BUNDLE OF HIS
    ↓
LEFT BUNDLE BRANCH + RIGHT BUNDLE BRANCH
    ↓
LEFT ANTERIOR + LEFT POSTERIOR FASCICLE (left side)
    ↓
PURKINJE FIBERS (rapid conduction 1-4 m/s vs AV node 0.02-0.05 m/s)
    ↓
VENTRICULAR MYOCARDIUM (depolarizes endocardium → epicardium → QRS)
- SA node conduction: 0.05 m/s (slow)
- Purkinje fibers: 4 m/s (fastest)
- Ventricular muscle: 0.3-0.4 m/s
1.4 THE CARDIAC CYCLE
Phases of the Cardiac Cycle (Starting from End-Diastole)
- Isovolumetric Contraction (IVC): Both AV and semilunar valves closed; pressure rises with no volume change. S1 heart sound (mitral & tricuspid close).
- Rapid Ejection: Aortic/pulmonary valves open when LV pressure exceeds aortic pressure (~80 mmHg)
- Reduced Ejection: Slowing of ejection as pressure gradients equalize
Key Pressure Values (Normal)
| Chamber/Vessel | Systolic (mmHg) | Diastolic (mmHg) |
|---|---|---|
| LV | 100-140 | 5-12 |
| Aorta | 100-140 | 60-90 |
| RV | 15-30 | 2-8 |
| Pulmonary artery | 15-30 | 4-12 |
| LA (PCWP) | - | 5-12 |
Heart Sounds
- S1: Mitral + Tricuspid valve closure (beginning of systole) - "Lub"
- S2: Aortic + Pulmonary valve closure (beginning of diastole) - "Dub" - splits on inspiration (A2 before P2)
- S3 (Gallop): Early diastole - rapid ventricular filling; pathological in adults >40 (heart failure, MR, VSD)
- S4: Late diastole - atrial kick against stiff ventricle; seen in LVH, hypertension, HOCM
Key Cardiac Formulas
- Cardiac Output (CO) = Heart Rate (HR) × Stroke Volume (SV)
- Normal CO = 4-8 L/min; Cardiac Index (CI) = CO/BSA = 2.2-4.0 L/min/m²
- Ejection Fraction (EF) = (SV / EDV) × 100%; Normal LV EF ≥ 55%
- Preload: EDV (end-diastolic volume); stretched muscle length before contraction
- Afterload: Wall stress during systole; primarily = aortic pressure × LV radius / (2 × wall thickness) [Laplace's Law]
- Contractility: Intrinsic force at given preload/afterload (↑ by catecholamines, digoxin; ↓ by beta-blockers, heart failure)
1.5 AUTONOMIC CONTROL OF THE HEART
Sympathetic (Fight or Flight)
- Norepinephrine → β1 receptors on SA node, AV node, myocardium
- Positive chronotropy: ↑ HR (↑ If current; ↑ slope of pacemaker depolarization)
- Positive inotropy: ↑ contractility (PKA phosphorylates Ca2+ channels, phospholamban)
- Positive dromotropy: ↑ AV node conduction speed
- Positive lusitropy: ↑ relaxation speed (faster Ca2+ reuptake)
Parasympathetic (Rest & Digest)
- Acetylcholine → M2 receptors
- ↑ K+ conductance → hyperpolarizes SA node → ↓ HR (negative chronotropy)
- Slows AV node conduction (negative dromotropy)
- Minimal effect on contractility (less vagal innervation of ventricles)
1.6 IMPORTANT PRE-ECG ELECTROPHYSIOLOGY CONCEPTS
Ion Channels Summary
| Channel | Current | Phase | Blocker |
|---|---|---|---|
| Fast Na+ | INa | Phase 0 (ventricle) | Class I antiarrhythmics |
| L-type Ca2+ | ICaL | Phase 2 | Class IV (verapamil, diltiazem) |
| IKr (rapid K+) | IKr | Phase 3 | Class III; also QT-prolonging drugs |
| IKs (slow K+) | IKs | Phase 3 | - |
| Funny (If) | If | Phase 4 pacemaker | Ivabradine |
| KATP | IKATP | Ischemia | - |
Refractory Periods
- Absolute Refractory Period (ARP): No stimulus can re-excite the cell (Phases 0, 1, 2, and early Phase 3)
- Relative Refractory Period (RRP): Only very strong stimulus can excite (late Phase 3)
- R-on-T phenomenon: If a PVC lands on T-wave (vulnerable period = RRP), can trigger VF
QT Interval and Repolarization
- QT represents ventricular depolarization + repolarization
- Corrected QT (QTc) = QT / √(RR interval) [Bazett's formula]
- QTc >440 ms (men) or >460 ms (women) = prolonged
- Prolonged QT → risk of Torsades de Pointes (TdP)
PART 2: ECG MASTER CLASS
2.1 ECG BASICS - THE ELECTROCARDIOGRAM
What is an ECG?
Standard ECG Setup
- 12-lead ECG: 10 electrodes (4 limb + 6 precordial) generate 12 views
- Recording speed: 25 mm/sec (standard)
- Amplitude: 10 mm = 1 mV (standard)
Time and Voltage Calibration
Small box = 1 mm = 0.04 sec (horizontal) = 0.1 mV (vertical)
Large box = 5 mm = 0.20 sec (horizontal) = 0.5 mV (vertical)
2.2 THE 12 LEADS - VIEWS OF THE HEART
Limb Leads (Frontal Plane)
| Lead | View | Positive Electrode | Negative Electrode |
|---|---|---|---|
| I | Lateral | Left arm (LA) | Right arm (RA) |
| II | Inferior | Left leg (LL) | Right arm (RA) |
| III | Inferior | Left leg (LL) | Left arm (LA) |
| aVR | Right heart/cavity | Right arm | All others |
| aVL | Lateral | Left arm | All others |
| aVF | Inferior | Left foot | All others |
Precordial Leads (Transverse/Horizontal Plane)
| Lead | Position | View |
|---|---|---|
| V1 | 4th ICS, right sternal border | Septal/RV |
| V2 | 4th ICS, left sternal border | Septal |
| V3 | Between V2 and V4 | Anterior |
| V4 | 5th ICS, mid-clavicular line | Anterior |
| V5 | Anterior axillary line, same level as V4 | Lateral |
| V6 | Mid-axillary line, same level as V4 | Lateral |
Anatomical Groupings (Critical for MI Localization!)
Inferior: II, III, aVF → (RCA territory usually)
Lateral: I, aVL, V5, V6 → (LCx territory usually)
Anterior: V1-V4 → (LAD territory)
Septal: V1-V2 → (LAD septal branch)
High lateral: I, aVL → (LCx or diagonal branch)
Right ventricular: V1, V3R-V4R (right-sided leads) → (RCA)
Posterior: reciprocal changes in V1-V2 + ST elevation in V7-V9
2.3 ECG WAVEFORMS AND INTERVALS
Normal ECG Components
P wave:    Atrial depolarization (SA node → AV node)
           Normal: <0.12 sec, <2.5 mm, positive in I, II, aVF

PR interval: AV node conduction time (PR segment = AV node delay)
           Normal: 0.12-0.20 sec (3-5 small boxes)

QRS complex: Ventricular depolarization
           Normal: <0.12 sec (3 small boxes)
           Q wave: first downward deflection
           R wave: first upward deflection
           S wave: downward after R

ST segment: Isoelectric period after ventricular depolarization
           Normal: at baseline ± 1 mm

T wave:    Ventricular repolarization
           Normally positive in I, II, V2-V6
           Normally inverted in aVR, V1 (variable in III, aVL)

QT interval: Total ventricular depolarization + repolarization
           QTc: Bazett = QT/√RR (seconds)
           Normal: QTc ≤ 440 ms (men), ≤ 460 ms (women)

U wave:    Small wave after T wave; represents Purkinje repolarization
           Prominent in hypokalemia
R Wave Progression (Normal)
- V1: mainly negative (rS pattern) - depolarization moving away
- V3-V4: R = S (transition zone)
- V5-V6: mainly positive (qR pattern) - depolarization moving toward
- Poor R-wave progression: suggests anterior MI or LBBB
2.4 SYSTEMATIC ECG INTERPRETATION - THE 8-STEP METHOD
Step 1 - RATE
  Counting: 300 / number of large boxes between R waves
  OR: 1500 / number of small boxes between R waves
  Bradycardia: <60 bpm | Normal: 60-100 bpm | Tachycardia: >100 bpm

Step 2 - RHYTHM
  Is it regular? Compare all RR intervals
  P waves present? Every P followed by QRS?
  Normal sinus rhythm: Rate 60-100, regular, P before every QRS,
  PR 0.12-0.20, QRS <0.12

Step 3 - P WAVE
  Present? Morphology? Axis?
  Normal: upright in I, II; inverted in aVR
  Abnormal P: PAC, flutter waves, fibrillation

Step 4 - PR INTERVAL
  Normal: 0.12-0.20 sec
  Short: WPW, junctional rhythm
  Long: 1st degree AV block

Step 5 - QRS WIDTH
  Normal: <0.12 sec
  Wide (≥0.12): LBBB, RBBB, WPW, hyperkalemia, PVC

Step 6 - AXIS
  Normal: -30° to +90°
  LAD: -30° to -90° (LVH, LBBB, LAFB)
  RAD: +90° to +180° (RVH, LPFB, PE, dextrocardia)

Step 7 - ST/T CHANGES
  ST elevation (STE): STEMI, Pericarditis (saddle-shaped, diffuse), BER, LVAneurysm
  ST depression: NSTEMI/UA, posterior MI (reciprocal), digoxin effect, LVH strain
  T wave changes: Inversion, hyperacute (peaked), biphasic

Step 8 - QT INTERVAL
  Calculate QTc using Bazett's formula
  Prolonged QTc: electrolyte issues, drugs, congenital LQTS
2.5 AXIS DETERMINATION
Quick Method (Leads I and aVF)
| Lead I | Lead aVF | Axis |
|---|---|---|
| Positive (+) | Positive (+) | Normal (0° to +90°) |
| Positive (+) | Negative (-) | Left axis deviation (LAD) |
| Negative (-) | Positive (+) | Right axis deviation (RAD) |
| Negative (-) | Negative (-) | Extreme RAD/"Northwest" axis |
Causes of Axis Deviation
2.6 BUNDLE BRANCH BLOCKS
Right Bundle Branch Block (RBBB)
- QRS ≥ 0.12 sec
- RSR' in V1 ("rabbit ears" or "M-shaped" in V1)
- Wide, slurred S in I, V5, V6
- Secondary T-wave inversion in V1-V3
Left Bundle Branch Block (LBBB)
- QRS ≥ 0.12 sec
- Broad, notched (M-shaped) R in I, aVL, V5, V6 (no Q in these leads)
- Deep QS or rS in V1-V3
- Secondary ST and T-wave changes (discordant - opposite to QRS direction)
- ST elevation ≥1 mm concordant with QRS: 5 points
- ST depression ≥1 mm in V1-V3: 3 points
- ST elevation ≥5 mm discordant with QRS: 2 points
- ≥3 points = high specificity for MI
Fascicular Blocks (Hemiblocks)
- LAFB (Left Anterior Fascicular Block): LAD (-45° to -90°), qR in I/aVL, rS in II/III/aVF, QRS <0.12
- LPFB (Left Posterior Fascicular Block): RAD (+90° to +180°), rS in I/aVL, qR in II/III/aVF (diagnosis of exclusion)
- Bifascicular Block: RBBB + LAFB (most common); suggests significant conduction disease
2.7 CHAMBER ENLARGEMENT ON ECG
Left Atrial Enlargement (LAE) / P-mitrale
- P wave >0.12 sec (broad) in II
- Biphasic P in V1 with terminal negative component >0.04 sec × 1 mm deep
- Causes: Mitral stenosis, LV failure, hypertension
Right Atrial Enlargement (RAE) / P-pulmonale
- Peaked P wave >2.5 mm in II, III, aVF
- Causes: Pulmonary hypertension, COPD, tricuspid stenosis
Left Ventricular Hypertrophy (LVH)
- S in V1 + R in V5 or V6 ≥ 35 mm OR R in aVL ≥ 11 mm
- Men: S(V3) + R(aVL) > 28 mm
- Women: S(V3) + R(aVL) > 20 mm
Right Ventricular Hypertrophy (RVH)
- RAD + dominant R in V1 (R > S in V1)
- R in V1 ≥ 7 mm
- ST depression + T-wave inversion in V1-V3 (right-sided strain)
2.8 ISCHEMIA & INFARCTION
The Ischemic Cascade
Ischemia onset
  → Diastolic dysfunction (first to occur, seen on Echo)
  → Wall motion abnormality (RWMA on Echo)
  → ECG changes (ST/T changes)
  → Symptoms (chest pain, last to appear)
  → Necrosis → Enzyme rise
STEMI - ST Elevation MI
- New ST elevation at J-point in ≥2 contiguous leads:
- ≥2 mm in V1-V3 (men), ≥1.5 mm in V1-V3 (women)
- ≥1 mm in all other leads
- OR new LBBB with chest pain
Minutes:    Hyperacute T waves (tall, peaked, symmetric)
Hours:      ST elevation, Q wave begins
Hours-days: T-wave inversion develops
Days:       Q waves deepen, ST normalizes
Weeks-months: T-wave may normalize; Q waves usually persist (scar)
STEMI Localization by ECG
| Leads with STE | Territory | Culprit Vessel | Reciprocal Changes |
|---|---|---|---|
| II, III, aVF | Inferior | RCA (80%), LCx (20%) | I, aVL |
| V1-V4 | Anterior | LAD | II, III, aVF |
| V1-V2 | Septal | LAD (septal branch) | - |
| I, aVL, V5-V6 | Lateral | LCx or diagonal | II, III, aVF |
| V1-V4 + II,III,aVF | Extensive anterior | Left main or proximal LAD | - |
| V1 ST dep + V7-V9 STE | Posterior | RCA or LCx | - |
| V1 + right-sided leads | RV infarct | Proximal RCA | - |
NSTEMI / Unstable Angina
- ST depression ≥0.5 mm in ≥2 contiguous leads
- T-wave inversion ≥1 mm (symmetric, deep)
- No ST elevation, no new LBBB
- Distinguished from UA by troponin rise
2.9 ARRHYTHMIAS
SUPRAVENTRICULAR ARRHYTHMIAS
Sinus Arrhythmia
- Normal variant - HR varies with respiration (faster on inspiration)
- Same P morphology, just varying RR intervals
Premature Atrial Complexes (PACs)
- Early P wave with different morphology
- Usually narrow QRS (unless aberrant conduction)
- Compensatory pause may follow
Atrial Fibrillation (AF)
- Irregularly irregular rhythm - no discernible P waves
- Fibrillatory baseline (coarse or fine)
- Ventricular rate typically 100-160 bpm if uncontrolled
- QRS is narrow (unless aberrant conduction or WPW)
- Classification: Paroxysmal (<7 days, self-terminating), Persistent (>7 days), Long-standing persistent (>12 months), Permanent
- CHA2DS2-VASc score determines anticoagulation need
Atrial Flutter
- Regular sawtooth flutter waves at ~300 bpm (F waves)
- Typical (cavotricuspid isthmus-dependent): negative flutter waves in II, III, aVF at 300 bpm
- Usually 2:1 block → ventricular rate ~150 bpm (IMPORTANT: regular tachycardia at 150 = suspect flutter until proven otherwise)
- Classic appearance: "picket fence" in inferior leads
SVT (AVNRT / AVRT)
- AVNRT (AV Nodal Reentrant Tachycardia): Most common SVT
- Heart rate 150-250 bpm, narrow QRS
- P waves buried in or just after QRS (retrograde)
- "Pseudo-R' in V1" or "pseudo-S in II" (retrograde P distorting the QRS end)
- AVRT (AV Reentrant Tachycardia): Accessory pathway (WPW)
- Orthodromic: narrow QRS, retrograde P after QRS
- Antidromic: wide QRS (accessory pathway conduction)
WPW (Wolff-Parkinson-White)
- Pre-excitation on resting ECG:
- Short PR (<0.12 sec)
- Delta wave (slurred upstroke of QRS)
- Wide QRS
- Delta wave polarity helps localize pathway
- Risk: AF with rapid conduction via accessory pathway → VF → SCD
- Avoid: AV nodal blockers (adenosine, verapamil, digoxin) in AF with WPW! → can cause rapid conduction down accessory pathway
AV BLOCKS
| Block | PR Interval | Dropped Beats | QRS |
|---|---|---|---|
| 1st Degree | Fixed >0.20 sec | None | Normal |
| 2nd Degree - Mobitz I (Wenckebach) | Progressive prolongation | Occasional drop | Normal (above bundle of His) |
| 2nd Degree - Mobitz II | Fixed PR | Sudden drop (no warning) | Often wide (below bundle of His) |
| 3rd Degree (Complete) | No relationship | All dissociated | Wide (ventricular escape) |
- Mobitz I (Wenckebach): PR gets longer and longer until a beat is dropped, then resets. Usually AV node level, often reversible. "Longer, longer, longer, DROP - then you have a Wenckebach."
- Mobitz II: Fixed PR, sudden dropped beat. Below the bundle of His. Often progresses to complete block. Pacemaker indicated.
- 3rd Degree / Complete AV Block: P waves and QRS are completely independent. Ventricular escape rhythm (wide, slow). Emergency pacemaker needed.
VENTRICULAR ARRHYTHMIAS
Premature Ventricular Complexes (PVCs)
- Early, wide (≥0.12), bizarre QRS
- No P wave before PVC
- Full compensatory pause (sinus node not reset)
- Bigeminy (every other beat), Trigeminy, Couplets (2 in a row)
- Concerning: >10,000/24h, runs of VT, R-on-T
Ventricular Tachycardia (VT)
- ≥3 consecutive PVCs at rate >100 bpm
- Wide QRS (≥0.12 sec), regular, rate 100-250 bpm
- Sustained VT: >30 sec (or causing hemodynamic compromise)
- Non-sustained VT (NSVT): <30 sec
- If uncertain VT vs SVT with aberrancy: Use Brugada algorithm or treat as VT (safer!)
- AV dissociation (independent P waves - gold standard)
- Fusion beats (narrower QRS from partial sinus capture)
- Capture beats (fully normal QRS)
- QRS ≥0.16 sec
- Concordance in precordial leads (all positive or all negative)
- Northwest axis
- History of prior MI (most important)
Ventricular Fibrillation (VF)
- Completely chaotic, no organized QRS
- No effective cardiac output → immediate CPR + defibrillation
- Common in STEMI, hyperkalemia, hypothermia, Long QT
Torsades de Pointes (TdP)
- Polymorphic VT with rotating QRS axis around baseline
- Occurs with prolonged QTc
- Triggered by: Hypokalemia, hypomagnesemia, bradycardia (pause-dependent), drugs (Class IA, III, antimicrobials, antipsychotics)
- Treatment: IV magnesium sulfate, correct electrolytes, accelerate rate (isoproterenol/pacing)
2.10 ELECTROLYTE DISTURBANCES ON ECG
Hyperkalemia (progressive changes with rising K+)
K+ 5.5-6.5: Tall, peaked (tented) T waves (earliest sign)
K+ 6.5-7.0: PR prolongation, P-wave flattening/disappearance
K+ 7.0-8.0: QRS widening (sine wave pattern)
K+ >8.0:   Ventricular fibrillation/asystole
Hypokalemia
- ST depression, flattening of T waves
- Prominent U waves (U > T in same lead)
- Apparent QT prolongation (actually QU prolongation)
- PVCs, increased risk of TdP
Hypercalcemia
- Short QT interval (↓ plateau phase)
Hypocalcemia
- Long QT interval (prolonged ST segment)
2.11 OTHER IMPORTANT ECG PATTERNS
Brugada Syndrome
- Type 1 (Diagnostic): Coved ST elevation ≥2 mm + T-wave inversion in ≥1 of V1-V3 (spontaneous or after Na-channel blocker)
- Type 2: Saddle-back pattern (not diagnostic alone)
- Risk of VF and SCD in structurally normal heart
- Autosomal dominant SCN5A mutation (Na-channel)
- Treatment: ICD
Early Repolarization
- ST elevation (J-point elevation) at end of QRS, typically in lateral (V4-V6) leads
- Notching or slurring of terminal QRS
- Generally benign but associated with VF in rare cases (malignant early repolarization)
Pericarditis
- Diffuse (saddle-shaped) ST elevation in most leads except aVR and V1 (which have ST depression)
- PR depression (most specific sign) - opposite of ST change
- Evolves in 4 stages:
- Stage 1: Diffuse STE + PR depression
- Stage 2: STE normalizes, T flattens
- Stage 3: T-wave inversion
- Stage 4: ECG normalizes
Pulmonary Embolism (PE) ECG Signs
- Sinus tachycardia (most common)
- S1Q3T3: S wave in lead I, Q wave + T-wave inversion in lead III
- New RBBB
- T-wave inversion in V1-V4 (right heart strain)
- RAD
Digitalis (Digoxin) Effect
- "Reverse-tick" or "scooped" ST depression in lateral leads (I, aVL, V5, V6)
- PR prolongation, shortened QT
- Not toxicity (toxicity = all arrhythmias possible)
Hypothermia
- Osborn wave (J wave): Positive deflection at J-point (end of QRS)
- Sinus bradycardia → AF → VF at <28°C
PART 3: TREADMILL TEST (TMT) / EXERCISE STRESS TEST
3.1 BASICS OF TMT
What is TMT?
Principles
- Myocardial O2 demand is proportional to Rate-Pressure Product (RPP) = HR × systolic BP
- At peak exercise, blood flow must increase 5-6x via coronary vasodilatation
- In CAD: coronary reserve is limited → ischemia develops → ECG, hemodynamic, and symptomatic changes
Indications
- Diagnosis of CAD (intermediate pre-test probability patients)
- Assessment of known CAD severity
- Post-MI risk stratification (submaximal test at 4-6 days or maximal at 4-6 weeks)
- Evaluation of exercise-induced arrhythmias
- Assessment of exercise capacity for functional evaluation
- Pre-operative assessment
- Evaluation of treatment (drug/revascularization) efficacy
Contraindications
- Acute MI (within 2 days)
- High-risk UA (resting STE, hemodynamic instability)
- Uncontrolled cardiac arrhythmias causing hemodynamic compromise
- Symptomatic severe aortic stenosis
- Uncontrolled symptomatic heart failure
- Acute PE or DVT
- Acute myocarditis/pericarditis/endocarditis
- Acute aortic dissection
- Left main coronary disease
- Significant electrolyte abnormalities
- Severe hypertension (>200/110 mmHg at rest)
- Known LBBB (cannot assess for ischemia)
- Hypertrophic obstructive cardiomyopathy
- Severe valvular disease
3.2 PROTOCOLS
Bruce Protocol (Most Common)
| Stage | Duration | Speed (mph) | Grade (%) | METs |
|---|---|---|---|---|
| 1 | 3 min | 1.7 | 10 | 4-5 |
| 2 | 3 min | 2.5 | 12 | 7 |
| 3 | 3 min | 3.4 | 14 | 10 |
| 4 | 3 min | 4.2 | 16 | 13 |
| 5 | 3 min | 5.0 | 18 | 16-17 |
- Modified Bruce Protocol: Starts with 2 warm-up stages at lower speeds (used in elderly, post-MI, low fitness)
- MET (Metabolic Equivalent): 1 MET = 3.5 mL O2/kg/min (resting O2 consumption)
- Good prognosis: ≥10 METs; Poor prognosis: <5 METs
Target Heart Rate
- Maximum predicted HR (MPHR) = 220 - age
- Diagnostic test: Achieve ≥85% MPHR for adequate sensitivity
- Submaximal (post-MI): Target 70% MPHR or 120 bpm
3.3 TEST CONDUCT & MONITORING
Pre-Test
- 12-lead resting ECG
- Baseline BP
- Hold: Beta-blockers (blunt HR response) - discuss with physician before stopping
- Informed consent; IV access available; crash cart present
During Test (Continuous monitoring)
- ECG monitored continuously
- BP every stage
- Symptoms assessed every stage (chest pain, dyspnea, fatigue - rate on Borg scale)
- 12-lead ECG printed at peak of each stage
Reasons to Stop the Test
- ST elevation (≥1 mm) in leads without Q waves (non-V1/aVR)
- Drop in systolic BP >10 mmHg from baseline despite ↑ workload + other evidence of ischemia
- Moderate-severe angina (Grade 2-4)
- Increasing nervous system symptoms (ataxia, dizziness, near-syncope)
- Signs of poor perfusion (cyanosis, pallor)
- Technical difficulties monitoring ECG/BP
- Patient's desire to stop
- Sustained VT
- ST elevation ≥2 mm in leads with Q waves (if no ischemic ST changes in non-Q leads)
- ST depression >2 mm
- Increasing chest pain
- Fatigue, dyspnea, wheezing, claudication
- Hypertensive response (SBP >250 mmHg, DBP >115 mmHg)
- Target HR achieved in asymptomatic patient
3.4 ECG CHANGES DURING TMT
Positive Test for Ischemia
- Horizontal or downsloping ST depression ≥1 mm (0.1 mV) at 60-80 ms after J-point in ≥1 lead
- Persisting for ≥3 consecutive beats
- Reproducible in ≥2 consecutive leads
- ST elevation ≥1 mm (indicates transmural ischemia or spasm - more severe)
- Typical angina during the test
- Exercise-induced VT or significant arrhythmias
High-Risk Features on TMT
- Test positive in Stage 1 (<5 METs) or at HR <120 bpm
- Extensive ST depression (≥2 mm), multiple leads
- Downsloping ST depression
- ST depression lasting >5 minutes into recovery
- Failure to achieve 85% MPHR (chronotropic incompetence)
- Sustained VT or VF
- Drop in BP >10 mmHg with exercise
- ST elevation (non-Qwave leads)
Duke Treadmill Score (DTS)
| Score | Risk | Annual Mortality |
|---|---|---|
| ≥+5 | Low | 0.25% |
| -10 to +4 | Moderate | 1.25% |
| ≤-11 | High | 5.25% |
3.5 BLOOD PRESSURE RESPONSE
- Normal: SBP should increase with exercise (~10 mmHg per MET)
- Hypertensive response: SBP >250 mmHg or DBP >115 mmHg during exercise → stop test
- Hypotensive response (exertional hypotension): SBP drops ≥10 mmHg below baseline → severe ischemia, LV dysfunction, severe AS, hypertrophic cardiomyopathy (very concerning finding)
3.6 TMT REPORT INTERPRETATION
Key Elements of TMT Report
- Pre-test ECG findings
- Protocol used and stages completed
- Maximum HR achieved (% of MPHR)
- Maximum BP achieved
- METs achieved
- ECG changes during exercise and recovery
- Symptoms during test
- Duke Treadmill Score
- Reason for stopping
- Overall interpretation: Positive / Negative / Non-diagnostic
False Positives (ST changes without obstructive CAD)
- LVH with strain pattern
- LBBB, WPW, digoxin effect
- Electrolyte abnormalities
- Hypertension
- Women (higher rate of false positives ~15-20%)
- Mitral valve prolapse
- Vasospastic angina (Prinzmetal)
False Negatives
- Inadequate exercise (failure to achieve 85% MPHR)
- Anti-anginal medications (beta-blockers, nitrates, Ca-blockers)
- Single-vessel disease (low sensitivity ~60-70%)
- Well-developed collateral circulation
Sensitivity and Specificity
- Standard TMT: Sensitivity ~68%, Specificity ~77%
- Imaging (stress echo, nuclear): Higher diagnostic accuracy, especially in inconclusive TMT
PART 4: HOLTER MONITORING
4.1 WHAT IS HOLTER MONITORING?
4.2 TYPES OF AMBULATORY ECG MONITORING
| Device | Duration | Indication |
|---|---|---|
| Standard Holter | 24-48 hours | Frequent symptoms (daily) |
| Extended Holter | 7-14 days | Less frequent symptoms |
| Event recorder | 30 days | Patient-triggered when symptomatic |
| Loop recorder | 30 days (external) / 3 years (implantable - ILR) | Rare, unexplained syncope |
| Patch monitor | 7-14 days | More comfortable than traditional Holter |
4.3 INDICATIONS FOR HOLTER MONITORING
- Palpitations: Detect arrhythmia, correlate with symptoms
- Unexplained syncope or pre-syncope: Rule out arrhythmic cause (Stokes-Adams attacks)
- Unexplained dizziness or lightheadedness
- Known arrhythmia monitoring: Follow-up of AF, assessment of PVC burden
- Evaluation of anti-arrhythmic drug therapy: Efficacy or proarrhythmic effects
- Post-MI risk stratification: NSVT detection
- Evaluation of pacemaker function
- Sleep apnea-related bradycardia or arrhythmia
- Cryptogenic stroke: Detection of paroxysmal AF (AF detected in ~15-25% of cryptogenic stroke patients on prolonged monitoring)
- Heart rate variability (HRV) analysis: Autonomic assessment in HF, post-MI
4.4 HOW HOLTER IS REPORTED
Key Parameters Analyzed
- Heart Rate: Mean, minimum, maximum; HR over 24 hours
- Rhythm Analysis:
- Total beats; supraventricular beats; ventricular beats
- AF burden (% of time in AF)
- Number of PVCs (normal <500/day or <1% of total beats)
- PVC morphology (unifocal vs multifocal), couplets, runs
- PACs
- Pauses: Any pause >2.0 sec (daytime) or >2.5 sec (sleep) is notable; >3 sec = significant
- ST Analysis: Horizontal ST changes that correlate with symptoms or activity
- QT/QTc Monitoring: Drug therapy monitoring
- Symptom Correlation: Patient diary + timing of symptoms vs ECG findings
Holter Interpretation Key Points
- <1000 PVCs/24h: Usually benign
-
10,000 PVCs/24h OR >20-25% of total beats: Risk of PVC-induced cardiomyopathy
- PVC-induced cardiomyopathy is reversible with treatment (ablation or medication)
- Sustained VT (>30 sec): Emergency evaluation
- NSVT (3-30 beats at >100 bpm): Risk stratify based on clinical context
- Complete AV block with slow escape: Pacemaker indication
- Sinus pauses >3 sec: Pacemaker consideration
- Paroxysmal AF: Anticoagulation if CHA2DS2-VASc ≥2 (men) or ≥3 (women)
- Reflects autonomic tone (balance of sympathetic vs parasympathetic)
- Low HRV post-MI = higher mortality risk
- SDNN (standard deviation of all RR intervals): Normal >100 ms; <50 ms = significantly reduced
- rMSSD: Short-term HRV; reflects vagal tone
4.5 SPECIAL CONSIDERATIONS
Cryptogenic Stroke and AF Detection
- Standard 12-lead ECG detects AF in ~2.7% of stroke patients
- 24-72h Holter: ~4-7%
- 30-day external: ~15%
- Implantable loop recorder (3 years): ~25-30% (CRYSTAL-AF trial)
- Implication: Detect AF → start anticoagulation → prevent recurrent embolic stroke
Implantable Loop Recorder (ILR)
- Small subcutaneous device implanted under the skin (left precordial area)
- Battery lasts ~3 years
- Auto-triggers on detection of bradycardia, tachycardia, or AF
- Patient-activated trigger with a handheld device
- Gold standard for unexplained syncope investigation
PART 5: ECHOCARDIOGRAPHY MASTER CLASS
5.1 PRINCIPLES OF ECHOCARDIOGRAPHY
Ultrasound Physics Basics
- Ultrasound: Sound waves >20 kHz; cardiac echo uses 1-10 MHz
- Frequency vs Penetration:
- Higher frequency = better resolution but less penetration
- Lower frequency = better penetration but lower resolution
- Standard adult echo: 2.5-3.5 MHz; pediatric/superficial: up to 7.5 MHz
- Wavelength: λ = c/f, where c = 1540 m/s (speed in tissue)
- Piezoelectric crystals in transducer: convert electrical energy to sound and back
Key Ultrasound Interactions with Tissue
| Interaction | Effect |
|---|---|
| Reflection | Creates the echo signal (depends on acoustic impedance mismatch) |
| Refraction | Bending at tissue interfaces |
| Attenuation | Signal weakens with depth (amplified by TGC - time gain compensation) |
| Scatter | Reflection in multiple directions (from blood cells = Doppler signal) |
5.2 IMAGING MODALITIES IN ECHO
2D Echocardiography
- Real-time 2D cross-sections of the heart
- Most information comes from 2D imaging
- Sector-shaped image, up to 30-90 frames/sec
M-Mode
- Motion-mode: narrow ultrasound beam, very high temporal resolution
- Produces a "time-motion" display of one line through the heart
- Uses: Precise measurement of chamber dimensions, valvular motion
- Reference structures: LV dimensions (LVEDD, LVESD), aortic root, LA size
Doppler Echocardiography
| Type | Principle | Use |
|---|---|---|
| Pulsed Wave (PW) | Samples at specific depth; limited max velocity (Nyquist limit) | Low-velocity flow (mitral E/A, LVOT) |
| Continuous Wave (CW) | Measures all velocities along entire beam; no depth specificity | High-velocity jets (AS, AR, MR, TR) |
| Color Doppler | 2D display of flow direction + velocity; red = toward, blue = away | Valve regurgitation, shunts, stenosis |
| Tissue Doppler (TDI) | Measures myocardial velocity (low velocity, high amplitude) | Diastolic function (e', s'), pericarditis |
Doppler Physics - Key Equations
- Doppler equation: Δf = (2 × f₀ × v × cosθ) / c
- Δf = Doppler frequency shift; v = blood velocity; θ = angle (must be <20° for accuracy)
- Simplified Bernoulli equation: ΔP = 4v²
- ΔP = pressure gradient (mmHg); v = peak velocity (m/s)
- Example: Aortic stenosis jet = 4 m/s → ΔP = 4×16 = 64 mmHg
5.3 STANDARD ECHO VIEWS
Transthoracic Echo (TTE) Standard Windows
1. Parasternal Long Axis (PLAX)
   - LV, LA, mitral valve, aortic valve, aortic root
   - Measure: LVEDD, LVESD, aortic root, LA size, IVS, posterior wall

2. Parasternal Short Axis (PSAX)
   - Multiple levels: aortic valve level, mitral valve level, papillary muscle level, apical
   - AV level: aortic valve (tricuspid semilunar leaflets), LA, RA, RV, pulmonary artery, RVOT
   - MV level: Mitral "fish-mouth" appearance; PMC (mitral commissurotomy score)

3. Apical 4-Chamber (A4C)
   - All 4 chambers simultaneously
   - Mitral and tricuspid valves
   - Assess: LA/RA size, LV/RV function, wall motion, RV/LV size ratio
   - Normal: RV < LV in size; if RV ≥ LV → RV overload/dilation

4. Apical 2-Chamber (A2C)
   - LV + LA, no RV
   - Inferior and anterior wall assessment

5. Apical 3-Chamber (A3C) / Apical Long Axis
   - LV, LA, LVOT, aortic valve
   - Same as PLAX but from apex

6. Subcostal
   - Excellent for RV, IVC, pericardial effusion
   - IVC measurement for volume status

7. Suprasternal
   - Aortic arch, descending aorta, branch vessels
5.4 LV SYSTOLIC FUNCTION
Ejection Fraction (EF)
- Definition: EF = (EDV - ESV) / EDV × 100% = SV/EDV × 100%
- Normal: ≥55% (≥52% by some guidelines)
- Methods: Visual (eyeballing), Linear (M-mode), Biplane Simpson's (most accurate by 2D)
Simpson's Method of Discs (Biplane)
- Recommended by ASE guidelines
- Traces the endocardial border in A4C and A2C views at end-diastole and end-systole
- Software divides LV into discs, sums volumes
EF Classification
| EF | Category |
|---|---|
| ≥55% (or ≥52% by some) | Normal |
| 41-49% | Mid-range (HFmrEF) |
| ≤40% | Reduced (HFrEF) |
| ≤35% | ICD threshold for primary prevention |
| ≤30% | High-risk for SCD |
Wall Motion Analysis
- Each segment is scored:
- 1 = Normal
- 2 = Hypokinetic (reduced motion)
- 3 = Akinetic (no motion)
- 4 = Dyskinetic (paradoxical/bulging)
- 5 = Aneurysmal
- Wall Motion Score Index (WMSI) = Sum of scores / Number of segments
- Normal WMSI = 1.0; WMSI >1 = dysfunction present
17-Segment Model (AHA)
- Basal (6 segments): anterior, anteroseptal, inferoseptal, inferior, inferolateral, anterolateral
- Mid (6 segments): same divisions
- Apical (4 segments): anterior, septal, inferior, lateral
- Apex cap (1 segment)
5.5 LV DIASTOLIC FUNCTION
Importance
- Diastolic dysfunction is often the earliest sign of cardiac disease
- Heart Failure with Preserved EF (HFpEF) is entirely a diagnosis of diastolic dysfunction
Diastolic Function Parameters
Mitral Inflow (PW Doppler at mitral tips)
- E wave: Early passive filling velocity (normal 60-100 cm/s)
- A wave: Late filling during atrial contraction (normal 40-80 cm/s)
- E/A ratio: Normal 0.8-2.0 (young adults); lower with age; normal E/A may actually represent pseudonormal (Grade II)
- DT (Deceleration time): Time from E peak to baseline; normal 150-220 ms
Tissue Doppler (TDI) at Mitral Annulus
- e' (early diastolic velocity): Reflects myocardial relaxation
- Lateral annulus e' ≥10 cm/s = normal
- Septal annulus e' ≥7 cm/s = normal
- E/e' ratio: Estimates LV filling pressure (LVEDP)
- E/e' <8 = normal filling pressure
- E/e' >14 = elevated filling pressure (pulmonary congestion)
- E/e' 8-14 = intermediate (use other parameters)
ASE 2016 Diastolic Grading
| Grade | Description | E/A | DT | e' | E/e' | TR velocity | LA volume |
|---|---|---|---|---|---|---|---|
| Normal | - | 0.8-2.0 | 150-220 | Normal | <8 | <2.8 m/s | ≤34 mL/m² |
| Grade I | Impaired relaxation | <0.8 | >220 | ↓ | <8 | <2.8 | ≤34 |
| Grade II | Pseudonormal | 0.8-2.0 | 150-220 | ↓ | 8-14 | ≥2.8 | >34 |
| Grade III | Restrictive | >2.0 | <150 | ↓ | >14 | ≥2.8 | >34 |
5.6 VALVE ASSESSMENT
Aortic Stenosis (AS) Severity
| Parameter | Mild | Moderate | Severe |
|---|---|---|---|
| Peak velocity (m/s) | <3.0 | 3.0-4.0 | ≥4.0 |
| Mean gradient (mmHg) | <25 | 25-40 | ≥40 |
| Aortic Valve Area (AVA) cm² | >1.5 | 1.0-1.5 | <1.0 |
| AVA indexed (cm²/m²) | >0.85 | 0.6-0.85 | <0.6 |
Mitral Stenosis (MS) Severity
- Pressure Half-Time (PHT) method: MVA = 220 / PHT(ms)
- Normal MVA = 4-6 cm²
- Severe MS: MVA <1.0 cm² (critical: <0.6 cm²)
- Mean gradient: Mild <5 mmHg, Moderate 5-10, Severe >10 mmHg
- Wilkins Score (for suitability of balloon mitral commissurotomy - BMC):
- 4 parameters (each 0-4): Leaflet mobility, leaflet thickening, calcification, subvalvular thickening
- Score ≤8 = good candidate for BMC
Aortic Regurgitation (AR) Assessment
- Jet width / LVOT width ratio: Mild <25%, Moderate 25-65%, Severe ≥65%
- Vena contracta (narrowest jet diameter): Severe ≥0.6 cm
- Pressure half-time: Severe AR has rapid pressure equalization → short PHT (<200 ms)
- Diastolic flow reversal in descending aorta: Pan-diastolic reversal = severe AR
Mitral Regurgitation (MR) Assessment
- PISA method (Proximal Isovelocity Surface Area):
- Effective Regurgitant Orifice Area (EROA) ≥0.4 cm² = severe MR
- Regurgitant Volume ≥60 mL = severe MR
- Regurgitant Fraction ≥50% = severe MR
- Vena contracta: ≥0.7 cm = severe MR
- Color Doppler: Severe if jet reaches the back of LA
Pulmonary Artery Pressure Estimation
- PASP (Pulmonary Artery Systolic Pressure) = 4(V_TR)² + RAP
- V_TR = peak TR velocity; RAP estimated from IVC
- Normal PASP <35 mmHg; Pulmonary hypertension if ≥40 mmHg
- RAP estimation: IVC <2.1 cm + >50% collapse = RAP 3 mmHg; IVC >2.1 + <50% collapse = RAP 15 mmHg
5.7 RIGHT HEART ASSESSMENT
RV Function
- Normal: RV is smaller than LV, crescent-shaped
- RV dilation (RV ≥ LV in A4C view) = significant pathology (PE, PHTN, RVMI)
- TAPSE (Tricuspid Annular Plane Systolic Excursion): M-mode at tricuspid annulus
- Normal: ≥17 mm; <17 mm = RV dysfunction
- FAC (Fractional Area Change): (RV EDA - RV ESA) / RV EDA × 100%; Normal ≥35%
- S' (TDI at tricuspid annulus): Normal ≥9.5 cm/s
IVC and Volume Status
- IVC diameter and collapsibility index used to estimate RAP and volume status
- Small IVC (<1.5 cm) that collapses >50% = hypovolemia
- Dilated IVC (>2.1 cm) with <50% collapse = elevated RAP = volume overload / RHF
5.8 PERICARDIAL EFFUSION AND TAMPONADE
Pericardial Effusion
- Detected as echo-free space around the heart
- Grading:
- Small: <0.5 cm (posterior only)
- Moderate: 0.5-2.0 cm (circumferential)
- Large: >2.0 cm
Cardiac Tamponade (Echo Signs)
- Large pericardial effusion
- RA free wall collapse (during systole, lasts >1/3 of cardiac cycle) - most sensitive
- RV free wall collapse (during diastole) - more specific
- IVC dilation (>2.1 cm) with <50% collapse = elevated RAP
- Exaggerated respiratory variation in mitral inflow >30% (or tricuspid E wave >40%) - echo equivalent of pulsus paradoxus
5.9 STRESS ECHOCARDIOGRAPHY
Principle
- Add imaging to stress test → directly visualize wall motion abnormalities (WMA)
- WMA appears earlier in ischemia cascade than ECG changes
- Uses: Dobutamine stress echo (DSE) or exercise echo
Dobutamine Stress Echo (DSE)
- Protocol: Start at 5-10 μg/kg/min, increase every 3 min to 20, 30, 40 μg/kg/min
- Atropine added if target HR not achieved
- Interpreting:
- Normal: All segments become hyperdynamic with stress
- Ischemia: New WMA or worsening WMA at stress (not present at rest)
- Viability (hibernating myocardium): Improvement at low-dose dobutamine, then worsening at high dose ("biphasic response") = stunned/hibernating, likely to benefit from revascularization
- Fixed defect (scar): No response to dobutamine at any dose
Advantages Over TMT
- Can diagnose when ECG is non-interpretable (LBBB, LVH, WPW, pacemaker)
- Higher sensitivity and specificity (~80-85% vs ~68-77%)
- Provides additional structural and functional information
- Can be used in patients unable to exercise
5.10 TRANSESOPHAGEAL ECHO (TEE)
When TEE is Used (Superior to TTE)
- Poor acoustic window in TTE
- Suspected endocarditis (vegetation detection - sensitivity 90-95% for TEE vs 60-70% for TTE)
- Atrial thrombus before cardioversion of AF (LA appendage - not visualized by TTE)
- Aortic dissection
- Complex valvular surgery planning
- Intraoperative cardiac surgery monitoring
SUMMARY COMPARISON TABLE: KEY INVESTIGATIONS
| Investigation | Primary Use | Key Positive Finding | Limitation |
|---|---|---|---|
| 12-lead ECG | Rhythm, ischemia, conduction | STE, new LBBB | Static snapshot; may be normal in ischemia |
| TMT | Diagnose CAD, risk stratify | ≥1 mm downsloping ST depression | Cannot use in LBBB, WPW; poor specificity in women |
| Holter | Arrhythmia detection | PVC burden, AF episodes, pauses | Only 24-48h window (standard) |
| TTE | Structure and function | EF, WMA, valve disease, PASP | Limited by acoustic window |
| Stress Echo | Ischemia with imaging | New/worsening WMA with stress | Operator dependent |
| TEE | Better resolution | Thrombus, vegetation, dissection | Semi-invasive, requires sedation |
HIGH-YIELD MNEMONICS
- Rapid VT (sustained)
- Systolic BP drop >10 mmHg
- Ventricles - ST elevation (non-Q-wave leads)
- Patient symptoms (severe angina, syncope, pallor)
- Concordant STE ≥1 mm = 5 points
- Concordant STD ≥1 mm V1-V3 = 3 points
- Discordant STE ≥5 mm = 2 points (Score ≥3 = high likelihood of MI in LBBB)
- "Wenckebach = Wonky but harmless" (Mobitz I - usually benign)
- "Mobitz II = May need pacing immediately"
- "Complete = Call for emergency pacemaker"
What's Included - Master Class Structure
PART 1: Cardiovascular Basics (Pre-ECG Foundation)
- 1.1 Cardiac Anatomy - Chambers, layers, valves, coronary circulation with vessel territories
- 1.2 Microanatomy & E-C Coupling - Cardiomyocyte structure, sarcomere, calcium cycling, SERCA, Frank-Starling law (from Braunwald's Heart Disease)
- 1.3 Action Potential & Conduction System - 5 phases, pacemaker AP, SA→AV→His→Bundle→Purkinje pathway with speeds
- 1.4 The Cardiac Cycle - All phases of systole and diastole, pressure values, heart sounds, key formulas (CO, EF, preload, afterload)
- 1.5 Autonomic Control - Sympathetic (chronotropy, inotropy, dromotropy) and parasympathetic effects
- 1.6 Pre-ECG Electrophysiology - Ion channel table, refractory periods, QT and Bazett's formula
PART 2: ECG Master Class
- 2.1-2.2 ECG basics, paper speed, the 12 leads, anatomical groupings
- 2.3 All waveforms (P, PR, QRS, ST, T, QT, U) with normal values
- 2.4 Systematic 8-step ECG interpretation method
- 2.5 Axis determination (quick I + aVF method + causes)
- 2.6 RBBB, LBBB, Sgarbossa criteria, fascicular blocks
- 2.7 Chamber enlargement (LAE, RAE, LVH with Sokolow + Cornell, RVH)
- 2.8 Ischemia cascade, STEMI evolution and localization by territory, De Winter T waves, NSTEMI
- 2.9 Full arrhythmia section - AF, flutter, AVNRT, WPW, all AV blocks, VT, VF, Torsades
- 2.10 Electrolyte changes (hyperkalemia stages, hypokalemia, Ca)
- 2.11 Brugada, pericarditis (4 stages), PE (S1Q3T3), digoxin effect, hypothermia Osborn waves
PART 3: TMT / Exercise Stress Test
- Indications, absolute and relative contraindications
- Bruce Protocol table with METs, modified protocol
- Target HR calculation, test conduct, monitoring
- Stopping criteria (absolute and relative)
- Positive criteria for ischemia, high-risk features
- Duke Treadmill Score formula + risk categories
- BP response, false positives, false negatives, sensitivity/specificity
PART 4: Holter Monitoring
- Types of ambulatory monitoring (24h Holter → ILR 3 years)
- All indications including cryptogenic stroke AF detection
- Interpretation parameters (PVC burden, pauses, HRV, AF burden)
- ILR and the CRYSTAL-AF trial data
PART 5: Echocardiography
- Ultrasound physics, Doppler types (PW, CW, Color, TDI) with uses
- Standard echo views (PLAX, PSAX, A4C, A2C, subcostal, suprasternal)
- LV systolic function (EF, Simpson's, wall motion 17-segment model)
- Diastolic function (E/A, e', E/e', ASE 2016 grading table)
- Valve quantification: AS (continuity equation, severity table), MS (PHT method, Wilkins score), AR, MR (PISA method) - all from Textbook of Clinical Echocardiography
- PA pressure estimation (TR jet + RAP)
- RV assessment (TAPSE, FAC, S')
- IVC and volume status
- Pericardial effusion and tamponade echo signs
- Stress echo / dobutamine echo (viability "biphasic response")
- TEE indications
More detailed analysis and information with case studies all the normal and abnormalities.
CARDIOVASCULAR MASTER CLASS - EXPANDED EDITION
Detailed Analysis, Normals, Abnormalities, and Clinical Case Studies
Sources: Braunwald's Heart Disease | Fuster's The Heart | Textbook of Clinical Echocardiography
═══════════════════════════════════
SECTION A: CARDIOVASCULAR PHYSIOLOGY - DEEP DIVE
═══════════════════════════════════
A.1 THE PRESSURE-VOLUME LOOP - UNDERSTANDING THE CARDIAC CYCLE GRAPHICALLY
Tracing a Normal P-V Loop (Counter-clockwise)
Point A - End-diastole (start):
  LV full, ~120 mL (EDV), low pressure ~8-12 mmHg
  → Mitral valve closes (S1)

Segment A→B - Isovolumic Contraction:
  Pressure rises rapidly (both valves closed)
  Volume stays CONSTANT
  Ends when LV pressure exceeds aortic pressure (~80 mmHg)

Point B - Aortic valve opens

Segment B→C - Ejection:
  Volume decreases (~50-60 mL ejected = stroke volume)
  Pressure rises to peak systolic (~120 mmHg), then falls

Point C - End-systole (top-left corner):
  Minimum volume (~50-60 mL = ESV)
  → Aortic valve closes (S2)

Segment C→D - Isovolumic Relaxation:
  Pressure drops rapidly
  Volume stays CONSTANT
  Ends when LV pressure < LA pressure

Point D - Mitral valve opens

Segment D→A - Diastolic Filling:
  Volume increases as blood flows from LA
  Pressure rises only slightly (LV compliance)
How Disease Shifts the P-V Loop
- Loop shifts right (larger ESV, larger EDV)
- Loop gets narrower (smaller stroke volume)
- EF falls (ESV increases more than EDV)
- Emax (end-systolic pressure-volume line) flattens
- Peak pressure is higher
- ESV increases (harder to empty against resistance)
- SV and EF fall
- Loop becomes taller and thinner
- EDV increases (rightward shift)
- If contractility preserved: SV maintained
- Loop gets wider
- Emax slope steepens
- ESV decreases (more complete emptying)
- SV increases for same preload
A.2 LV GEOMETRY PATTERNS - NORMAL VS ABNORMAL
- Normal RWT: <0.42
| Pattern | RWT | LV Mass | Clinical Setting |
|---|---|---|---|
| Normal | <0.42 | Normal | Healthy |
| Concentric remodeling | ≥0.42 | Normal | Early hypertension |
| Concentric hypertrophy | ≥0.42 | Increased | Hypertension, AS |
| Eccentric hypertrophy | <0.42 | Increased | Volume overload (MR, AR), DCM |
- Normal GLS = approximately -20% (negative = shortening)
- GLS -16% to -18% = mildly abnormal (may be subtle LV dysfunction before EF falls)
- GLS <-16% = significant dysfunction
- Detects subclinical cardiomyopathy (e.g., chemotherapy toxicity) before EF drops
- Speckle-tracking based, less load dependent than EF
═══════════════════════════════════
SECTION B: ECG - DETAILED ANALYSIS WITH CASE STUDIES
═══════════════════════════════════
B.1 NORMAL ECG - COMPLETE ANALYSIS
Case 1: Normal Sinus Rhythm (Baseline Reference)
Rate:      75 bpm (300/4 large boxes between R waves)
Rhythm:    Regular (all RR intervals equal)
P waves:   Upright in I, II, aVF, III; inverted aVR
           Duration 0.08 sec; amplitude 1.5 mm - NORMAL
PR interval: 0.16 sec (4 small boxes) - NORMAL
QRS:       0.08 sec (2 small boxes), narrow - NORMAL
           q in I, aVL (small septal q = normal)
Axis:      +60° (both I and aVF positive) - NORMAL
R progression: V1 rS → V3-V4 transition → V5-V6 tall R - NORMAL
ST segments: Isoelectric - NORMAL
T waves:   Upright I, II, V2-V6; inverted aVR - NORMAL
QTc:       380 ms - NORMAL
B.2 SINUS NODE ABNORMALITIES
Case 2: Sinus Bradycardia
- Rate: 44 bpm
- Regular P-QRS-T morphology - identical to normal
- PR, QRS, QTc all normal
- Normal finding in athletes: Enhanced vagal tone, enlarged stroke volume compensates
- Pathological if: Symptomatic (fatigue, syncope), in non-athlete, with medications
- Causes: Athletic training, sleep, vasovagal, hypothyroidism, hypothermia, inferior MI (RCA occlusion affecting SA node), sick sinus syndrome, beta-blockers, calcium channel blockers
Case 3: Sinus Tachycardia
- Rate: 118 bpm (sinus tachycardia)
- Normal P-QRS-T morphology
- PR may appear shorter due to rate
Physiological: Exercise, anxiety, pain, fever (+10 bpm per 1°C rise)
Cardiac:       Heart failure, tamponade, myocarditis
Pulmonary:     PE (MOST COMMON ECG finding in PE), pneumothorax
Metabolic:     Thyrotoxicosis, anemia, hypovolemia, sepsis
Drugs:         Catecholamines, atropine, caffeine, cocaine
Case 4: Sick Sinus Syndrome (SSS)
- Periods of sinus bradycardia (HR 38 bpm)
- Intermittent sinus pauses (3.4 seconds)
- Bursts of rapid atrial tachycardia (HR 140 bpm)
- Then sudden return to bradycardia
- Inappropriate sinus bradycardia
- Sinoatrial block / sinus arrest (pauses)
- Failure to increase HR with exercise (chronotropic incompetence)
- Paroxysmal SVT alternating with bradycardia
B.3 P WAVE ABNORMALITIES IN DETAIL
Normal P Wave Checklist:
- Duration: ≤0.12 sec (3 small boxes)
- Amplitude: ≤2.5 mm in II (≤1.5 mm in V1)
- Axis: 0° to +75° (upright in I, II; inverted in aVR)
- Morphology: Smooth, rounded (no notching, no peaked)
Case 5: Left Atrial Enlargement (LAE) - "P-Mitrale"
- Lead II: Broad, notched P wave ("m-shaped") duration 0.14 sec (>0.12)
- Lead V1: Biphasic P wave - initial positive component then deep terminal negative component (>1 mm deep × >40 ms wide = 1 small box × 1 small box)
- The terminal negative component in V1 = Morris index
Case 6: Right Atrial Enlargement (RAE) - "P-Pulmonale"
- Lead II: Tall, peaked (tented) P wave ≥2.5 mm
- Lead V1: Tall, narrow initial positive component of P >1.5 mm
B.4 QRS ABNORMALITIES - DETAILED
Case 7: Left Ventricular Hypertrophy (LVH) with Strain
- Sokolow-Lyon: S(V1) = 22 mm + R(V5) = 26 mm = 48 mm (>35 mm = positive)
- Cornell: R(aVL) = 14 mm + S(V3) = 18 mm = 32 mm (men >28 mm = positive)
- Strain pattern: ST depression + T-wave inversion in I, aVL, V5, V6 (asymmetric - gradual downstroke, rapid upstroke)
- Left axis deviation (-30°)
- QRS broadening to 0.10 sec (not quite LBBB but broadened)
- LAE pattern (V1 biphasic P)
Case 8: Pathological Q Waves
- Width ≥0.04 sec (1 small box)
- Depth ≥25% of the following R wave amplitude
- In ≥2 contiguous leads in the same anatomical territory
- Small (narrow <0.04 sec, <25% of R) q waves in I, aVL, V5, V6 = normal septal depolarization
- Small q in III alone = positional (normal if no Q in II)
- Deep Q waves in V1-V4 (QS pattern in V1, V2; pathological Q in V3, V4)
- T-wave inversion in V1-V5 (chronic ischemia pattern)
- No ST elevation (not acute)
- Preserved R wave in V5-V6
B.5 ST SEGMENT - DETAILED NORMAL VS ABNORMAL
Normal ST Segment
- Isoelectric (at baseline)
- Gradual transition to T wave (no sharp angles)
- Very slight ST elevation (<0.5 mm) acceptable in limb leads
- Up to 1 mm elevation in right precordial leads acceptable in young males (early repolarization)
ST Elevation - Differential Diagnosis (Critical for Boards & Practice)
| Cause | Pattern | Key Distinguishing Feature |
|---|---|---|
| STEMI | Regional (follows coronary territory) | Reciprocal ST depression |
| Pericarditis | Diffuse, all leads except aVR/V1 | PR depression; saddle-shaped; no reciprocal ST depression |
| Early Repolarization | Concave upward; V4-V6; J-point notch | Young males; benign; no evolution |
| LBBB | Secondary to conduction | Wide QRS; Sgarbossa |
| LV Aneurysm | Persistent STE weeks after MI | Old Q waves; no acute symptoms |
| Brugada | Coved/saddleback V1-V3 | No coronary territory; SCN5A |
| Prinzmetal's Angina | Transient STE; resolves | Occurs at rest; vasospasm |
| Hyperkalemia | Wide QRS + peaked T + STE | K+ >7; broad QRS; peaked T |
| Hypothermia | Osborn wave (J wave) | Low temperature |
| STEMI equivalents | DeWinter T waves, posterior MI | Know these - not classic STE |
Case 9: Acute Inferior STEMI - Full Workup
Rate: 55 bpm (bradycardia - RCA occlusion affects SA node!)
Rhythm: Sinus with 1st degree AV block (PR = 0.24 sec) - RCA supplies AV node
Leads II, III, aVF:
  - ST elevation: 3 mm in III, 2 mm in II, 2 mm in aVF (INFERIOR STEMI)
  - Q waves beginning in III (early infarction)
  - T waves hyperacute (tall, symmetric) - very early!
Leads I, aVL:
  - ST depression 2 mm (RECIPROCAL CHANGES - confirms inferior MI)
  - T-wave inversion
Lead V1:
  - Check for RV involvement (RV infarct)
  - ST elevation V1 or minimal compared to V2
Right-sided leads (V3R-V4R):
  - ST elevation ≥1 mm in V4R = RV INFARCT (positive finding here!)
- Inferior STE (II, III, aVF) + reciprocal I/aVL = Inferior STEMI
- Bradycardia + AV block = RCA culprit (>85% of AV node supplied by RCA)
- III > II elevation suggests RCA (LCx: II > III)
- V4R elevation → RV Infarct present
- Do NOT give nitrates (will cause catastrophic hypotension - RV is preload dependent!)
- Do NOT give diuretics
- Treatment: IV fluid loading to maintain preload
- This patient needs emergent PCI
Case 10: Anterior STEMI - LAD Occlusion
Rate: 100 bpm (sinus tachycardia - sympathetic activation)
V1-V4: ST elevation (V2=4mm, V3=5mm, V4=3mm, V1=2mm) - ANTERIOR STEMI
V1-V2: Loss of normal small r wave (poor R progression = early q waves forming)
II, III, aVF: Minimal ST depression (reciprocal)
aVR: ST elevation 1 mm (suggests left main or proximal LAD occlusion - very high-risk)
- V1-V4 = anterior wall + septum = LAD territory
- aVR elevation = suggests Left Main or very proximal LAD
- Cardiogenic shock (large muscle territory)
- Acute MR (anterior papillary muscle ischemia)
- VSD (septal rupture)
- Complete AV block (septal branch occlusion)
- VF (most common cause of pre-hospital death in MI)
Case 11: De Winter T-Wave Pattern (STEMI Equivalent - Must Not Miss!)
- V1-V5: Upsloping ST depression at J point (1-3 mm below baseline)
- V1-V5: Tall, symmetric, peaked T waves (hyperacute T-waves)
- aVR: ST elevation
- NO classic ST elevation in precordial leads
- Represents proximal LAD occlusion
- Found in ~2% of LADs
- These patients need emergent PCI just like classic anterior STEMI
- Missing this = fatal mistake
Case 12: Posterior MI (STEMI but Looks Like ST Depression!)
- Leads V1-V2: ST depression (≥2 mm) - looks like NSTEMI
- Leads V1-V2: Tall, broad R waves (R/S ratio >1 in V1)
- Leads V1-V2: Upright T waves (in context of ST depression)
- V7: Posterior axillary line
- V8: Angle of scapula
- V9: Left paravertebral
- ST elevation ≥0.5 mm in V7-V9 = posterior STEMI confirmed
B.6 ARRHYTHMIAS - DETAILED CASE STUDIES
Case 13: Atrial Fibrillation - Full Analysis
Rate: Irregularly irregular (ventricular rate ~130 bpm = rapid AF)
Rhythm: Completely irregular RR intervals (hallmark of AF)
P waves: ABSENT - replaced by fibrillatory baseline (f waves)
         Coarse fibrillation (>1 mm waves) = more likely to cardiovert
         Fine fibrillation (<1 mm waves) = longer-standing, harder to cardiovert
QRS: Narrow (0.08 sec) - normal ventricular conduction
     If wide QRS: aberrant conduction or pre-existing BBB or WPW (dangerous!)
- Symptoms for 3 days → "Persistent AF" (but <48h threshold is critical for cardioversion!)
- If <48 hours: Can cardiovert without prior anticoagulation (low thrombus risk)
- If >48 hours or unknown: Must anticoagulate for 3-4 weeks OR do TEE to rule out LA appendage thrombus BEFORE cardioversion
| Factor | Points |
|---|---|
| C - Congestive heart failure | 1 |
| H - Hypertension (this patient has it) | 1 |
| A2 - Age ≥75 | 2 |
| D - Diabetes | 1 |
| S2 - Stroke/TIA history | 2 |
| V - Vascular disease (prior MI, PVD) | 1 |
| A - Age 65-74 | 1 |
| Sc - Sex category (female) | 1 |
- Score ≥2 (men) or ≥3 (women): Oral anticoagulation recommended
- First-line: NOACs (apixaban, rivaroxaban, dabigatran) preferred over warfarin
Case 14: Atrial Flutter - Classic Pattern
Rate: Atrial rate ~300 bpm; Ventricular rate ~150 bpm (2:1 block)
Rhythm: Regular (regular regular - unlike AF which is irregular)
P waves: SAWTOOTH flutter waves (F waves)
         Negative in II, III, aVF (typical flutter - cavotricuspid isthmus reentry)
         Rate: ~300 bpm (can be 250-350)
QRS: Narrow, follows every 2nd flutter wave (2:1 conduction)
- Vagal maneuver / Adenosine: Slows AV node → unmasks flutter waves (flutter does NOT terminate)
- Adenosine terminates AVNRT/AVRT but only slows flutter - this helps distinguish!
- Rate control: AV nodal blockers (beta-blocker, diltiazem)
- Rhythm control: Cardioversion (electrical or pharmacological - ibutilide)
- Definitive cure: Radiofrequency ablation of cavotricuspid isthmus (~95% cure rate)
- Anticoagulation: Same rules as AF (flutter can be associated with LA thrombus)
Case 15: AVNRT (Most Common SVT) - Classic and Atypical
Rate: 180 bpm
Rhythm: Regular
P waves: "Buried" in QRS or just after QRS
         "Pseudo-R'" in V1 - small r' appearing at end of QRS = retrograde P
         "Pseudo-S" in II, III, aVF - negative deflection at end of QRS = retrograde P
         RP interval VERY SHORT (<70 ms - P right after QRS)
QRS: Narrow (0.08 sec) - normal
No delta wave, no pre-excitation
- Impulse conducts DOWN the slow pathway (long conduction time = long PR anterograde)
- Returns UP the fast pathway (very fast = retrograde P buried in QRS)
- Creates circuit entirely within AV node and perinodal tissue
- Acute: Vagal maneuvers first (Valsalva, carotid sinus massage, cold water immersion of face)
- Modified Valsalva (supine, legs raised after strain phase) = >40% conversion
- IV Adenosine (6 mg rapid push): Terminates by blocking AV node → breaks circuit
- Warn patient about 10-15 sec of "horrible feeling" (flushing, chest pressure, impending doom)
- Half-life = 10 seconds! Works quickly
- Long-term: Beta-blockers, verapamil, or radiofrequency ablation of slow pathway (>95% cure rate, <1% risk of complete AV block)
Case 16: WPW (Wolff-Parkinson-White) - Dangerous SVT
PR interval: SHORT (0.10 sec = 2.5 small boxes, <0.12 sec)
Delta wave: Slurred, gradual upstroke of QRS (early activation via accessory pathway)
QRS: Wide (≥0.12 sec) = delta wave + normal conduction fused
ST-T changes: Secondary (discordant - opposite QRS direction)
Pseudo-Q waves: Delta wave in certain leads may look like Q (e.g., negative delta in III = "pseudo-Q")
Normal conduction: SA→AV node→His→Purkinje (AV node limits rate to ~180-200 bpm)
WPW + AF: Impulses bypass AV node via accessory pathway → ventricles bombarded at AF rate
           Ventricular rate can reach 300+ bpm → VF → SCD

ECG of WPW-AF:
- IRREGULARLY IRREGULAR rhythm (AF pattern)
- WIDE QRS complexes (pre-excited - conducted via accessory pathway)
- Very rapid rate (>200 bpm possible)
- Bizarre, variable morphologies (some beats may be narrow if conducted normally)
- AV nodal blockers are CONTRAINDICATED: Adenosine, verapamil, diltiazem, digoxin
- Why: Block AV node → all conduction goes via accessory pathway → even faster rate → VF
- TREAT WITH: DC cardioversion (emergent) or IV procainamide / ibutilide (Class IA/III - block accessory pathway)
Case 17: Ventricular Tachycardia vs SVT with Aberrancy - How to Distinguish
Question 1: Is there RS complex in ANY precordial lead?
  No RS (all QS or all R) → VT (100% specific)
  Yes → Go to Question 2

Question 2: Is the RS interval >100 ms in ANY precordial lead?
  Yes → VT
  No → Go to Question 3

Question 3: Is there AV dissociation?
  Yes → VT (P waves march through at different rate from QRS)
  No → Go to Question 4

Question 4: Are morphological criteria for VT met in V1 and V6?
  Yes → VT
  No → SVT with aberrancy (diagnosis of exclusion)
- QRS width 0.18 sec (very wide - VT favored)
- QRS all negative in V1-V4 (concordance = VT feature)
- Independent P waves visible "marching through" at 80 bpm (AV DISSOCIATION - confirms VT)
- Northwest axis (-150°)
- Hemodynamically unstable VT: Immediate synchronized DC cardioversion
- Stable VT: IV amiodarone (most common) or procainamide; lidocaine
- After stabilization: ICD implant (recurrent VT in structural heart disease = Class I ICD indication)
Case 18: Torsades de Pointes
- QTc = 580 ms (severely prolonged - normal <460 ms in women)
- Hypokalemia pattern: prominent U waves, flat T waves
- Bradycardia (rate 52) - "pause-dependent" TdP risk
- Polymorphic VT with twisting axis ("torsades" = twisting of points in French)
- QRS complexes revolve around the isoelectric baseline
- Rate 200-250 bpm
- Often self-terminating (lasting a few seconds to minutes)
- May degenerate to VF if prolonged
- IV Magnesium sulfate 2 g over 2 minutes (first-line even with normal Mg level)
- Correct hypokalemia (K+ target ≥4.0)
- Stop all QT-prolonging drugs
- Increase heart rate (isoproterenol infusion, temporary overdrive pacing) - eliminates the "long pause" that triggers TdP
- Do NOT give amiodarone or other QT-prolonging antiarrhythmics
Antiarrhythmics: Sotalol, amiodarone, quinidine, procainamide, flecainide
Antibiotics:     Azithromycin, clarithromycin, fluoroquinolones (ciprofloxacin, moxifloxacin)
Antifungals:     Fluconazole, ketoconazole
Antiemetics:     Ondansetron, domperidone
Antipsychotics:  Haloperidol, chlorpromazine, ziprasidone
Antihistamines:  Terfenadine (now withdrawn), diphenhydramine
Antidepressants: TCAs (amitriptyline, imipramine)
Case 19: Complete AV Block (3rd Degree)
Atrial rate: 75 bpm (P waves marching through at regular rate)
Ventricular rate: 32 bpm (escape rhythm - independent)
PP intervals: REGULAR
RR intervals: REGULAR
PR relationship: NONE - P waves and QRS are COMPLETELY INDEPENDENT
               (P may fall before, during, or after QRS randomly)
QRS: WIDE (0.14 sec) - ventricular escape focus (below bundle of His)
     Wide QRS = bundle branch level or below (worse prognosis than narrow QRS escape)
- Acute inferior MI (RCA occlusion - affects AV node; usually TRANSIENT)
- Acute anterior MI (septal branch of LAD - affects bundle branches; usually permanent)
- Fibrosis/calcification (Lev's disease - aging)
- Lyme disease (spirochete invades AV node - most common reversible cause in endemic areas)
- Endocarditis with abscess extending to AV node
- Hyperkalemia
- AV nodal blocking drugs
- Immediate: Atropine IV 0.5-1 mg (may help if AV nodal-level block)
- If wide QRS escape: Atropine USELESS (below AV node)
- Transcutaneous pacing immediately
- Definitive: Permanent pacemaker implantation
B.7 HYPERKALEMIA - THE "GREAT MIMICKER"
Case 20: Progressive Hyperkalemia in Renal Failure
- Narrow, tall, peaked T waves ("tented T waves") - EARLIEST ECG sign
- T waves symmetric, narrow base, tall peak (unlike normal broad T)
- Best seen in precordial leads
- PR interval prolongation
- P waves become flat and then disappear (sinoventricular conduction)
- QRS begins to widen
- Marked QRS widening (>0.12 sec)
- "Sine wave" pattern - QRS and T merge into undulating wave
- ST elevation may appear (mimics STEMI!)
- Ventricular fibrillation or asystole
- Calcium gluconate IV (membrane stabilization - works in 2-5 min, lasts 30-60 min) - does NOT lower K+
- Insulin 10 U + Dextrose 50 g IV (shifts K+ into cells - works in 20-30 min)
- Sodium bicarbonate IV (if acidosis present)
- Salbutamol/Albuterol nebulization (shifts K+ - useful adjunct)
- Kayexalate (SPS) or patiromer (gut K+ binders - hours delay)
- Emergent dialysis (definitive removal)
═══════════════════════════════════
SECTION C: TMT - DETAILED CASES
═══════════════════════════════════
C.1 COMPLETE NORMAL TMT REPORT ANALYSIS
Case 21: Negative (Normal) TMT
Protocol: Standard Bruce
Resting ECG: Normal sinus rhythm, no ST changes, QTc 420 ms

Stage 1 (1.7 mph, 10%): HR 90, BP 130/80. No symptoms. No ECG changes.
Stage 2 (2.5 mph, 12%): HR 118, BP 150/82. Slight fatigue. No ECG changes.
Stage 3 (3.4 mph, 14%): HR 148, BP 170/85. Dyspnea (normal). No ECG changes.
Stage 4 (4.2 mph, 16%): HR 162, BP 185/88. Fatigued, stopped voluntarily.

Maximum HR achieved: 162 bpm
% of MPHR (220-45=175): 162/175 = 93% ✓ (>85% = adequate test)
Maximum MET: ~12 METs (completed Stage 4) = EXCELLENT exercise capacity
BP response: Normal gradual increase; no abnormal response

ECG changes during test: NONE
Recovery ECG at 2, 4, 6 minutes: Normal; rapid HR return to baseline

Duke Treadmill Score:
  DTS = 12 (exercise time min) - (5 × 0 mm ST) - (4 × 0 angina index)
  DTS = 12 - 0 - 0 = +12
  Interpretation: LOW RISK (score ≥+5)
  Annual mortality: 0.25%
Case 22: Positive TMT - Significant Ischemia
Protocol: Bruce
Resting ECG: LVH pattern, normal ST segments (baseline)

Stage 1: HR 85, BP 145/88. No symptoms. No ECG changes.
Stage 2: HR 112, BP 168/92. No symptoms. No ECG changes.
Stage 3: HR 128, BP 172/96. Onset of typical chest tightness (angina Grade 2).
         ECG: 2 mm horizontal ST depression in leads V4, V5, V6
              1.5 mm ST depression in II, aVF
         TEST TERMINATED at patient's request (Grade 2 limiting angina)

Maximum HR: 128 bpm (73% of MPHR - inadequate? No - stopped due to symptoms)
Maximum METs: ~9
BP: Normal response

Duke Treadmill Score:
  DTS = 9 - (5 × 2 mm) - (4 × 1 angina) = 9 - 10 - 4 = -5
  Interpretation: MODERATE-HIGH RISK (score -10 to +4)
  Annual mortality: 1.25%

ECG changes: Horizontal ST depression ≥2 mm in multiple leads (lateral and inferior)
             with typical symptoms during exercise = STRONGLY POSITIVE

Recovery: ST depression persists for 8 minutes into recovery (slow recovery = worse prognosis)
- Women have higher false positive rate (~15-20% vs ~10% men) due to hormonal effects on repolarization and higher prevalence of microvascular angina
- However, symptoms + multivessel ST depression in this patient = likely true positive
- If uncertain: Proceed to stress imaging (stress echo or nuclear MPI) before cath
Case 23: High-Risk TMT - Urgent Scenario
Stage 1 (Bruce): HR 78, BP 130/82.
Early Stage 1 (2 minutes into Stage 1):
  HR 82 bpm (barely elevated)
  BP DROP: 140 → 118 systolic (exertional hypotension = very high risk sign!)
  ECG: 3 mm downsloping ST depression in V3-V6 (SEVERE, EARLY, DOWNSLOPING = worst pattern)
  Severe angina Grade 3 (very painful)
  TEST TERMINATED IMMEDIATELY

Maximum HR: Only 82 bpm (43% MPHR)
Maximum METs: <5 (very poor exercise capacity)

Duke Score: <5 min - (5×3) - (4×2) = 5 - 15 - 8 = -18
            VERY HIGH RISK (score ≤-11)
            Annual mortality: >5%
- Exertional hypotension (BP drop >10 mmHg) = most dangerous sign - severe LV dysfunction
- Stage 1 positivity (<5 METs)
- Downsloping ST depression (worst pattern)
- ≥3 mm ST depression (severe)
- Multiple lead involvement
- Symptoms severe enough to stop test early
Case 24: Non-Diagnostic TMT
Stage 1-3: HR increases from 62 to only 98 bpm
Stage 3 end: Patient fatigued, no chest pain
Maximum HR: 98 bpm
% MPHR (220-72=148): 98/148 = 66% (INADEQUATE - <85% MPHR not achieved!)
No symptoms during test
No ECG changes

Duke Score: Cannot be calculated validly (inadequate HR response)
- Hold beta-blocker for 48 hours (with physician approval) and repeat
- Pharmacological stress test: IV adenosine or dobutamine stress with nuclear imaging or echo (does not require patient to exercise or achieve target HR)
- Coronary CTA (for anatomical assessment of coronary stenosis)
═══════════════════════════════════
SECTION D: HOLTER MONITORING - DETAILED WITH CASE STUDIES
═══════════════════════════════════
D.1 COMPLETE NORMAL HOLTER REPORT
Case 25: Normal 24-Hour Holter
Total Duration: 24 hours 3 minutes
Total Beats Analyzed: 98,420

Heart Rate Analysis:
  Mean HR: 72 bpm
  Minimum HR: 48 bpm at 3:22 AM (sinus bradycardia during sleep - NORMAL)
  Maximum HR: 148 bpm at 2:15 PM (associated with activity in diary - sinus tachycardia - NORMAL)

Rhythm Analysis:
  Dominant rhythm: Normal sinus rhythm 97.2% of recording
  Supraventricular beats: 84 total (0.09% of all beats) - benign isolated PACs
  Ventricular beats: 12 total (0.01%) - benign isolated PVCs, uniform morphology
  No sustained arrhythmias
  No significant pauses

Longest pause: 1.4 seconds (during sleep - NORMAL, sinus pause)
AF burden: 0%

ST Analysis: No significant ST changes

Heart Rate Variability (HRV):
  SDNN: 142 ms (Normal >100 ms = good autonomic function)
  rMSSD: 48 ms (Normal >20 ms = adequate vagal tone)

Symptom Correlation:
  Patient pressed event button at 14:35 complaining of "fluttering"
  ECG at that moment: 3 isolated PACs in a row → atrial triplet → then normal sinus

Conclusion: Benign isolated PACs and PVCs. No pathological arrhythmia. Palpitations
            correlate with PACs - reassure patient.
D.2 ABNORMAL HOLTER REPORTS
Case 26: Significant PVC Burden - PVC-Induced Cardiomyopathy
Total Beats: 102,840
PVC count: 24,681 (24% of total beats - SEVERELY ELEVATED)
PVC morphology: Uniform (unifocal) - all identical morphology
                LBBB morphology = right ventricular origin (RVOT most common site)
PVC coupling interval: Fixed (fixed distance from preceding sinus beat)
Runs of NSVT: 14 episodes (3-8 beats each, rate 150-180 bpm)
Bigeminy: Frequent episodes

Significant finding: 24% PVC burden with reduced EF = PVC-induced cardiomyopathy
- PVC burden >15-20% of total beats can cause dilated cardiomyopathy
- Mechanism: Chronic dyssynchronous contraction → LV dysfunction
- KEY FACT: This is REVERSIBLE with treatment! (Unlike ischemic cardiomyopathy)
- Treatment:
- Radiofrequency ablation (curative, especially for RVOT origin PVCs - ~90% success)
- Beta-blockers (reduce PVC burden and symptoms)
- Antiarrhythmics (flecainide for RVOT PVCs if no structural disease)
- After successful ablation/treatment: LV function typically recovers over 3-6 months
Case 27: Paroxysmal AF Detection - Cryptogenic Stroke
Day 1: Normal sinus rhythm throughout
Day 2:
  02:14 AM: Sudden onset AF (irregular, no P waves, rate 88-140 bpm)
  02:14-05:42 AM: AF persists for 3 hours 28 minutes = PAROXYSMAL AF
  05:42 AM: Spontaneous cardioversion to sinus rhythm
  No further episodes detected

Total AF burden: 3 hours 28 minutes / 48 hours = 7.2% AF burden
- AF is the most common identifiable cause of embolic stroke (cause of ~20-30% of all strokes)
- A 3-hour episode of AF is long enough to cause LA appendage thrombus and stroke
- This patient was in sinus rhythm when presented → AF would have been missed without monitoring
- Management: Start oral anticoagulation immediately (CHA2DS2-VASc = 1 for age 65-74 or just the stroke = 2 = anticoagulation definitely indicated)
- ILR (implantable loop recorder) detected AF in 30% of cryptogenic stroke patients at 3 years
- vs 3% detected by conventional monitoring
- Implication: Every cryptogenic stroke patient should have extended cardiac monitoring (≥30 days minimum)
Case 28: Sick Sinus Syndrome - Tachy-Brady Pattern
06:00-09:00: Sinus bradycardia (HR 42-52 bpm) during morning activities - inappropriate
11:32: Onset rapid atrial tachycardia (HR 158 bpm) - patient reports palpitations
11:32-11:51: Paroxysmal AT for 19 minutes
11:51: Sudden termination of AT → 5.8-SECOND SINUS PAUSE → very slow escape (38 bpm)
       Patient syncopized at 11:51 → this corresponds to the pause!

The pause is the classic "overdrive suppression" of diseased SA node after fast AT

Subsequent night: Irregular sinus pauses up to 3.2 seconds during sleep
HR variability: Severely blunted (SDNN 38 ms - significantly reduced)
- Permanent dual-chamber pacemaker (DDD or DDDR mode)
- After pacemaker placed: Can safely give rate control drugs for tachycardia episodes without fear of bradycardia
Case 29: Holter in Post-MI Risk Stratification
Sinus rhythm throughout
Heart Rate Variability:
  SDNN: 42 ms (SEVERELY REDUCED - normal >100 ms)
  LF/HF ratio: 5.8 (elevated - sympathetic dominance post-MI)

Ventricular ectopy:
  PVC count: 1,842 (1.8% - above normal but not cardiomyopathy threshold)
  NSVT episodes: 8 episodes (3-11 beats each, max rate 178 bpm)

T-wave alternans: Not analyzed on standard Holter (requires specialized analysis)
- EF 35% + NSVT + low HRV = VERY HIGH RISK for sudden cardiac death
- MADIT-II criteria: EF ≤30% + prior MI → ICD reduces mortality
- SCD-HeFT criteria: EF ≤35% + NYHA II-III (ischemic or non-ischemic) → ICD
- This patient: EF 35% + prior MI → PRIMARY PREVENTION ICD indicated
- HRV is an additional risk marker but not a standalone ICD indication
═══════════════════════════════════
SECTION E: ECHOCARDIOGRAPHY - DETAILED WITH CASE STUDIES
═══════════════════════════════════
E.1 NORMAL TTE - COMPLETE QUANTITATIVE ANALYSIS
Case 30: Normal Echocardiogram (Reference Values)
LV Internal Diameter (End-Diastole): LVEDD = 4.8 cm (Normal men <5.8, women <5.2 cm)
LV Internal Diameter (End-Systole): LVESD = 3.0 cm (Normal <4.0 cm)
Interventricular Septum thickness (IVSd): 0.9 cm (Normal 0.6-1.0 cm)
Posterior Wall thickness (PWTd): 0.8 cm (Normal 0.6-1.0 cm)
Aortic Root diameter: 2.8 cm (Normal <3.8 cm at sinuses)
Left Atrium (Antero-posterior): 3.2 cm (Normal <3.8 cm)
LA Volume Index: 24 mL/m² (Normal ≤34 mL/m²)
EDV: 92 mL (Normal men <212, women <174 mL)
ESV: 38 mL
Stroke Volume: 54 mL (CO = 54 × 72 = 3,888 mL/min = 3.9 L/min - borderline low? with her BSA 1.65 = CI 2.4 L/min/m² = normal)
Ejection Fraction: 58% (Normal ≥55%)
E wave: 82 cm/s
A wave: 58 cm/s
E/A ratio: 1.41 (Normal 0.8-2.0 - GRADE I= normal in young adults)
Deceleration Time (DT): 192 ms (Normal 150-220 ms)
IVRT: 75 ms (Normal 60-100 ms)
Septal e': 12 cm/s (Normal ≥7 cm/s = normal relaxation)
Lateral e': 16 cm/s (Normal ≥10 cm/s)
Average E/e': 82/[(12+16)/2] = 82/14 = 5.9 (Normal <8 = normal filling pressure)
TAPSE: 22 mm (Normal ≥17 mm = normal RV systolic function)
Tricuspid annular TDI S': 14 cm/s (Normal ≥9.5 cm/s)
IVC: 1.6 cm, collapses >50% with sniff (RAP ~3 mmHg = normal)
Aortic valve: Trileaflet, normal opening, no calcification
              Peak velocity: 1.1 m/s (Normal <2.0 m/s)
Mitral valve: Normal leaflets, no prolapse, trivial central regurgitation (normal variant)
Tricuspid valve: No regurgitation detected
Pulmonary valve: Normal
E.2 DILATED CARDIOMYOPATHY (DCM) - DETAILED CASE
Case 31: DCM with Severely Reduced EF
LV Size:
  LVEDD: 6.8 cm (severely dilated - Normal <5.8 cm in men)
  LVESD: 5.9 cm (severely dilated)
  IVSd: 0.8 cm (Normal or thin - characteristic of DCM - no hypertrophy!)
  PWTd: 0.8 cm
  → LV mass: Normal/reduced per unit volume despite large size = eccentric hypertrophy pattern

LV Volumes:
  EDV: 298 mL (severely increased)
  ESV: 236 mL (severely increased)
  EF: (298-236)/298 = 21% (SEVERELY REDUCED)

LV Shape: Globular (spherical) rather than elliptical
          Sphericity index (length/width): Reduced toward 1.0 in DCM (normal ~1.5-2.0)

Wall Motion: Global hypokinesis (all segments reduced motion uniformly)
             WMSI: 2.0 (all segments hypokinetic)
             No focal wall motion abnormality (distinguishes from ischemic cardiomyopathy)

Global Longitudinal Strain (GLS): -7% (Severely abnormal - Normal ≈ -20%)
Mitral Inflow:
  E: 98 cm/s (elevated)
  A: 32 cm/s (reduced or absent at advanced HF)
  E/A: 3.0 (RESTRICTIVE pattern)
  DT: 130 ms (<150 ms = pseudonormal/restrictive)

TDI:
  Septal e': 4 cm/s (severely reduced)
  Lateral e': 5 cm/s
  E/e': 98/4.5 = 21.8 (severely elevated = very high LV filling pressure)

Grade III Diastolic Dysfunction (Restrictive filling)
This indicates severely elevated LVEDP and pulmonary venous congestion
Mitral Regurgitation:
  Functional MR (secondary to LV dilation and papillary muscle displacement)
  Vena contracta: 0.5 cm = Moderate MR (EROA estimated 0.25 cm²)

Left Atrium: Severely dilated (LA volume index 52 mL/m² - Normal ≤34)
RV: Mildly dilated, mildly reduced function (TAPSE 14 mm)
TR velocity: 3.2 m/s → PASP = 4(3.2)² + 15 = 41 + 15 = 56 mmHg
             Moderate pulmonary hypertension (secondary to LV failure)

Apical Thrombus:
  In severely dilated LV with apical akinesis/stasis:
  Sensitivity for detection: ~95%
  Look for echogenic structure with convex surface distinct from endocardium
  Contrast echo improves detection significantly
  In this patient: Spontaneous echo contrast ("smoke") in LV apex = high thrombus risk
  → Anticoagulation strongly recommended (systemic embolism risk)
- Stop alcohol completely (alcoholic DCM can partially reverse with abstinence)
- HFrEF treatment: ACEI/ARB/ARNI, beta-blocker (carvedilol), MRA, SGLT2i
- Diuretics for congestion
- ICD if EF remains ≤35% after 3-6 months of optimal medical therapy
- CRT if LBBB + QRS ≥150 ms + EF ≤35%
- Anticoagulate for LV thrombus (warfarin or LMWH - NOACs not well-studied for LV thrombus)
E.3 HYPERTROPHIC CARDIOMYOPATHY (HCM) - DETAILED CASE
Case 32: HOCM (Hypertrophic Obstructive Cardiomyopathy)
LV Wall Thickness:
  IVSd: 2.4 cm (SEVERELY HYPERTROPHIED - Normal <1.1 cm)
  PWTd: 1.1 cm (relatively normal)
  ASYMMETRIC SEPTAL HYPERTROPHY (ASH): IVS/PW ratio = 2.4/1.1 = 2.18 (>1.3 = significant ASH)

LV Size:
  LVEDD: 3.8 cm (SMALL - hypertrophied muscle takes up space - opposite of DCM!)

LV Function:
  EF: 75% (HYPERDYNAMIC - very high EF is a RED FLAG in HCM)

LVOT Assessment (Key Feature):
  LVOT diameter: Narrowed by bulging septum
  CW Doppler in LVOT: Peak gradient 65 mmHg at rest (OBSTRUCTIVE - significant obstruction ≥30 mmHg)
  SAM (Systolic Anterior Motion) of mitral valve present:
    - MV leaflet gets pulled into LVOT during systole (Venturi effect from high LVOT velocity)
    - SAM worsens obstruction further
    - Associated with MR (SAM drags leaflet away from coaptation = MR directed posteriorly)

Mitral Valve:
  SAM present (grade 3 out of 4)
  MR: Moderate (posteriorly directed jet - due to SAM)
  Mitral leaflets: Elongated (a feature of HCM)
- Gradient increases to 90 mmHg with Valsalva (>50 mmHg provocable = significant)
- Confirms obstructive physiology
| Risk Factor | Present? |
|---|---|
| Maximum LV wall thickness ≥30 mm | Yes (24 mm = significant) |
| Family history of SCD | Yes (father died at 35) |
| Unexplained syncope | Yes |
| NSVT on Holter | Need to check |
| Abnormal BP response to exercise on TMT | Need to check |
| LV apical aneurysm | No |
| Extensive fibrosis on CMR (LGE >15%) | Need CMR |
- Uses: Age, max LV thickness, LA diameter, peak LVOT gradient, family SCD history, NSVT, unexplained syncope
- Calculate online: If 5-year risk ≥6% → ICD recommended; 4-6% = consider ICD
- Disqualify from competitive sports (Class I restriction)
- Avoid dehydration, vasodilators (worsen obstruction)
- Obstruction symptoms: Beta-blockers or verapamil (negative inotropes reduce gradient)
- Refractory obstruction: Septal reduction therapy:
- Surgical myectomy (gold standard for young patients, gradient remains >50 mmHg)
- Alcohol septal ablation (older patients, high surgical risk)
- Mavacamten (new cardiac myosin inhibitor - reduces obstruction medically)
- ICD: Based on risk stratification (very high risk here given syncope + FH of SCD)
E.4 AORTIC STENOSIS - DETAILED ECHO ASSESSMENT
Case 33: Severe Aortic Stenosis - Classic Presentation
Aortic Valve 2D Appearance:
  Trileaflet (most AS in elderly = calcific/degenerative)
  Heavy calcification of all three leaflets
  Markedly reduced opening (valve opening area appears tiny)
  Aortic annulus diameter: 2.1 cm (measured for TAVR planning)

CW Doppler Across Aortic Valve:
  Peak velocity: 4.8 m/s (SEVERE: >4.0 m/s)
  Mean gradient: ΔP = 4(4.8)² = 92 mmHg peak; mean = 55 mmHg (SEVERE: >40 mmHg)

Continuity Equation (AVA):
  LVOT diameter: 2.0 cm → LVOT area = π(1.0)² = 3.14 cm²
  LVOT VTI (PW Doppler): 19 cm
  AV VTI (CW Doppler): 94 cm
  AVA = 3.14 × 19 / 94 = 0.63 cm² (SEVERE: <1.0 cm²)
  AVA indexed: 0.63/1.65 BSA = 0.38 cm²/m² (SEVERE: <0.6)

Dimensionless Velocity Index (DVI):
  DVI = V_LVOT / V_AV = 1.1/4.8 = 0.23 (Severe: <0.25)

LV Response to AS:
  LVH (concentric): IVSd 1.4 cm, PWTd 1.3 cm
  RWT = 2(1.3)/4.5 = 0.58 (>0.42 = concentric geometry)
  LVEDD: 4.5 cm (normal-small)
  EF: 55% (preserved - LV compensated so far)

Diastolic function: Grade II (pseudonormal) - elevated filling pressures developing
LA size: Mildly enlarged (LA volume index 38 mL/m²)
- AVA <1.0 cm² but mean gradient <40 mmHg - seems contradictory
- EF is PRESERVED (≥50%) - so not low EF causing low gradient
- Mechanism: Small LV cavity + concentric LVH → low stroke volume index (<35 mL/m²) → low flow → low gradient despite critical stenosis
- Danger: Can be misclassified as moderate AS → under-treatment
- Diagnosis: Stroke volume index <35 mL/m² + AVA <1.0 cm² + gradient <40 = paradoxical low-flow AS
- Treatment: Aortic valve replacement still indicated if truly severe
- Severe AS + any symptoms (Class I) - symptoms drive timing!
- Severe AS + EF <50% even if asymptomatic (Class I)
- Severe AS + undergoing other cardiac surgery (Class I)
- Very severe AS (Vmax ≥5 m/s) in asymptomatic patient (Class IIa - can consider early AVR)
E.5 MITRAL STENOSIS - RHEUMATIC
Case 34: Severe Mitral Stenosis - Wilkins Score Assessment
2D Mitral Valve Assessment:
  Leaflet thickening: Predominantly at tips (hockey stick deformity of anterior leaflet)
  Calcification: Moderate at tips and commisures
  Subvalvular apparatus: Chordal thickening and fusion
  "Fish-mouth" appearance in PSAX view = classic severe MS

Hemodynamic Assessment:
  Mean gradient (PW Doppler, mitral inflow): 14 mmHg (SEVERE: >10 mmHg)
  Pressure Half-Time (PHT): 310 ms
  MVA (PHT method): 220 / 310 = 0.71 cm² (SEVERE: <1.0 cm²)

Wilkins Score for Balloon Mitral Commissurotomy (BMC/PTMC):
  (Each 1-4 scale, total 4-16)
  Mobility: Pliable base, restricted tips → Score 2
  Thickening: Tips 4-5 mm thickened → Score 2
  Calcification: Single echogenic area → Score 2
  Subvalvular: Chordal thickening >1/3 from leaflet tips → Score 2
  Total Score: 8 (≤8 = good candidate for BMC!)

Secondary findings:
  LA: Severely enlarged (LA area 32 cm² in A4C, LA volume index 74 mL/m²)
  AF: Present (by ECG - a complication of severe LAE from MS)
  LA appendage: NOT visualized by TTE → TEE required before BMC!
  PASP: 4(3.6)² + 8 = 52 + 8 = 60 mmHg (pulmonary hypertension - from MS)
  RV: Mildly dilated, TAPSE 16 mm (mildly reduced RV function from pulmonary HTN)
  Tricuspid regurgitation: Moderate (secondary to pulmonary HTN)
- Essential to exclude LA appendage thrombus before balloon intervention
- TEE sensitivity for LAA thrombus: ~95-100% (TTE misses many LAA thrombi)
- If thrombus found → anticoagulate for 3+ months, repeat TEE → then BMC if thrombus resolved
- Percutaneous balloon inflation across mitral valve via transseptal puncture
- Results: MVA typically doubles (from 0.7 → 1.5 cm²)
- Indication: Symptomatic severe MS + Wilkins score ≤8 + no LAA thrombus + no significant MR
E.6 PERICARDIAL EFFUSION AND TAMPONADE - CASES
Case 35: Cardiac Tamponade
Pericardial Effusion:
  Large circumferential effusion (3.2 cm posterior, 2.8 cm anterior = >2.0 cm = LARGE)

2D Echo Tamponade Signs:
  1. RA Systolic Collapse: Present! Duration = 45% of systole (>33% = positive)
     (RA collapses inward during systole because pericardial pressure > RA pressure)
     RA collapse is MORE SENSITIVE (occurs first as pericardial pressure rises)

  2. RV Diastolic Collapse: PRESENT!
     (RV free wall collapses inward during diastole when pericardial P > RV diastolic P)
     RV collapse is MORE SPECIFIC for tamponade

  3. IVC: Dilated (2.8 cm) with NO collapse on inspiration
     Plethoric IVC = elevated RAP = venous backpressure from tamponade

  4. LV and RV Reciprocal Respiratory Variation:
     On inspiration: RV gets bigger, LV gets smaller (RV compressed volume into LV)
     On expiration: Opposite
     This is ventricular interdependence = hemodynamic basis of pulsus paradoxus

Doppler Signs:
  Mitral inflow E wave respiratory variation: 35% (>25% = significant)
  (Normally E wave varies <10% with respiration)
  Tricuspid E wave variation: >40%
  This Doppler variation = echo equivalent of pulsus paradoxus
- On inspiration: Intrathoracic pressure falls → RV fills more (fills toward interventricular septum)
- In tamponade: Septum bulges into LV (fixed pericardial space shared by both ventricles)
- LV filling decreases → LV stroke volume decreases → SBP drops by >10 mmHg with inspiration
- This is "exaggerated" normal respiratory variation (normal is <5-10 mmHg)
- Needle guided by echo into largest collection
- Subcostal approach or apical approach
- Dramatic improvement in hemodynamics after even 50-100 mL drained
E.7 LV THROMBUS - ECHO DETECTION
Case 36: Apical LV Thrombus Post-STEMI
LV Apex:
  Apical wall motion: Akinetic (no motion at all segments V1-V4 territory)
  Apical aneurysm: Present (paradoxical bulging of apex in systole = dyskinesis)

Thrombus identification:
  Echogenic mass at LV apex
  Convex surface (distinct from endocardial border)
  Located in area of akinesis (always forms where flow is stagnant)
  Mobile component present (more concerning = higher embolic risk)
  "Spontaneous echo contrast" (swirling "smoke") surrounding thrombus

Diagnosis: LV MURAL THROMBUS (mobile component = URGENT anticoagulation)
Sensitivity of 2D echo for LV thrombus: ~95%
Specificity: ~85-90%
Contrast echo: Greatly improves diagnosis (fill LV with contrast → thrombus appears as
              negative/dark filling defect)
- Anticoagulation (warfarin - target INR 2-3; or LMWH bridging)
- Duration: Minimum 3-6 months, or until thrombus resolves on echo
- New evidence: DOACs (rivaroxaban, apixaban) increasingly used for LV thrombus (off-label; early trial data emerging)
- TEE rarely needed (TTE with contrast is usually sufficient)
E.8 INFECTIVE ENDOCARDITIS - ECHO
Case 37: Aortic Valve Endocarditis with Abscess
- Aortic valve: Oscillating vegetation on non-coronary cusp (1.2 cm, highly mobile = HIGH EMBOLIC RISK if >10 mm)
- Moderate-severe AR: Vena contracta 0.7 cm
- Perivalvular extension: Aortic root thickening suspicious for abscess
- TTE sensitivity for vegetation: 60-70%
- TTE sensitivity for abscess: 40-50% (poor for perivalvular extension)
- TTE sensitivity for prosthetic valve endocarditis: Even lower (~30-40%)
- TEE sensitivity for vegetation: 90-100%
- TEE sensitivity for abscess: 85-90%
- TEE findings here: Perivalvular abscess (echo-free space in aortic root) → CONFIRMED
- Heart failure due to valve dysfunction (most common indication)
- Uncontrolled infection (abscess, fistula, persistent bacteremia despite antibiotics)
- Vegetation >10 mm with high embolic risk (or recurrent embolism despite antibiotics)
- Specific organisms (fungal, MRSA with poor drug penetration)
E.9 CARDIOMYOPATHY SPECTRUM ON ECHO
Quick Comparison Table: Cardiomyopathy Echo Patterns
| Feature | DCM | HCM | RCM | ARVC |
|---|---|---|---|---|
| LV Size | Dilated (>5.8 cm) | Small/normal | Normal/small | Usually normal |
| LV Wall | Thin/normal | Thick (≥15 mm) | Thick/normal | Normal/thin |
| EF | Reduced (<40%) | Hyperdynamic (>70%) | Normal/reduced | Normal/reduced |
| Wall Motion | Global hypokinesis | Hyperdynamic (may have LVOT obstruction) | Normal contraction, poor relaxation | RV free wall motion abnormal |
| RV | Normal/mildly dilated | Normal | Dilated (biatrial enlargement) | SEVERELY dilated, aneurysms |
| Diastolic fn | Restrictive filling | Impaired relaxation or restrictive | RESTRICTIVE ALWAYS | RV dysfunction |
| Other | MR (functional), LA dilated | SAM, LVOT gradient, MR | LA + RA markedly dilated, no LVH | RV fat infiltration (CMR), RBBB on ECG |
| Cause | Idiopathic, alcohol, viral, familial | Sarcomere mutation (MYH7, MYBPC3) | Amyloid, sarcoid, endomyocardial fibrosis | Desmosomal gene mutation |
═══════════════════════════════════
SECTION F: INTEGRATED CLINICAL CASES
═══════════════════════════════════
F.1 Integrated Case: The Diabetic with Chest Pain
Sinus rhythm 76 bpm
LVH by Cornell criteria
T-wave inversion in V4-V6 (LVH strain? Or ischemia?)
Q waves: None
No ST changes at rest
LVEDD: 5.2 cm (upper normal for women)
EF: 50% (borderline)
Wall motion: Mild hypokinesis of posterior and inferior walls (mild RWMA!)
IVSd: 1.2 cm (mild LVH)
Diastolic function: Grade II (E/A pseudonormal 1.2, e' septal 6 cm/s, E/e' 12, LA volume 38 mL/m²)
Estimated PASP: 38 mmHg (borderline elevated)
Bruce Protocol
Stage 2 termination (7 METs achieved)
Max HR: 125 bpm (84% MPHR - just adequate)
ECG: 2 mm downsloping ST depression in II, III, aVF, V5, V6 (inferior AND lateral)
Symptoms: Dyspnea and chest discomfort at Stage 2
DTS = 7 - (5×2) - (4×1) = 7 - 10 - 4 = -7 = MODERATE-HIGH RISK
- At peak stress: New hypokinesis of lateral wall (LCx territory) in addition to worsening inferior wall
- Two vessel territory involvement!
- RCA: 80% stenosis (proximal)
- LCx: 70% stenosis (mid)
- LAD: 40% stenosis (mild, non-obstructive)
F.2 Integrated Case: Young Man with Syncope
Sinus rhythm 72 bpm
QRS: 0.10 sec (mildly broad)
Voltage criteria: S(V1) + R(V5) = 47 mm (LVH!)
Deep T-wave inversions in V4-V6, I, aVL
Axis: Normal (+45°)
No PR abnormality, no WPW pattern
Asymmetric septal hypertrophy:
  IVSd: 2.2 cm (SEVERE HCM)
  PWTd: 1.1 cm
  IVS/PW: 2.0 (>1.3 = diagnostic ASH)
LVOT gradient: 55 mmHg at rest (obstructive)
SAM of mitral valve: Grade 3
MR: Moderate (posteriorly directed, from SAM)
EF: 72% (hyperdynamic)
RV: Normal
Resting rate: 58 bpm
Maximum HR: 142 bpm with activity
NSVT: 3 episodes (4-6 beats each, rate 160-180 bpm)
PVC burden: 350 total (0.4% - not significant in isolation)
HRV: Normal SDNN 118 ms
Stage 1 - Grade I exercise:
  BP response: ABNORMAL - SBP drops from 128 to 112 mmHg (abnormal BP response to exercise)
  LVOT gradient increases from 55 to 110 mmHg with exercise
  Dyspnea and dizziness → TEST TERMINATED at Stage 1

Abnormal BP response to exercise = HIGH RISK MARKER in HCM
- Age 20: Lower intrinsic risk per year, but long lifetime risk
- Wall thickness ≥30 mm: 22 mm (not ≥30)
- FH of SCD: Yes (father at 38)
- Unexplained syncope: Yes
- NSVT: Yes
- Abnormal BP response: Yes
F.3 Integrated Case: Acute Breathlessness in the ICU
Pericardial space: LARGE ECHO-FREE SPACE (3 cm+ posterior)
RV: Compressed, barely visible
IVC: Dilated (>2.5 cm), no collapse
RA systolic collapse: PRESENT
RV diastolic collapse: PRESENT
LV: Small (underfilled)
- E wave varies >30% with respiration = DOPPLER PULSUS PARADOXUS
- Call cardiac surgery IMMEDIATELY
- Emergent pericardiocentesis (echo-guided)
- Drainage of 300 mL bloody fluid → BP improves to 110/70 within minutes
FINAL HIGH-YIELD TABLES
ECG Pattern Recognition - Quick Reference
| ECG Finding | First Differential | Second Differential | Key Confirming Feature |
|---|---|---|---|
| Short PR + delta wave | WPW | - | Delta wave polarity for pathway location |
| ST elevation V1-V3 (coved) | Brugada | Posterior MI, RVMI | No reciprocal changes; SCN5A mutation |
| Diffuse ST elevation | Pericarditis | Early repolarization, STEMI | PR depression; no reciprocal changes |
| Peaked tall T waves | Hyperkalemia | Hyperacute T (early MI) | Check K+; QRS width |
| Prolonged QT | Drug effect | Hypokalemia, LQTS | Medication history; K+ level |
| Right heart strain pattern | PE | PHTN, RVMI | S1Q3T3; RBBB; clinical context |
| J wave (Osborn) | Hypothermia | Brugada, hypercalcemia | Temperature |
| VT vs SVT-aberrancy | VT (default) | SVT-aberrancy | Brugada algorithm; AV dissociation |
| Digoxin scooped ST | Digoxin effect | - | Classic "reverse tick"; HR control |
Echo Numbers to Memorize
| Parameter | Normal | Mildly Abnormal | Severely Abnormal |
|---|---|---|---|
| LVEF | ≥55% | 41-54% | ≤40% |
| LVEDD (women) | <5.2 cm | 5.2-5.9 | ≥6.0 |
| LVEDD (men) | <5.8 cm | 5.8-6.9 | ≥7.0 |
| LA Volume Index | ≤34 mL/m² | 35-48 | >48 |
| E/e' | <8 | 8-14 | >14 |
| TAPSE (RV) | ≥17 mm | 15-17 | <15 |
| PASP | <35 mmHg | 35-50 | >50 |
| AVA (Aortic) | >1.5 cm² | 1.0-1.5 | <1.0 |
| MVA (Mitral) | 4-6 cm² | 1.5-2.0 | <1.0 |
| GLS | ≈ -20% | -16 to -19% | >-16% (less negative) |
What's New in This Expanded Edition
Section A - Cardiovascular Physiology Deep Dive
- Pressure-Volume Loop traced point-by-point through all phases of the cardiac cycle, with how disease (HF, hypertension, volume overload, inotropes) shifts the loop
- LV Geometry patterns: concentric remodeling, concentric hypertrophy, eccentric hypertrophy (with RWT formula)
- Global Longitudinal Strain (GLS): -20% normal, detection of subclinical dysfunction before EF drops
Section B - ECG: 20 Case Studies
- Case 1: Normal sinus rhythm (step-by-step reference)
- Cases 2-4: Sinus bradycardia, sinus tachycardia (cause analysis), sick sinus syndrome
- Cases 5-6: LAE (P-mitrale mechanism), RAE (P-pulmonale)
- Cases 7-8: LVH with strain (Sokolow + Cornell criteria), pathological vs normal Q waves
- ST Elevation Differential Table (10 causes with distinguishing features)
- Cases 9-11: Inferior STEMI with RV infarct (NTG contraindication), Anterior STEMI, De Winter T waves (must-not-miss STEMI equivalent)
- Case 12: Posterior STEMI (looks like NSTEMI in V1-V2; confirmed by V7-V9)
- Cases 13-16: AF (CHA2DS2-VASc scoring, anticoagulation rules), atrial flutter (vagal maneuver distinguishes from SVT), AVNRT mechanism + treatment, WPW (DANGEROUS drugs to avoid, management)
- Cases 17-19: VT vs SVT-aberrancy (full Brugada algorithm), Torsades de Pointes (drugs that cause it, magnesium treatment), Complete AV block (management of wide vs narrow escape)
- Case 20: Hyperkalemia progressive ECG changes (K+ 5.5 → K+ >8) with emergency treatment sequence
Section C - TMT: 4 Cases
- Case 21: Completely normal TMT (reference interpretation, Duke score +12)
- Case 22: Positive TMT with false positive discussion (women's rate)
- Case 23: HIGH-RISK TMT (Stage 1 positivity, exertional hypotension, Duke score -18 → urgent cath)
- Case 24: Non-diagnostic TMT (beta-blocker effect, what to do next)
Section D - Holter: 5 Cases
- Case 25: Normal 24-hour Holter (full quantitative report with HRV values)
- Case 26: PVC-induced cardiomyopathy (24% burden, RVOT origin, reversible with ablation)
- Case 27: Cryptogenic stroke → AF on Holter (CRYSTAL-AF trial data, ILR)
- Case 28: Sick sinus syndrome (5.8-second pause causing syncope documented in real-time)
- Case 29: Post-MI risk stratification (low HRV + NSVT + EF 35% → ICD indication)
Section E - Echo: 10 Cases
- Case 30: Normal quantitative echo (all numbers - reference standard)
- Case 31: Dilated cardiomyopathy - DCM (EF 21%, restrictive filling, functional MR, LV thrombus risk, GLS)
- Case 32: HOCM (asymmetric septal hypertrophy, SAM, LVOT gradient 65 mmHg, risk stratification, mavacamten)
- Case 33: Severe AS (continuity equation worked through, paradoxical low-flow AS explained, TAVR planning)
- Case 34: Severe mitral stenosis (Wilkins score, BMC candidacy, TEE for LAA thrombus)
- Case 35: Cardiac tamponade (RA collapse, RV collapse, IVC plethora, Doppler pulsus paradoxus)
- Case 36: LV apical thrombus post-STEMI (echo diagnosis, contrast use, anticoagulation)
- Case 37: Infective endocarditis with aortic root abscess (TTE vs TEE sensitivity, surgical indications)
- Cardiomyopathy comparison table: DCM vs HCM vs RCM vs ARVC
Section F - 3 Integrated Cases
- Case F.1: Diabetic woman → ECG → resting echo → TMT → stress echo → coronary angiography (two-vessel CAD)
- Case F.2: Young man with syncope → ECG → HCM echo → Holter (NSVT) → TMT (abnormal BP response) → ICD decision
- Case F.3: Post-cardiac surgery tamponade → POCUS diagnosis → emergency pericardiocentesis
More deeply explanation,information and analysis with pictures ,diagrams and graphs with complete pre ecg topics like what is heart,it's location, circulation, conduction, coronary ,action potential etc. And how all are inter relatable and what changes and abnormalities can affect the other and how it will appear in cardiac reports. The history of cardiology, ecg, tmt,holter,echo.how to prepare the patient. What is ecf paper,gelly and it's fundamentals, the theories, principles. What is color coding and why. Why the p,qrs,t and why not the other alphabet.
history of ECG electrocardiogram Einthoven PQRST naming origin Willem 1902
ECG paper standard 25mm/sec squares millivolts history ECG gel electrodes color coding limb leads
history of echocardiography Edler Hertz 1953 TMT treadmill stress test history Holter monitor history 1961
THE ULTIMATE CARDIOVASCULAR MASTER CLASS
From the Beginning of the Universe of Cardiology to Advanced Interpretation
Sources: Costanzo Physiology | Braunwald's Heart Disease | Fuster's The Heart | Textbook of Clinical Echocardiography | Harrison's 2025
╔══════════════════════════════════════╗
║ CHAPTER 0: THE HISTORY OF CARDIOLOGY ║
╚══════════════════════════════════════╝
0.1 ANCIENT BEGINNINGS - BEFORE WE UNDERSTOOD THE HEART
Ancient Egypt (~1550 BCE)
- The Ebers Papyrus (Egyptian medical text) was the first known document to describe the heart as the center of blood and air distribution
- Ancient Egyptians believed the heart was the seat of intelligence and soul
- They recognized the pulse as connected to the heart: "The heart speaks from every limb"
- Metu (vessels) were described running from the heart to all organs
Ancient Greece (~400 BCE)
- Hippocrates (460-370 BCE): First systematic approach to medicine; described the heart as a strong muscle; recognized pericardial effusion
- Aristotle (384-322 BCE): Believed the heart was the seat of intelligence (brain was just a cooling organ); described 3 chambers in the heart (he missed the 4th)
- Erasistratus (304-250 BCE): Distinguished arteries from veins; thought arteries contained air (pneuma)
Ancient Rome (100 CE)
- Galen (129-216 CE): Described the heart chambers more accurately; proposed blood was made in the liver and consumed by organs - the dominant theory for 1400 years (WRONG, but not corrected until Harvey)
- Believed blood flowed through tiny pores in the interventricular septum from right to left
The Islamic Golden Age (~900-1200 CE)
- Ibn al-Nafis (1213-1288): FIRST to correctly describe pulmonary circulation - blood flows from the right ventricle through the lungs (NOT through septal pores) to the left side. Galen's error corrected 300 years before Harvey, but ignored in Europe.
Renaissance - The Revolution (1543-1628)
- Andreas Vesalius (1514-1564): Corrected Galen's anatomy through systematic cadaver dissection; found no pores in the interventricular septum
- Michael Servetus (1511-1553): Independently described pulmonary circulation; was burned at the stake for religious reasons
- William Harvey (1578-1657): Father of Modern Cardiology
- Published "De Motu Cordis" (On the Motion of the Heart) in 1628
- Used quantitative reasoning: heart pumps ~2 oz per beat × 72 beats/min = more blood than body could manufacture → blood must CIRCULATE
- First correct description of systemic circulation: heart pumps blood out through arteries, returns via veins
- Predicted but could not see capillaries (microscopes too weak)
- Marcello Malpighi (1628-1694): First to visualize capillaries under microscope in 1661 - confirmed Harvey's prediction
18th-19th Century Discoveries
- René Laennec (1781-1826): Inventor of the stethoscope (1816)
- Used a rolled tube of paper to hear heart sounds (reportedly to avoid placing ear on a large patient's chest)
- Published "De l'Auscultation Médiate" (1819) - the first systematic description of heart sounds and murmurs
- James Mackenzie (1853-1925): Developed the polygraph to record arterial and venous pulses simultaneously; first clinical use of pulse wave analysis; described the significance of cardiac arrhythmias
- Luigi Galvani (1737-1798): Discovered bioelectricity in frogs (1791) - foundation for all electrophysiology
- Carlo Matteucci (1811-1868): Demonstrated that each heartbeat is accompanied by an electrical current (1843)
- Augustus Waller (1856-1922): First to record the electrical activity of the human heart in 1887 at St. Mary's Hospital London using a mercury capillary electrometer - produced 2 distorted deflections
0.2 THE BIRTH OF THE ECG
1887 - The First Human ECG (Augustus Waller)
- Waller placed his dog "Jimmie" on a table with paws in buckets of saline solution - the first "patient" to have cardiac electrical recording
- Applied Lippmann's capillary electrometer to a human (himself) in 1887
- The images were poor - only 2 deflections visible, heavily distorted by instrument inertia
- Waller initially doubted clinical utility: "The electrocardiogram seems likely to prove of no practical value"
1893-1895 - Einthoven Names the Waves
- Willem Einthoven (1860-1927), Dutch physiologist at University of Leiden, Netherlands
- 1893: Introduced the term "electrocardiogram" at a meeting of the Dutch Medical Association
- 1895: Published "Ueber die Form des menschlichen Electrocardiogramms" (On the Form of the Human Electrocardiogram)
- Using improved mathematical correction of the capillary electrometer, identified 5 deflections
- He had previously labeled uncorrected waves A, B, C, D → after mathematical correction, he needed NEW letters
- Chose P, Q, R, S, T - the corrected curve
WHY PQRST AND NOT ABCDE? (The Answer)
Following the mathematical tradition established by René Descartes, who used letters near the middle of the alphabet (particularly P and Q) to name successive points on a geometrical curve. Einthoven, as a physicist-physician trained in mathematical tradition, adopted this convention. He chose to start with P from the second half of the alphabet, leaving room for future waves to be discovered both before P (if needed) and after T.
By choosing letters in the middle of the alphabet (not starting from A), Einthoven was deliberately leaving room for future discoveries. If he used A-E, there would be no letters before A to name hypothetical earlier waves. P allows for letters before it and more after T.
When he labeled the uncorrected capillary electrometer tracing as A, B, C, D, and then needed a new labeling system for his mathematically corrected tracing, he simply moved to the next unused group of letters. The letter P was the natural next sequential choice after D.
- Einthoven himself left the U wave unnamed initially
- The U wave was named later by other researchers to represent the last deflection sometimes seen after the T wave - following the P, Q, R, S, T sequence (U = the next letter)
- U wave represents late Purkinje fiber repolarization or papillary muscle repolarization
1901-1903 - The String Galvanometer Revolution
- Einthoven redesigned a string galvanometer (originally invented by Clement Ader for telegraph recording)
- His version used a fine quartz thread coated in silver, suspended in a magnetic field
- When electrical current passed through the thread, it deflected → cast a shadow on moving photographic paper
- First published ECG with string galvanometer: 1902 (some say 1901)
- The machine weighed 600 pounds (270 kg), required 5 operators
- The patient had to place both hands and one foot in buckets of electrolyte solution (no sticky electrodes yet!)
- Distance from Einthoven's lab to the hospital: 1.5 km - he transmitted the ECG via telephone cable! (First telemetry ECG)
1924 - Nobel Prize
- Einthoven received the Nobel Prize in Physiology or Medicine in 1924 "for the discovery of the mechanism of the electrocardiogram"
Key Post-Einthoven Developments
| Year | Person | Achievement |
|---|---|---|
| 1912 | Einthoven | Described Einthoven's triangle and the 3 standard limb leads |
| 1913 | Einthoven, Fahr, de Waart | Published the law: Lead II = Lead I + Lead III (Einthoven's Law) |
| 1920s | Thomas Lewis | Described atrial fibrillation, flutter, and heart block on ECG; first ECG textbook |
| 1930 | Frank Wilson | Added precordial (chest) leads V1-V6; unipolar leads (aVR, aVL, aVF) |
| 1942 | Emanuel Goldberger | Augmented the unipolar leads (aVR, aVL, aVF) increasing sensitivity by 50% |
| 1954 | Paul Zoll | First external pacemaker and external defibrillation |
| 1960 | Bernard Lown | External DC cardioversion |
| 1960 | Norman Holter | Portable ambulatory ECG recording |
| 1963 | First portable transistorized ECG machine introduced |
0.3 HISTORY OF HOLTER MONITORING
- Norman J. Holter (1914-1983): American biophysicist
- Spent years developing a wearable "radio electrocardiograph" that patients could carry
- 1949: First demonstration - patient wore a 38-kg backpack radio transmitter that broadcast ECG to a receiver
- 1961: First publication of ambulatory ECG in clinical use - the device now weighed only 1 kg (magnetic tape recorder)
- Initially called "Dynamic Electrocardiography"
- The term "Holter Monitor" was coined by cardiologists who used his device
- Holter himself was a physicist, not a physician - he never treated a patient
Evolution of Holter Technology
1961: Reel-to-reel magnetic tape recorder (1 kg, 2-lead)
1970s: Cassette tape recorders (lighter, more portable)
1980s: Digital solid-state recorders with computer analysis
1990s: 12-lead digital Holter recording
2000s: Patch monitors (adhesive, waterproof, worn for 7-14 days)
2010s: Implantable Loop Recorder (ILR) - 3-year battery
2020s: Smartwatch ECG (Apple Watch lead I; KardiaMobile 6-lead)
0.4 HISTORY OF TMT (EXERCISE STRESS TESTING)
- 1908: Arthur Master (USA) first described exercise as a cardiac stress test concept
- 1929: Master and Oppenheimer developed the "Master's Two-Step Test" - a standardized step exercise test on two 9-inch steps
- Patient stepped up and down a set number of times based on age and weight
- A primitive but important first cardiac stress test
- 1941: First systematic exercise ECG reported - showing ST changes during exercise in angina patients
- 1956: Robert Bruce at University of Washington developed the Bruce Treadmill Protocol - the protocol we still use today
- Bruce designed it to be used with simultaneous ECG monitoring
- Progressive stages of increasing speed and grade every 3 minutes
- 1960s-70s: Treadmill testing became standard clinical practice
- 1975: First major guidelines for exercise testing published by AHA
- 1979: First stress echocardiography reported (Wann et al.) - combining echo with exercise
- 1980s: Nuclear stress testing (SPECT imaging with exercise or pharmacological stress)
0.5 HISTORY OF ECHOCARDIOGRAPHY
- 1942: Karl Theodore Dussik (Austria): First attempted to use ultrasound to image the brain (not heart)
- 1950: W.D. Keidel (Germany): First to use ultrasound to measure cardiac volumes (crude)
- October 29, 1953: THE BIRTH OF ECHOCARDIOGRAPHY
- Inge Edler (cardiologist, 1911-2001) and Hellmuth Hertz (physicist, 1920-1990) at Lund University, Sweden
- Borrowed an industrial ultrasonic reflectoscope from Kockums shipbuilding yard in Malmö
- Applied it to the precordium and saw moving echo signals
- Discovered that the mitral valve produced a distinctive M-mode tracing
- This weekend experiment with a borrowed industrial device changed cardiology forever
- Edler = "Father of Echocardiography"
- 1954-1960s: Edler used M-mode echo to study mitral stenosis preoperatively; identified mitral regurgitation, pericardial effusion, atrial tumors
- 1970s: 2D real-time echocardiography developed (Bom, Somer, Born in Rotterdam, Netherlands)
- 1974: Doppler echocardiography for blood flow measurement
- 1980s: Color flow Doppler (Namekawa, Omoto, Japan)
- 1985: Transesophageal echocardiography (TEE) introduced
- 1990s: Stress echocardiography widely adopted; Tissue Doppler Imaging (TDI)
- 2000s: 3D echocardiography; Speckle tracking (GLS)
- 2010s: POCUS (Point of Care Ultrasound) - bedside echo by non-cardiologists
- 2020s: AI-automated echo interpretation; handheld pocket echo devices
╔════════════════════════════════════╗
║ CHAPTER 1: THE HEART - WHAT IT IS ║
╚════════════════════════════════════╝
1.1 WHAT IS THE HEART?
- Weight: 250-350 g in adults (heavier in men, athletes, hypertensives)
- Dimensions: ~12 cm long × 9 cm wide × 6 cm deep
- Pumps: ~5 liters per minute at rest; up to 25-30 liters/min during maximal exercise
- Beats: ~100,000 times per day; ~35 million times per year; ~2.5 billion times in a lifetime
- Never rests completely - even in deep sleep, heart beats ~50-60 times/min
- The heart is the only organ that works without stopping from the 4th week of embryonic life until death
1.2 LOCATION OF THE HEART
                    MIDCLAVICULAR
                    LINE (LEFT)
                         |
      STERNUM            |
         |               |
    _____|_______________↓________
   |  Right  |    HEART    |      |
   |  Lung   |  [APEX →]  | Left |
   |         |  4th-5th   | Lung |
   |         |  ICS       |      |
   |_________|____________|______|
            DIAPHRAGM
                ↑
              BASE (RV, outflow tracts)
- Lies in the mediastinum (middle compartment of thorax)
- Between the two lungs
- Above the diaphragm
- Behind the sternum (sternum acts as a bony shield)
- Approximately 2/3 of the heart lies to the LEFT of the midline
- Apex: Points downward, forward, and to the left → Located at 5th intercostal space, mid-clavicular line (left)
- Apex beat = point of maximal impulse (PMI) felt here normally
- Base: Faces upward, backward and to the right → Where great vessels (aorta, pulmonary artery) emerge
Right border:   Right atrium (vertical line right of sternum)
Left border:    Left ventricle (lower part) + Aortic knuckle (upper)
Superior border: Aorta + Pulmonary trunk + Left atrium
Inferior border: Right ventricle (horizontal, rests on diaphragm)
Apex:           Left ventricle (lower-left extremity)
1.3 LAYERS OF THE HEART - DETAILED
OUTER → INNER

┌─────────────────────────────────────────┐
│  PERICARDIUM (Pericardial Sac)          │
│  ┌───────────────────────────────────┐  │
│  │  Fibrous pericardium (outer)      │  │
│  │  - Tough, inelastic, collagen     │  │
│  │  - Attached to diaphragm below    │  │
│  │  - Prevents overdistension        │  │
│  │  ┌─────────────────────────────┐  │  │
│  │  │  Serous pericardium         │  │  │
│  │  │  PARIETAL layer (outer)     │  │  │
│  │  │  ~~~~~ Pericardial cavity ~~~~  │
│  │  │  (15-50 mL fluid normally)  │  │  │
│  │  │  VISCERAL layer = EPICARDIUM │  │  │
│  │  │  (directly on heart surface) │  │  │
│  │  └─────────────────────────────┘  │  │
│  └───────────────────────────────────┘  │
│  ┌───────────────────────────────────┐  │
│  │  MYOCARDIUM (Middle layer)        │  │
│  │  - Cardiac muscle (unique type)   │  │
│  │  - LV wall ~9-11 mm              │  │
│  │  - RV wall ~3-4 mm               │  │
│  │  - Atrial wall ~2-3 mm           │  │
│  └───────────────────────────────────┘  │
│  ┌───────────────────────────────────┐  │
│  │  ENDOCARDIUM (Inner layer)        │  │
│  │  - Thin endothelial lining        │  │
│  │  - Continuous with vascular       │  │
│  │    endothelium                    │  │
│  │  - Covers valves, chordae        │  │
│  └───────────────────────────────────┘  │
└─────────────────────────────────────────┘
- Pericarditis: Inflammation of pericardium → ST elevation + PR depression on ECG → chest pain worse lying, better sitting forward
- Pericardial effusion: Fluid accumulation in cavity → CXR shows "water bottle" heart; Echo gold standard
- Myocarditis: Inflammation of myocardium → Diffuse ST changes; elevated troponin; reduced EF
- Endocarditis: Infection of endocardium (usually on valves) → Fever + new murmur + embolic events
1.4 CARDIAC CHAMBERS - DETAILED ANATOMY
The Four Chambers
RIGHT SIDE (Low Pressure)          LEFT SIDE (High Pressure)
       RA                                  LA
    (Thin wall                          (Thin wall
    ~2-3 mm)                            ~3 mm)
       ↓ Tricuspid valve                    ↓ Mitral valve
       RV                                  LV
    (Thin wall                          (Thick wall
    ~3-4 mm)                            ~9-11 mm)
       ↓ Pulmonic valve                     ↓ Aortic valve
  Pulmonary artery                        AORTA
  (to lungs)                             (to body)
Internal Features
- Receives: Deoxygenated blood from Superior Vena Cava (SVC) (upper body) and Inferior Vena Cava (IVC) (lower body), plus coronary sinus (coronary venous return)
- Contains: Crista terminalis (muscular ridge separating smooth and trabeculated portions)
- Contains: Fossa ovalis (oval depression = remnant of foramen ovale)
- Contains: SA node (in the sulcus terminalis, near SVC-RA junction)
- Eustachian valve guards IVC orifice (vestigial; can be prominent on echo)
- Crescent-shaped (wrapped around the LV)
- Two components: Inflow tract + Outflow tract (RVOT - right ventricular outflow tract)
- Trabeculated muscle with moderator band (contains right bundle branch!)
- Generates pressure ~25/5 mmHg (compared to LV ~120/8 mmHg)
- Receives: Oxygenated blood from 4 pulmonary veins (2 right + 2 left)
- Smooth-walled (embryologically from pulmonary veins)
- LA appendage (LAA): Finger-like projection - most common site of thrombus in AF
- LA pressure (~12 mmHg) transmitted backward to pulmonary veins → Pulmonary congestion if elevated (Pulmonary Artery Wedge Pressure = PAWP or PCWP)
- Elliptical (bullet-shaped) = mechanically efficient shape
- Wall is 3x thicker than RV (generates much higher pressure)
- Contains: Papillary muscles (anterior and posterior) attached to mitral leaflets via chordae tendineae
- Contains: False tendons (fibromuscular cords crossing the LV cavity - benign, can cause PVCs)
1.5 THE VALVES - DETAILED ANATOMY AND FUNCTION
How Valves Work - The Basic Principle
AV VALVES (Mitral, Tricuspid):
  OPEN when ventricular pressure < atrial pressure (passive filling)
  CLOSE when ventricular pressure > atrial pressure (systole)
  Prevented from prolapsing backward by chordae tendineae + papillary muscles

SEMILUNAR VALVES (Aortic, Pulmonary):
  OPEN when ventricular pressure > outflow tract pressure
  CLOSE when outflow pressure exceeds ventricular pressure (at start of diastole)
  No chordae - they close by back-pressure alone (Valsalva sinuses help)
The Mitral Valve (Bicuspid / 2 Leaflets)
- Anterior leaflet (larger, occupies 2/3 of annular circumference): Also called the "aortic leaflet" because its base is in continuity with the aortic root
- Posterior leaflet (smaller, divided into 3 scallops: P1, P2, P3)
- Normal valve area: 4-6 cm²
- Coaptation zone: Area where leaflets overlap in normal closure (5-10 mm of overlap)
- MVP (Mitral Valve Prolapse): Leaflet buckles backward beyond the annulus plane into the LA
The Tricuspid Valve (3 Leaflets)
- Anterior, posterior, septal leaflets
- Septal leaflet is partly attached to the septum → any displacement of the septum can distort tricuspid function
Aortic Valve (3 Semilunar Cusps)
- Left, right, non-coronary cusps (named by their relationship to the coronary ostia)
- Left coronary cusp → Left coronary artery ostium
- Right coronary cusp → Right coronary artery ostium
- Non-coronary cusp → No coronary artery
- Valsalva sinuses (aortic sinuses): Pouches behind each cusp that prevent cusps from obstructing coronary ostia during systole; create eddy currents that aid valve closure
╔══════════════════════════════════════╗
║ CHAPTER 2: BLOOD CIRCULATION ║
╚══════════════════════════════════════╝
2.1 THE TWO CIRCULATIONS - COMPLETE CIRCUIT
                    ┌────────────────────┐
                    │  PULMONARY          │
                    │  CIRCULATION        │
                    │  (Low pressure      │
                    │  ~25/12 mmHg PA)    │
                    └─────────┬──────────┘
                              │
                    Pulmonary │ arteries
                    (deoxygenated)
                              ↓
              ┌─────────────────────────────┐
              │          LUNGS              │
              │   Gas Exchange (CO2 ↔ O2)   │
              └─────────────────────────────┘
                              ↓
                    Pulmonary veins
                    (oxygenated)
                              │
                              ↓
    ┌─────── LA → Mitral → LV → Aortic → AORTA ──────────┐
    │                                                      │
    │              SYSTEMIC CIRCULATION                    │
    │              (High pressure ~120/80 mmHg)            │
    │                                                      │
    │    Aorta → Arteries → Arterioles → Capillaries      │
    │                       (Exchange zone)                │
    │    O2 delivery + CO2, waste collection               │
    │                                                      │
    │    ← Venules ← Veins ← SVC/IVC ← Right heart ←     │
    └─────────────────────────────────────────────────────┘
Portal Circulation (Special Circuit)
- Blood from gut → portal vein → liver (for metabolism/detoxification) → hepatic veins → IVC
- NOT part of general circulation directly
- Relevant: Portal hypertension can affect IVC pressure → affects cardiac preload on echo
Coronary Circulation (discussed next)
2.2 THE CORONARY CIRCULATION - IN DEPTH
Origin
The Three Main Vessels
LEFT MAIN (LMCA)
  Length: 0.5-2 cm (short!)
  Bifurcates into:

  ├── LAD (Left Anterior Descending)
  │   ├── Septal perforators → supplies anterior 2/3 of interventricular septum
  │   ├── Diagonal branches → supplies anterior LV free wall
  │   └── Wraps around apex in 80% of cases
  │
  └── LCx (Left Circumflex)
      ├── Marginal branches → supplies lateral and posterolateral LV wall
      └── In left dominant (15%) → gives posterior descending artery (PDA)
RCA (from right aortic sinus)
  ├── SA nodal artery (in 60% of people - from RCA)
  │   → Affects SA node → inferior MI can cause sinus bradycardia
  ├── Acute marginal branches → RV free wall
  ├── AV nodal artery (in 85% of people - from RCA)
  │   → Affects AV node → inferior MI can cause AV blocks
  └── PDA (Posterior Descending Artery) - in right dominant (70%)
      → Supplies inferior wall of LV + posterior septum
Coronary Dominance
| Dominance | Who Supplies PDA | Frequency |
|---|---|---|
| Right dominant | RCA supplies PDA | 70-80% |
| Left dominant | LCx supplies PDA | 10-15% |
| Co-dominant | Both share | 5-10% |
- RCA occlusion in right-dominant: Inferior + posterior MI
- LCx occlusion in left-dominant: Same territory as above but from left side
- This explains why inferior MI culprit can be RCA (80%) or LCx (20%)
How Ischemia Affects ECG and Echo
CORONARY OCCLUSION → ISCHEMIA CASCADE

Timeline:
Seconds:   Myocardial ATP falls → K+ leaves cells →
           Resting membrane potential rises (less negative)

Minutes:   Diastolic dysfunction appears first
           (LV becomes stiffer = impaired relaxation)
           [This is why elevated E/e' appears early on ECHO]

2-5 min:   Wall motion abnormality (RWMA) appears on ECHO
           (Ischemic myocardium contracts less / stops)

5-10 min:  ECG changes appear
           First: Hyperacute T waves (K+ shifts)
           Then: ST elevation (injury current)

15+ min:   ANGINA (symptoms - LAST to appear!)

20-40 min: Irreversible necrosis begins

Hours:     Q waves develop (dead myocardium = electrically silent)
           Troponin rises (released from dying cells)
- Echo detects ischemia BEFORE ECG changes
- ECG changes appear BEFORE symptoms in diabetics (silent ischemia)
- Wall motion on echo is the most sensitive early marker of ischemia
- TMT: Wall motion abnormality on stress echo appears earlier than ECG ST changes
Coronary Vessel - Ischemia - ECG Territory Map
VESSEL → WALL SUPPLIED → ECG LEADS → ECHO WALL

LAD prox → Ant + Septal + Apex → V1-V4, ±aVL → Anterior + Septal segments
           Note: proximal LAD also: I, aVL involvement (diagonal)

LAD dist → Anterior + Apical → V3-V5 → Mid-distal anterior

LCx → Lateral → I, aVL, V5-V6 → Lateral wall

LCx → Posterior/inferior → V7-V9 (posterior leads) → Posterior LV
      Reciprocal: V1-V2 ST depression (tall R wave in V1)

RCA prox → Inferior + RV → II, III, aVF + V4R → Inferior + RV

RCA + post → Inferior + Posterior → II, III, aVF + V1-V2 ST dep → Inferior + posterior

Left main → Anterior + Lateral + Inferior → aVR elevation + diffuse STD → Global
╔════════════════════════════════════════╗
║ CHAPTER 3: THE CONDUCTION SYSTEM ║
╚════════════════════════════════════════╝
3.1 THE CONDUCTION SYSTEM - ANATOMY AND PHYSIOLOGY
The Complete Pathway (with distances and speeds)
┌─────────────────────────────────────────────────────────────────┐
│  SA NODE                                                        │
│  Location: Superior right atrium, at junction of SVC and RA    │
│  Size: ~15 mm × 5 mm (spindle-shaped)                         │
│  Cells: Pacemaker cells (P-cells) + transitional cells         │
│  Intrinsic rate: 60-100 bpm                                    │
│  Blood supply: SA nodal artery (60% from RCA, 40% from LCx)   │
│  Automaticity: HIGHEST in the body                             │
└─────────────────────┬───────────────────────────────────────────┘
                      │ Conduction through atria via:
                      │ 1. Bachmann's bundle (to left atrium - fastest)
                      │ 2. Three internodal tracts (to AV node)
                      ↓ Speed: ~1 m/s; Time: ~0.04-0.08 sec = P WAVE
┌─────────────────────────────────────────────────────────────────┐
│  AV NODE                                                        │
│  Location: Koch's triangle (right atrial wall, near tricuspid  │
│            annulus, anterior to coronary sinus ostium)         │
│  Size: ~5 mm × 2 mm                                           │
│  Intrinsic rate: 40-60 bpm (if takes over pacing)             │
│  Blood supply: AV nodal artery (85% from RCA, 15% from LCx)   │
│  KEY FUNCTION: DELAY conduction (0.1-0.2 sec) to allow        │
│  atrial contraction to complete before ventricular filling     │
│  ends (atrial "kick")                                          │
│  Speed here: 0.02-0.05 m/s (SLOWEST in conduction system)     │
└─────────────────────┬───────────────────────────────────────────┘
                      ↓ Delay time ≈ 0.10 sec = PR SEGMENT
┌─────────────────────────────────────────────────────────────────┐
│  BUNDLE OF HIS (His Bundle / Common Bundle)                     │
│  Location: Penetrates the fibrous body at the apex of Koch's   │
│  triangle → passes through central fibrous body                │
│  Length: ~15-20 mm (short but critical!)                       │
│  Blood supply: Dual (LAD + RCA) - relatively protected         │
│  Intrinsic rate: 40-60 bpm (if takes over pacing)             │
└─────────────────────┬───────────────────────────────────────────┘
                      ↓ Bifurcates at muscular ventricular septum
          ┌───────────┴───────────┐
          ↓                       ↓
┌──────────────────┐   ┌──────────────────────────────────────┐
│  RIGHT BUNDLE    │   │  LEFT BUNDLE BRANCH                  │
│  BRANCH (RBB)    │   │                                      │
│  Thin, compact   │   │  Wide, fan-shaped, trifascicular:   │
│  Runs in the     │   │  ├── Left Anterior Fascicle (LAF)   │
│  moderator band  │   │  │   → Anterosuperior LV            │
│  of RV!          │   │  ├── Left Posterior Fascicle (LPF)  │
│  Speed: ~2 m/s   │   │  │   → Inferoposterior LV           │
└────────┬─────────┘   │  └── Septal fascicle (variable)    │
         ↓              └─────────────────┬────────────────────┘
         └──────────────┬─────────────────┘
                        ↓
┌─────────────────────────────────────────────────────────────────┐
│  PURKINJE FIBERS                                                │
│  Extensive subendocardial network                               │
│  Speed: 2-4 m/s (FASTEST - up to 4 m/s)                       │
│  Intrinsic rate: 20-40 bpm (last resort pacemaker)             │
│  Function: Rapid, coordinated spread to ventricular muscle     │
│  Direction: Endocardium → Epicardium; Apex → Base             │
└─────────────────────────────────────────────────────────────────┘
                        ↓
┌─────────────────────────────────────────────────────────────────┐
│  VENTRICULAR MYOCARDIUM                                         │
│  Speed: 0.3-0.4 m/s (slower than Purkinje)                    │
│  Direction: Endocardium to Epicardium                          │
│  Repolarization: Epicardium to Endocardium (reverse!)          │
│  → This reversal = UPRIGHT T WAVE (same direction as QRS)     │
└─────────────────────────────────────────────────────────────────┘
3.2 THE ACTION POTENTIAL - GRAPHICAL ANALYSIS
Action Potential Type 1: Ventricular Myocardium (Fast-Response Cell)
    +40 ┤                 ╔════════╗
    mV  │           Phase 1╗        ║ Phase 2 (Plateau)
        │            ╔══╝  ╚════════╝
     0  ┼────────────╝
        │  ↑ Phase 0             ╚╗
        │  (Fast Na+)             ║ Phase 3
   -40  ┤                         ║  (K+ out)
        │                          ╚╗
   -70  ┤  ← Threshold             ╚══╗ Phase 4
        │                              ║ (Stable)
   -90 ─┤──────────────────────────────╝

    Time →  0.05 sec (QRS)   0.3 sec (QT interval total)
| Phase | Name | Key Ion | Current | Membrane Change |
|---|---|---|---|---|
| 0 | Rapid depolarization | Na+ (massive influx) | INa (fast) | gNa opens rapidly → overshoots to +40 mV |
| 1 | Early repolarization | K+ (out) + Cl- | Ito | Fast Na+ closes; brief K+ current |
| 2 | Plateau | Ca2+ (in) = K+ (out) | ICaL balanced by IK | Unique to cardiac muscle; triggers CICR |
| 3 | Rapid repolarization | K+ (massive out) | IKr + IKs | Ca2+ channels close; K+ channels dominate |
| 4 | Resting potential | K+ (maintains) | IK1 | Stable at -90 mV; Na/K-ATPase restores |
- Phase 0 + 1 + 2 + 3 = the entire ventricular action potential = QT interval
- Anything that prolongs Phase 2 (more Ca2+) or delays Phase 3 (less K+ out) → prolongs QT
- Drugs that block IKr (HERG channel) → most common cause of drug-induced prolonged QT
Action Potential Type 2: SA Node (Slow-Response / Pacemaker Cell)
    +20 ┤            ╔════╗
    mV  │           ╔╝    ╚╗
        │          ╔╝       ╚╗
     0  ┼─────────╝           ╚╗
        │                       ╚╗
   -40  ┤← THRESHOLD             ╚╗
        │                          ╚═══╗
   -60  ┤                              ╚══╗← Spontaneous
        │                                  ╚══ depolarization
   -70  ┤ ← Max diastolic potential         (AUTOMATICITY)
        │
    Time → Cycle repeats at ~60-100 bpm

    The SLOPE of the spontaneous phase 4 = HEART RATE
    - Steeper slope = faster rate (sympathetic)
    - Shallower slope = slower rate (parasympathetic)
| Feature | Ventricular | SA Node |
|---|---|---|
| Resting potential | Stable -90 mV | Unstable, spontaneously drifts |
| Phase 0 upstroke | Fast Na+ (steep) | Slow Ca2+ (gradual) |
| Phase 4 | Flat (no current) | Spontaneously depolarizing (funny current If) |
| Amplitude | ~120 mV overshoot | ~60 mV (weaker) |
| Conduction speed | Fast | Slow |
The "Funny Current" (If) - Basis of Pacemaker Activity
- HCN (Hyperpolarization-activated Cyclic Nucleotide-gated) channels
- Opens when membrane is HYPERPOLARIZED (at end of phase 3, -60 to -70 mV)
- Carries INWARD Na+ (and some K+) → slowly depolarizes the cell
- Called "funny" because it activates on hyperpolarization (opposite of most channels)
- When membrane reaches threshold (-40 mV) → L-type Ca2+ channels fire → upstroke
- Ivabradine selectively blocks If → slows HR without affecting contractility (used in heart failure, stable angina)
Hierarchy of Automaticity (Why SA Node Dominates)
SA Node (60-100 bpm)
    → Fires fastest → "overdrive suppresses" all lower pacemakers
    → AV node, His, Purkinje all have automaticity but at lower rates
    → SA node fires before they reach threshold → they reset

AV Node (40-60 bpm) - "junctional escape" if SA node fails
His-Purkinje (20-40 bpm) - "ventricular escape" if AV node also fails
Ventricular muscle (<20 bpm) - unreliable, agonal
3.3 CONDUCTION SYSTEM ABNORMALITIES AND THEIR ECG EFFECTS
How Each Level of Block Appears on ECG
PROBLEM AT SA NODE → Sick sinus syndrome
  ECG: Sinus bradycardia / sinus arrest / sinus pauses / SSS

PROBLEM AT BACHMANN'S BUNDLE → Interatrial block
  ECG: Biphasic P wave in inferior leads (advanced IAB = "Bayés syndrome")
  Associated with AF risk

PROBLEM AT AV NODE:
  Mild slowing → 1st degree AV block (PR >0.20 sec; complete conduction)
  Cyclic fatigue → 2nd degree Mobitz I (Wenckebach: PR lengthens → drop)

PROBLEM BELOW HIS BUNDLE:
  Sudden block → 2nd degree Mobitz II (fixed PR → sudden drop)
  Complete → 3rd degree/complete heart block (AV dissociation)

PROBLEM IN BUNDLE BRANCHES:
  Right bundle cut → RBBB (RSR' in V1, broad S in I/V5/V6)
  Left bundle cut → LBBB (broad notched R in I/V5/V6, no Q in these leads)

LEFT ANTERIOR FASCICLE:
  Block → LAFB (LAD -45° to -90°, qR in I/aVL, rS in II/III/aVF)

LEFT POSTERIOR FASCICLE:
  Block → LPFB (RAD >+90°, rS in I/aVL, qR in II/III/aVF)

BIFASCICULAR BLOCK (RBBB + LAFB):
  → Wide QRS + RSR' in V1 + extreme LAD
  → Risk of progressing to CHB if His bundle also diseased

TRIFASCICULAR BLOCK:
  → Bifascicular block + 1st degree AV block
  → Very high risk of intermittent/complete CHB → pacemaker needed
╔═══════════════════════════════════════╗
║ CHAPTER 4: ECG FUNDAMENTALS ║
╚═══════════════════════════════════════╝
4.1 THE ECG PAPER - EVERYTHING YOU NEED TO KNOW
Physical Description
STANDARD ECG GRID (25 mm/sec, 10 mm/mV):

┌─┬─┬─┬─┬───────┬─┬─┬─┬─┬─────────┐  ← 1 LARGE BOX = 5 mm
│ │ │ │ │       │ │ │ │ │         │
├─┼─┼─┼─┼───────┼─┼─┼─┼─┼─────────┤  ← THIN LINES
│ │ │ │ │       │ │ │ │ │         │   = small boxes = 1 mm
├─┼─┼─┼─┼───────┼─┼─┼─┼─┼─────────┤
│ │ │ │ │       │ │ │ │ │         │
├─┼─┼─┼─┼───────┼─┼─┼─┼─┼─────────┤  ← THICK LINES
│ │ │ │ │       │ │ │ │ │         │   = large boxes = 5 mm
└─┴─┴─┴─┴───────┴─┴─┴─┴─┴─────────┘
↑                                  ↑
1 mm                              5 mm
Time (X-Axis) Measurements
| Paper Speed | Small Box (1 mm) | Large Box (5 mm) | 1 second | 5 seconds (rhythm strip) |
|---|---|---|---|---|
| 25 mm/sec (standard) | 0.04 sec (40 ms) | 0.20 sec (200 ms) | 25 mm = 5 large boxes | 125 mm |
| 50 mm/sec (UK/Europe often) | 0.02 sec (20 ms) | 0.10 sec (100 ms) | 50 mm = 10 large boxes | 250 mm |
- 1 large box = 0.20 sec → "A box is a fifth of a second"
- 5 large boxes = 1 second
- 300 large boxes = 1 minute
- Rate = 300 / (number of large boxes between R-R peaks)
Voltage (Y-Axis) Measurements
| Calibration | 1 small box (1 mm) | 1 large box (5 mm) | Standard calibration signal |
|---|---|---|---|
| Standard (1 mV = 10 mm) | 0.1 mV | 0.5 mV | 10 mm tall square pulse at start of tracing |
| Double (1 mV = 20 mm) | 0.05 mV | 0.25 mV | Used when voltages very low |
| Half (1 mV = 5 mm) | 0.2 mV | 1.0 mV | Used when voltages very high (LVH) |
- Should be exactly 10 mm (2 large boxes) tall
- If only 5 mm → ECG running at half-standard → all voltages actually 2x what you measure!
- If calibration is missing → ECG cannot be interpreted for voltage criteria
The Calibration Signal (Standard Signal)
       ┌──────┐
10mm   │      │
       │      │
───────┘      └──────

= 1 mV input → 10 mm deflection = standard gain (1 cm/mV)
Must appear at the beginning of a standard 12-lead ECG
Paper Speed Comparison
25 mm/sec (standard in most countries):
╔════════════════════════════╗
║ P   QRS    T               ║  ← Normal width P-QRS-T
╚════════════════════════════╝

50 mm/sec (common in Europe, for rhythm analysis):
╔════════════════════════════════════════════════════╗
║  P      QRS         T                              ║  ← Stretched out
╚════════════════════════════════════════════════════╝
Advantage at 50 mm/sec: P waves and QRS morphology easier to see
Disadvantage: Takes more paper; need to halve all time measurements
4.2 THE ECG GEL (ELECTRODE GEL) - WHY IT EXISTS
The Problem: Electrical Impedance at Skin
- Creates massive signal loss
- Introduces baseline artifact (movement artifact, muscle noise)
- Makes interpretation impossible
The Solution: Conductive Gel
- Reduces skin-electrode impedance from ~100,000 Ω → ~1,000 Ω (100x reduction)
- Fills microscopic skin crevices and sweat pores → improves contact area
- Allows current to flow freely across the skin-electrode interface
Composition of ECG Gel
- Water (main solvent)
- Sodium chloride (NaCl) or potassium chloride (KCl) - electrolytes for conductance
- Chloride ions specifically important (silver/silver chloride electrodes interact with Cl-)
- Thickening agent (carbomer, cellulose) - makes it gel rather than liquid
- Preservative (parabens, phenoxyethanol) - prevents bacterial growth
- pH buffer - maintains neutral pH to avoid skin irritation
Types of ECG Electrodes
- Pre-gelled (hydrogel already embedded in the electrode pad)
- Silver/silver chloride (Ag/AgCl) sensing surface
- Foam or cloth backing with adhesive
- Advantage: Consistent signal, easy application, hygienic
- The gel is a solid hydrogel (not liquid) - won't dry out during recording
- Metal cup with hollow suction; gel applied separately
- More prone to motion artifact
- Metal plate attached with rubber strap
- Gel applied between metal and skin
- Used for limb leads in formal ECG labs
Skin Preparation (Critical for Signal Quality)
Step 1: Shave excess chest hair (in men) at electrode sites
         Why: Hair creates air gaps → poor contact → artifact

Step 2: Clean skin with alcohol swab
         Why: Removes oils, sweat, skin cream → reduces impedance

Step 3: Gently abrade skin (special prep paper or dry gauze)
         Why: Removes dead outer keratin layer → direct contact with living epidermis
         → Reduces impedance to <5000 Ω (optimal <1000 Ω)

Step 4: Allow to dry
         Why: Wet alcohol is conductive between electrodes → creates current bridges

Step 5: Apply electrodes firmly
         Why: Full contact area needed; press to remove air bubbles

Step 6: Connect lead wires, ensure no tension on wires
         Why: Pulling wires lifts electrode → baseline wander artifact
4.3 ECG ELECTRODES - COLOR CODING SYSTEMS
WHY COLOR CODE?
- Lead reversal → pseudo-axis deviation, pseudo-infarct patterns
- Dextrocardia mimic (LA/RA reversal → negative P in I, inverted axis)
- False positive ST changes
- Misdiagnosis of blocks
Two International Color Standards (This Is Critical to Know!)
SYSTEM 1: AHA (American Heart Association) Standard
          Used in: USA, Canada

SYSTEM 2: IEC (International Electrotechnical Commission) Standard
          Used in: Europe (UK, Germany, France, India, most of Asia/Africa)
Limb Lead Color Codes
| Lead | Electrode | AHA Color | IEC Color |
|---|---|---|---|
| RA | Right Arm | WHITE | RED |
| LA | Left Arm | BLACK | YELLOW |
| RL | Right Leg (Ground) | GREEN | BLACK |
| LL | Left Leg | RED | GREEN |
- "White on Right" (White = Right Arm)
- "Riders On Black Horses" → Red-Others-Black-... (various)
- "Christmas colors across the top: White-Black, then Green-Red below"
- "Red Right" (Red = Right Arm) - in IEC
- "RYGB" = Red, Yellow, Green, Black = RA, LA, LL, RL
- Semaphore flag analogy: IEC colors match the semaphore signaling colors used in European maritime/electrical industries
Precordial Lead Colors
| Lead | AHA Color | IEC Color |
|---|---|---|
| V1 | Red | Red |
| V2 | Yellow | Yellow |
| V3 | Green | Green |
| V4 | Blue | Brown |
| V5 | Orange | Black |
| V6 | Purple/Violet | Violet |
What Happens When Leads Are Reversed (Lead Swap Artifacts)
- Lead I becomes inverted (negative P, negative QRS, negative T in I)
- aVR and aVL swap appearances
- Lead II becomes Lead III and vice versa
- Looks like dextrocardia but true dextrocardia shows poor R-wave progression (V1→V6 goes R→S, opposite of normal); lead reversal has normal chest lead progression
- Bizarre, very high-amplitude deflections
- Multiple leads affected simultaneously
4.4 EINTHOVEN'S TRIANGLE - THE MATHEMATICAL FOUNDATION
             RIGHT ARM          LEFT ARM
                  ●────────────────●
                  │                │
             Lead I                │
              (─)●     HEART       ●(+)
                  │       ○        │
                  │    (center)    │
                  │                │
                  └────────┬───────┘
                           │
                      LEFT LEG
                           ●

The three leads:
  Lead I:   Positive at LA, Negative at RA (measures left-right axis)
  Lead II:  Positive at LL, Negative at RA (measures upper-right to lower-left)
  Lead III: Positive at LL, Negative at LA (measures upper-left to lower-right)
Einthoven's Law
- Check if limb leads are correctly placed (violates the law if they're swapped)
- Calculate theoretical voltages
Augmented Leads (Wilson-Goldberger)
- Goldberger augmented this signal by 50% by disconnecting the reference lead
- "a" in aVR = augmented
- This gives 6 frontal plane leads (I, II, III, aVR, aVL, aVF) evenly separated by 30°
Precordial Leads (Wilson's Central Terminal)
- V1-V6 are unipolar leads: positive electrode on chest, reference = Wilson's central terminal
- These 6 leads cover the horizontal plane (axial slice through the heart)
- Together with 6 frontal leads → 12 views of the heart in 3D
4.5 WHY P, QRS, T? - THE COMPLETE STORY
What Each Wave Represents
THE CARDIAC ELECTRICAL CYCLE - MAPPING WAVES TO ANATOMY

     P wave
     │
     │ = Atrial depolarization
     │   (SA node → Both atria → AV node entrance)
     │   Duration 0.08-0.12 sec (3 small boxes max)
     │   Only atria depolarize during P
     │   Repolarization of atria is BURIED in the QRS (too small to see)
     │
     ▼
   ─────────
   PR segment
   │
   │ = AV node delay + Bundle of His conduction
   │   Electrically quiet on surface ECG (only small His spike detectable with intracardiac catheter)
   │
   ▼
   ─────────
   Q, R, S waves (collectively = QRS complex)
   │
   │ Q = first downward deflection of QRS
   │     = septal depolarization (septum depolarizes LEFT to RIGHT first)
   │       This moves AWAY from left-sided leads → negative = Q
   │
   │ R = first UPWARD deflection
   │     = main ventricular depolarization wave moving toward positive electrode
   │       Apex-to-base direction; endocardium to epicardium
   │
   │ S = downward deflection after R
   │     = basal ventricular depolarization moving away from electrode
   │
   │ Duration normal: < 0.12 sec (3 small boxes)
   │
   ▼
   ─────────
   ST segment
   │
   │ = Ventricular plateau phase (all cells depolarized)
   │   = Phase 2 of action potential across all ventricular cells
   │   Isoelectric because all ventricular cells are at same plateau voltage
   │   → No current flows between cells = no ECG deflection
   │   ANY ST deviation = pathological (current of injury = unequal cell voltages)
   │
   ▼
   ─────────
   T wave
   │
   │ = Ventricular REPOLARIZATION
   │   Why is it UPRIGHT (same direction as QRS)?
   │   Because repolarization goes EPICARDIUM → ENDOCARDIUM (REVERSE of depolarization!)
   │   Depolarization: Endocardium → Epicardium = upright QRS
   │   Repolarization: Epicardium → Endocardium = ALSO upright (same direction!)
   │   Net result: Upright T in same direction as R
   │
   ▼
   ─────────
   U wave (sometimes visible)
   │
   │ = Late ventricular repolarization
   │   Origin debated: Purkinje fiber repolarization? Or mid-myocardial M-cell repolarization?
   │   Normally: Same direction as T, smaller amplitude (< 1/4 of T height)
   │   Prominent U wave → Hypokalemia (most important cause)
   │   Inverted U wave → Ischemia (significant finding)
Why T Wave Direction Is the Same as QRS (The "Reverse Repolarization" Explanation)
If depolarization travels: ENDO → EPI
And produces POSITIVE deflection in left-sided leads (as QRS R wave)

Then if repolarization also went ENDO → EPI:
  It would produce NEGATIVE T wave (subtracting from the depolarized state)
  → T wave would be INVERTED

BUT repolarization actually goes EPI → ENDO (reverse direction!)
  Why? Epicardium has shorter action potential duration
       Epicardium repolarizes FIRST despite depolarizing LAST

So repolarization moving EPI→ENDO = wave traveling AWAY from epicardium = toward electrode
= POSITIVE deflection = UPRIGHT T WAVE!

Summary:
  Depolarization:  ENDO → EPI = positive deflection = R wave ↑
  Repolarization:  EPI → ENDO = same direction of wave movement = T wave ↑ (also positive!)
4.6 THE 12-LEAD SYSTEM - VISUAL MAP
FRONTAL PLANE (Limb leads) - view from the front:

         aVR    aVL
    ─150°  ─30°
           │
   ─180° ──┼──0° (Lead I)
           │
    +150°  +30°  +90°
           II  III aVF

HEXAXIAL REFERENCE SYSTEM:
Each lead is at 30° from the next:
    I:   0°     (horizontal left)
    II:  60°    (down-right)
    III: 120°   (down-left)
    aVR: -150°  (up-right)
    aVL: -30°   (up-left)
    aVF: +90°   (straight down)

TRANSVERSE PLANE (Chest leads V1-V6):

         V1  V2                    Left side →
           ●   ●
    RA ─●          ●─ LA           V3  V4  V5  V6
              ○                     ●   ●   ●   ●
              LV
╔══════════════════════════════════════════╗
║ CHAPTER 5: PATIENT PREPARATION ║
╚══════════════════════════════════════════╝
5.1 HOW TO PREPARE A PATIENT FOR ECG
Step-by-Step Protocol
- Explain the procedure: "This is a painless test. We place stickers on your chest, arms, and legs to record your heart's electrical activity. It takes about 5-10 minutes."
- Consent: Verbal consent usually sufficient (non-invasive)
- Remove jewelry/metal: Remove watches, bracelets (can cause artifact)
- Remove bra if applicable (underwire bras can interfere with V lead placement)
- Room temperature check: Cold room → shivering → massive muscle artifact
- Ask about medications: Document beta-blockers, antiarrhythmics, digoxin on the ECG request
- Patient lies SUPINE (flat on back), relaxed
- Arms at sides (not crossed - crossing arms changes limb lead angles)
- Legs straight and not crossed (leg crossing changes electrical axis of limb leads)
- Head on pillow (comfortable)
- Why supine? Standardized position; standing or sitting changes heart position relative to electrodes → affects axis and waveform morphology
Dry skin → abrade gently (slightly rough gauze or prep pad)
Oily skin → clean with alcohol, let dry
Hairy chest → shave electrode sites
Diaphoretic (sweaty) → dry skin; may need adhesive prep
Very thin patients → extra care - electrodes may be too close together (not important clinically)
LIMB LEADS:
  RA (Right Arm):  Inner right wrist or right forearm
  LA (Left Arm):   Inner left wrist or left forearm
  RL (Right Leg):  Inner right ankle or right lower leg (GROUND)
  LL (Left Leg):   Inner left ankle or left lower leg

CHEST LEADS - The Angle of Louis Method:
  1. Find the sternal angle (manubriosternal junction) = bony ridge on sternum
  2. From sternal angle, move finger laterally to RIGHT → find 2nd rib
  3. Count down: 2nd ICS, 3rd ICS, 4th ICS (at sternal border = V1 site)

  V1: 4th ICS, RIGHT sternal border
  V2: 4th ICS, LEFT sternal border
  V3: BETWEEN V2 and V4 (diagonal line connecting them)
  V4: 5th ICS, MIDCLAVICULAR LINE (left)
  V5: Same horizontal level as V4, ANTERIOR AXILLARY LINE
  V6: Same horizontal level as V4-V5, MID-AXILLARY LINE

IMPORTANT ERRORS TO AVOID:
  - V1/V2 TOO HIGH (3rd ICS instead of 4th): Creates "W" pattern and RBBB mimic
  - V4 too medial: Misses lateral ischemia
  - V5/V6 too high: Changes ST pattern
  - LA/RA swap (most common error): Inverts Lead I, mimics dextrocardia
- Ask patient to lie completely still and stop breathing for 10 seconds (reduce artifact)
- "Please lie still, relax your hands, and hold your breath for a moment"
- Do NOT talk to patient during recording
- Check for artifact: Look at baseline - should be flat, not wavy or noisy
Muscle artifact (somatic tremor):
  - Rapid, high-frequency noise on all leads
  - Cause: Anxiety, cold, Parkinson's disease, tremor
  - Solution: Warm room, relax patient, position limbs on pillow

Baseline wander:
  - Slow, rolling baseline
  - Cause: Breathing, movement, poor electrode contact, insufficient gel
  - Solution: Ask patient to stop breathing briefly; check electrode contact

AC interference (50/60 Hz artifact):
  - Regular, rapid sine-wave oscillation at exactly 50 or 60 Hz
  - Cause: Nearby electrical equipment, fluorescent lights, incorrectly grounded machine
  - Solution: Check ground electrode; use ECG filter; move away from electrical equipment

Lead artifact (single lead affected):
  - One lead has noise; others are clean
  - Cause: Loose electrode, broken lead wire
  - Solution: Check and replace that specific electrode/wire
5.2 HOW TO PREPARE A PATIENT FOR TMT
Pre-Test Preparation (Day Before + Day Of)
Day before:
  - No heavy meals for 4 hours before test
  - No alcohol or caffeine for 24 hours (caffeine can cause false negatives - adenosine antagonist)
  - Continue usual medications UNLESS physician instructs to withhold
    (Beta-blockers are usually held 48 hours before diagnostic TMT - blunts HR response)
  - Wear comfortable walking shoes and loose clothes
  - No smoking for 3 hours before test

Day of test:
  - Light meal only (not just before test - exercise + full stomach = nausea)
  - Report any new chest pain, worsening symptoms to staff immediately
  - Inform if had any new symptoms since last visit
- History review: Recent angina? New symptoms? Contraindications?
- Vitals: Resting BP, HR, SpO2
- Resting 12-lead ECG: Essential baseline
- If resting ECG shows LBBB → TMT for ischemia cannot be interpreted! Use imaging stress test instead
- If resting ST changes present → document and classify (baseline)
- If WPW → Cannot interpret ST changes (use imaging instead)
- Consent: Patient must understand risks (1:10,000 risk of MI, 1:10,000 risk of death - extremely rare)
- IV access: Large-bore IV in antecubital fossa - for emergency drug access
- Emergency equipment check: Crash cart (defibrillator, atropine, amiodarone, adrenaline, IV fluids), resuscitation equipment MUST be in the room
- Electrode placement: Same as standard 12-lead but special TMT electrodes used (more adhesive; wires managed for exercise)
- Explain the test: "We'll gradually increase speed and incline every 3 minutes. Tell us about any chest pain, dizziness, or discomfort. You can stop at any time by saying so or pressing the stop button."
- Patient must hold treadmill rails ONLY for balance (not grip tightly - affects HR response)
- Continuous ECG monitoring
- BP at end of each stage
- Borg scale for exertion: Ask "0-10, how hard are you working?"
- Document symptoms at each stage
- Continue monitoring for 8-10 minutes recovery
- ST changes in recovery are still meaningful
- Patient should not leave until:
- HR is within 20 bpm of resting rate
- ST changes have resolved or returned to baseline
- BP has normalized
- No symptoms
5.3 HOW TO PREPARE A PATIENT FOR HOLTER
Equipment Setup
- Device size: ~smartphone-sized (modern), weight ~50-100 g
- Battery: Long-life lithium, 24-48 h
- Memory: Flash memory card (digital, no moving parts like old cassette)
- Electrodes: Usually 5-7 leads used (record 2-3 channels)
Patient Preparation
Electrode positions for standard 3-channel Holter:
  Channel 1: Modified Lead V1 (RA + LA equivalent on upper chest)
             Positive: Left side 4th ICS midclavicular area
             Negative: Right side upper chest

  Channel 2: Modified Lead V5 (RA + LL equivalent)
             Positive: Left side 5th ICS anterior axillary line
             Negative: Left shoulder area

  Channel 3: Inferior-equivalent lead (RA + LL)
             Positive: Left lower chest/subcostal
             Negative: Right shoulder area

For 12-lead Holter (more modern):
  All 10 electrodes placed as per standard ECG
  Special recording vest or patches used
GIVE PATIENT A DIARY (paper or app):
"Please write down:
  1. Time and nature of all symptoms (palpitations, chest pain, dizziness, syncope)
  2. Your activities (sleeping, walking, exercise, meals)
  3. Medications taken and timing
  4. Any event you want the technician to analyze - press the EVENT BUTTON!"

ACTIVITY INSTRUCTIONS:
  - Continue ALL normal activities including exercise
  - AVOID: Showers/baths (damage device) - sponge bath only
  - AVOID: Metal detectors (airports) - inform security
  - AVOID: Electrical blankets, MRI during recording
  - AVOID: Tightly fitted clothing over device - may dislodge electrodes

ELECTRODE CARE:
  - Do NOT remove electrodes
  - If electrode falls off → call the lab (recording may be incomplete)
  - Mild skin irritation is expected - normal; apply hydrocortisone after removal

RETURN:
  - Return device at scheduled time (24h, 48h, or as instructed)
  - Bring completed diary
- Download data from device → computer analysis software
- Software automatically detects: PVCs, PACs, pauses, rate changes, AF
- Technician reviews all auto-detected events + patient diary events
- Cardiologist interprets final report
5.4 HOW TO PREPARE A PATIENT FOR ECHOCARDIOGRAPHY
Pre-Echo Preparation (Mostly Minimal)
Instructions:
  - No fasting required for routine TTE
  - No medication changes
  - Wear comfortable clothing (will need to remove shirt/blouse)
  - Remove necklaces and chest jewelry

Exception - Stress Echo (Dobutamine/Exercise):
  - Fasting 3-4 hours before (contrast agent may be needed; also avoid nausea from stress)
  - Hold beta-blockers if diagnostic (blunts dobutamine effect)

Exception - Contrast Echo:
  - Perflutren (Definity, Optison) contrast - rare allergy possible
  - Screen for: Cardiac shunts (PFO contraindicated for some contrast agents)
  - IV access needed
MANDATORY:
  1. FASTING: 6 hours food, 2 hours clear liquids (aspiration risk!)
  2. IV access
  3. Informed consent (semi-invasive procedure)
  4. Dental/gum disease screen (probe passes through mouth)

CONTRAINDICATIONS TO TEE:
  - Active esophageal/gastric disease (stricture, varices, cancer, recent surgery)
  - Uncooperative patient
  - Unstable hemodynamics (relative)

PROCEDURE:
  - IV midazolam/fentanyl for sedation
  - Throat spray with lidocaine
  - Bite guard placed
  - Patient positioned left lateral decubitus
  - Monitor SpO2, BP, ECG throughout

RECOVERY:
  - 30-60 minutes after sedation
  - Must not drive for 24 hours
  - No eating for 1 hour after procedure (until gag reflex returns)
  - Sore throat for 24-48 hours is normal
- Dim lights (improves image visibility on monitor)
- Patient lies in left lateral decubitus position for most cardiac windows
- Why left lateral? Rotates the heart leftward, closer to chest wall → reduces the air gap between transducer and heart → better acoustic window
- Transducer gel (same principle as ECG gel - acoustic coupling agent to exclude air)
- Both reduce impedance (acoustic vs electrical)
- Echo gel: more viscous, water-based gel for ultrasound coupling
- ECG gel: typically also water-based with electrolytes for electrical conduction
- They are functionally similar in principle - different impedances they address:
- ECG gel: electrical impedance (Ω)
- Echo gel: acoustic impedance (Rayl) - reduces acoustic mismatch between transducer and skin
╔══════════════════════════════════════════╗
║ CHAPTER 6: INTERRELATIONSHIPS - ║
║ HOW EVERYTHING CONNECTS AND AFFECTS ║
║ EVERYTHING ELSE ║
╚══════════════════════════════════════════╝
6.1 THE GRAND UNIFIED PICTURE
╔══════════════════════════════════════════════════════════════════╗
║                    THE HEART                                     ║
║                                                                  ║
║  ANATOMY ←────────────── ECHO visualizes directly               ║
║  (chambers, valves,                                             ║
║   wall thickness)                                               ║
║         ↕                                                        ║
║  PHYSIOLOGY ←─────────── ECHO (EF, E/e', PASP, valves)         ║
║  (pump function,                                                 ║
║   pressures, flows)                                             ║
║         ↕                                                        ║
║  ELECTROPHYSIOLOGY ←──── ECG, HOLTER                           ║
║  (rhythm, conduction,                                           ║
║   repolarization)                                               ║
║         ↕                                                        ║
║  PERFUSION (ISCHEMIA) ←── TMT, Stress Echo, Nuclear            ║
║  (coronary blood flow,                                          ║
║   myocardial oxygen supply/demand)                              ║
╚══════════════════════════════════════════════════════════════════╝
6.2 HOW STRUCTURAL CHANGES AFFECT EACH INVESTIGATION
Hypertension → LVH → Multiple Test Changes
CAUSE: Chronic pressure overload (↑ afterload)
  ↓
PATHOLOGY: LVH (concentric hypertrophy, RWT ≥0.42, LV mass increased)
  ↓
ECHO CHANGES:
  • IVSd and PWTd ≥ 1.2 cm (mild) → ≥ 1.5 cm (severe)
  • Concentric geometry (RWT >0.42)
  • LVEDD normal or small (not dilated)
  • EF initially preserved (↑ or normal)
  • Diastolic dysfunction Grade I (impaired relaxation, e' ↓, DT >220 ms)
  • Eventually Grade II-III as LV stiffens
  ↓
ECG CHANGES:
  • LVH voltage criteria (Sokolow ≥35 mm, Cornell ≥28 mm men)
  • LAD
  • LAE (PR prolongation, biphasic P in V1)
  • Strain pattern (ST depression + T inversion in I, aVL, V5-V6)
  • Increasing QRS duration (0.10-0.11 sec)
  ↓
TMT CHANGES:
  • Higher false positive rate (LVH baseline ST changes)
  • Higher peak pressure response (SBP may exceed 250 mmHg)
  • Abnormal diastolic response to exercise
  ↓
HOLTER CHANGES:
  • Increased PVC burden (LVH creates ectopic focus)
  • Paroxysmal AF (from LAE → LA stretch → AF substrate)
  • Reduced HRV (autonomous imbalance)
Myocardial Infarction → Multiple Test Signatures
CAUSE: Coronary occlusion → myocardial necrosis
  ↓
ACUTE PHASE (Hours):
  ECG: Hyperacute T → ST elevation → Q waves forming
  ECHO: RWMA (akinesis/hypokinesis of territory)
  TMT: CONTRAINDICATED acutely
  HOLTER: Frequent PVCs, NSVT, VF risk
  ↓
SUBACUTE (Days-Weeks):
  ECG: Q waves deep, T inversion, ST normalizing
  ECHO: RWMA persists; early systolic dysfunction; pericardial effusion possible
  BIOMARKERS: Troponin peak and fall; CK-MB; BNP rising if EF falls
  ↓
CHRONIC (Months-Years):
  ECG: Persistent Q waves (scar); T inversion may normalize; arrhythmias
  ECHO:
    - If remodeled: LV dilation (eccentric hypertrophy), ↓EF
    - Scar: Thinned, echobright, akinetic wall segment
    - Possible LV aneurysm (dyskinetic bulge)
    - LV thrombus in apex if akinetic
    - Functional MR (papillary muscle displacement)
  TMT: Can show residual ischemia in other territories
  HOLTER: NSVT, PVC burden → ICD if EF ≤35%
Atrial Fibrillation → Impact on All Tests
CAUSE: Multiple (hypertension, MS, heart failure, hyperthyroidism, idiopathic)
  ↓
ECG:
  • Irregularly irregular rhythm
  • No P waves → fibrillatory baseline
  • Variable RR intervals
  ↓
ECHO:
  • LA enlargement (cause or effect)
  • LA appendage thrombus (TEE needed!)
  • Reduced LV EF if persistent/permanent AF (tachycardia-induced cardiomyopathy)
  • Mitral valve assessment (MS or MR causing AF)
  • If EF low + AF → functional MR (secondary)
  ↓
TMT:
  • Rate may not be controlled → irregular, fast → difficult to interpret
  • Target HR (85% MPHR) may not be meaningful in AF
  • BP may fluctuate beat-to-beat
  ↓
HOLTER:
  • Quantify AF burden (% time in AF)
  • Detect paroxysmal AF (not obvious on resting ECG)
  • Guide cardioversion planning (>48h AF burden → anticoagulation needed)
6.3 ARRHYTHMIA MECHANISMS AND HOW THEY APPEAR ON EACH TEST
The Three Mechanisms of All Arrhythmias
MECHANISM 1: ABNORMAL AUTOMATICITY
  - Enhanced automaticity in normally automatic cells (SA, AV, Purkinje)
    OR automaticity in normally non-automatic cells (atrial/ventricular muscle)
  - Seen in: Ischemia (abnormal automaticity), DCCM, digitalis toxicity
  - ECG pattern: Fixed rate ectopic beats with variable coupling intervals
  - Example: PVCs, junctional tachycardia, accelerated idioventricular rhythm

MECHANISM 2: TRIGGERED ACTIVITY
  (a) Early Afterdepolarizations (EADs) - occur during Phase 2 or 3
      - Interruptions in repolarization → reactivate Ca2+ channels
      - Seen in: Long QT syndrome (drug-induced or congenital)
      - ECG: Torsades de Pointes (EAD → TdP as shown in the diagram above)
      - Pause-dependent: Bradycardia makes QT longer → EAD more likely

  (b) Delayed Afterdepolarizations (DADs) - occur in Phase 4
      - Ca2+ overload → NCX activates → inward current → depolarization
      - Seen in: Catecholamine excess, digitalis toxicity, ischemia
      - Rate-dependent: Faster rates make Ca2+ overload worse
      - ECG: Catecholaminergic polymorphic VT, digitalis-toxic arrhythmias

MECHANISM 3: REENTRY (Most Common Mechanism of Clinical Tachyarrhythmias!)
  Requirements:
  - Two pathways with different conduction speeds and refractory periods
  - Unidirectional block in one pathway
  - Slow enough conduction to allow recovery of the blocked pathway

  Examples:
  - AVNRT: Slow path and fast path within AV node
  - AVRT (WPW): Accessory pathway vs AV node
  - Atrial flutter: Around the cavotricuspid isthmus
  - VT post-MI: Reentry around scar tissue border zone
  - AF: Multiple wavelets of reentry in atria
6.4 COMPLETE VISUAL CORRELATION DIAGRAM
NORMAL ACTION POTENTIAL           ←→      NORMAL ECG SEGMENT

Phase 4 (resting potential)       ←→      Isoelectric line (TP segment)
Phase 0 (depolarization)          ←→      QRS (rapid vertical)
Phase 1 (early repolarization)    ←→      End of QRS
Phase 2 (plateau)                 ←→      ST segment (flat)
Phase 3 (repolarization)          ←→      T wave
Recovery to Phase 4               ←→      TP segment again

ABNORMALITIES:
  Phase 0 blocked (Na channel)    →       Prolonged QRS (LBBB, Class I drugs)
  Phase 2 prolonged               →       Long QT (early)
  Phase 3 blocked (K channel)     →       Long QT (late)
  Phase 4 enhanced                →       Escape rhythms, PVCs
  SA node automaticity ↓         →       Sinus bradycardia
  AV node conduction ↓           →       Prolonged PR → Heart block
6.5 HOW ELECTROLYTES AFFECT EVERYTHING
POTASSIUM (K+):
  The most important electrolyte for cardiac electrical stability

  Normal intracellular K+ ≈ 140 mEq/L
  Normal extracellular K+ ≈ 4.0 mEq/L
  Ratio of ~35:1 determines resting membrane potential

  Hypokalemia:
  → Resting potential more negative (hyperpolarized)
  → Phase 3 prolonged (less K+ out during repolarization)
  → ECG: Flattened T + prominent U wave + apparent QT prolongation
  → Risk: Reentry arrhythmias, TdP, PVCs
  → ECHO: May show subtle wall motion changes in severe cases
  → HOLTER: PVC burden increases

  Hyperkalemia:
  → Resting potential less negative (depolarized)
  → Phase 0 impaired (fast Na channels inactivate at less negative voltage)
  → ECG progression: Peaked T → flat P → wide QRS → sine wave → VF
  → ECHO: Not directly visible but may see dyskinesis if cardiac arrest near
  → TMT: CONTRAINDICATED in significant hyperkalemia

CALCIUM (Ca2+):
  Affects Phase 2 duration

  Hypercalcemia:
  → Phase 2 shorter → Short QT
  → ECG: Short QT interval; Osborn-like J waves in severe
  → Risk: Bradyarrhythmias at very high levels

  Hypocalcemia:
  → Phase 2 prolonged → Long QT
  → ECG: ST segment prolonged (not T wave directly)
  → ECG: Specific: Long isoelectric ST segment → QT prolongation
  → Risk: TdP if severe

MAGNESIUM (Mg2+):
  Stabilizes K+ and Na+ channels

  Hypomagnesemia:
  → Impairs Na/K-ATPase → secondary hypokalemia
  → ECG: Same as hypokalemia + more arrhythmia risk
  → Treatment of TdP: IV Mg even with normal Mg level (membrane stabilizer)
FINAL INTEGRATION DIAGRAM: THE COMPLETE CARDIAC EXAMINATION FLOW
PATIENT PRESENTS WITH CARDIAC SYMPTOMS
           ↓
HISTORY + PHYSICAL EXAMINATION
(Murmurs, JVP, pulse character, signs of HF)
           ↓
┌──────────────────────────────────────────────────────┐
│             INITIAL INVESTIGATIONS                    │
│                                                      │
│  12-LEAD ECG → Rhythm, Ischemia, Conduction, Axis   │
│  CXR → Cardiac size, pulmonary vascularity          │
│  Bloods → Troponin, BNP, electrolytes, TFTs         │
└──────────────────┬───────────────────────────────────┘
                   ↓
            ECHO (TTE)
  ┌─────────────────────────────────┐
  │ Is EF reduced? → HFrEF workup  │
  │ Wall motion abnormal? → Ischemia│
  │ Valve disease? → Quantify       │
  │ Structural disease? → Classify  │
  └──────────┬──────────────────────┘
             ↓
   Based on findings:

   ┌───────────────────────────────────────────────────┐
   │ Suspected CAD + intermediate probability?         │
   │ → TMT (if ECG interpretable + can exercise)       │
   │ → Pharmacological stress echo/nuclear (if not)    │
   └───────────────────────────────────────────────────┘

   ┌───────────────────────────────────────────────────┐
   │ Palpitations / syncope / arrhythmia suspected?    │
   │ → 24-48h Holter (if daily symptoms)               │
   │ → 30-day event monitor (if weekly)                │
   │ → ILR implant (if rare syncope over months)       │
   └───────────────────────────────────────────────────┘

   ┌───────────────────────────────────────────────────┐
   │ Cryptogenic stroke?                               │
   │ → Extended monitoring (30 days minimum)           │
   │ → Looking for paroxysmal AF                       │
   └───────────────────────────────────────────────────┘

   ┌───────────────────────────────────────────────────┐
   │ Valvular disease?                                  │
   │ → Serial TTE (interval depends on severity)       │
   │ → TEE before cardioversion, pre-surgery           │
   │ → TEE for IE, aortic dissection, pre-ablation     │
   └───────────────────────────────────────────────────┘
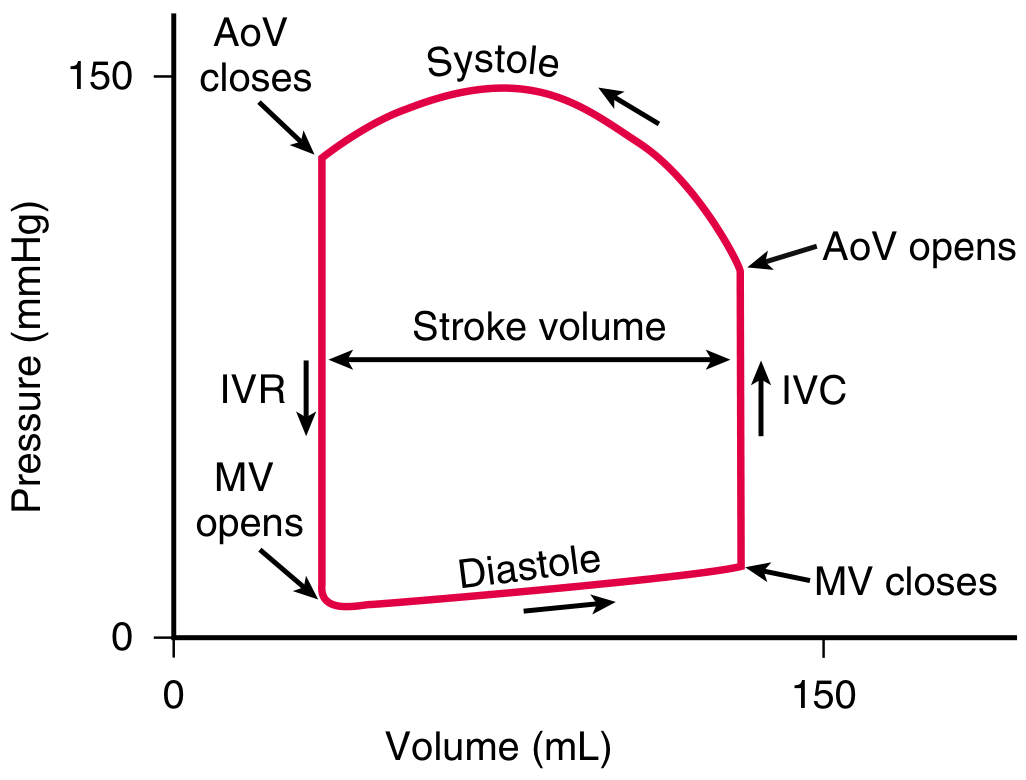
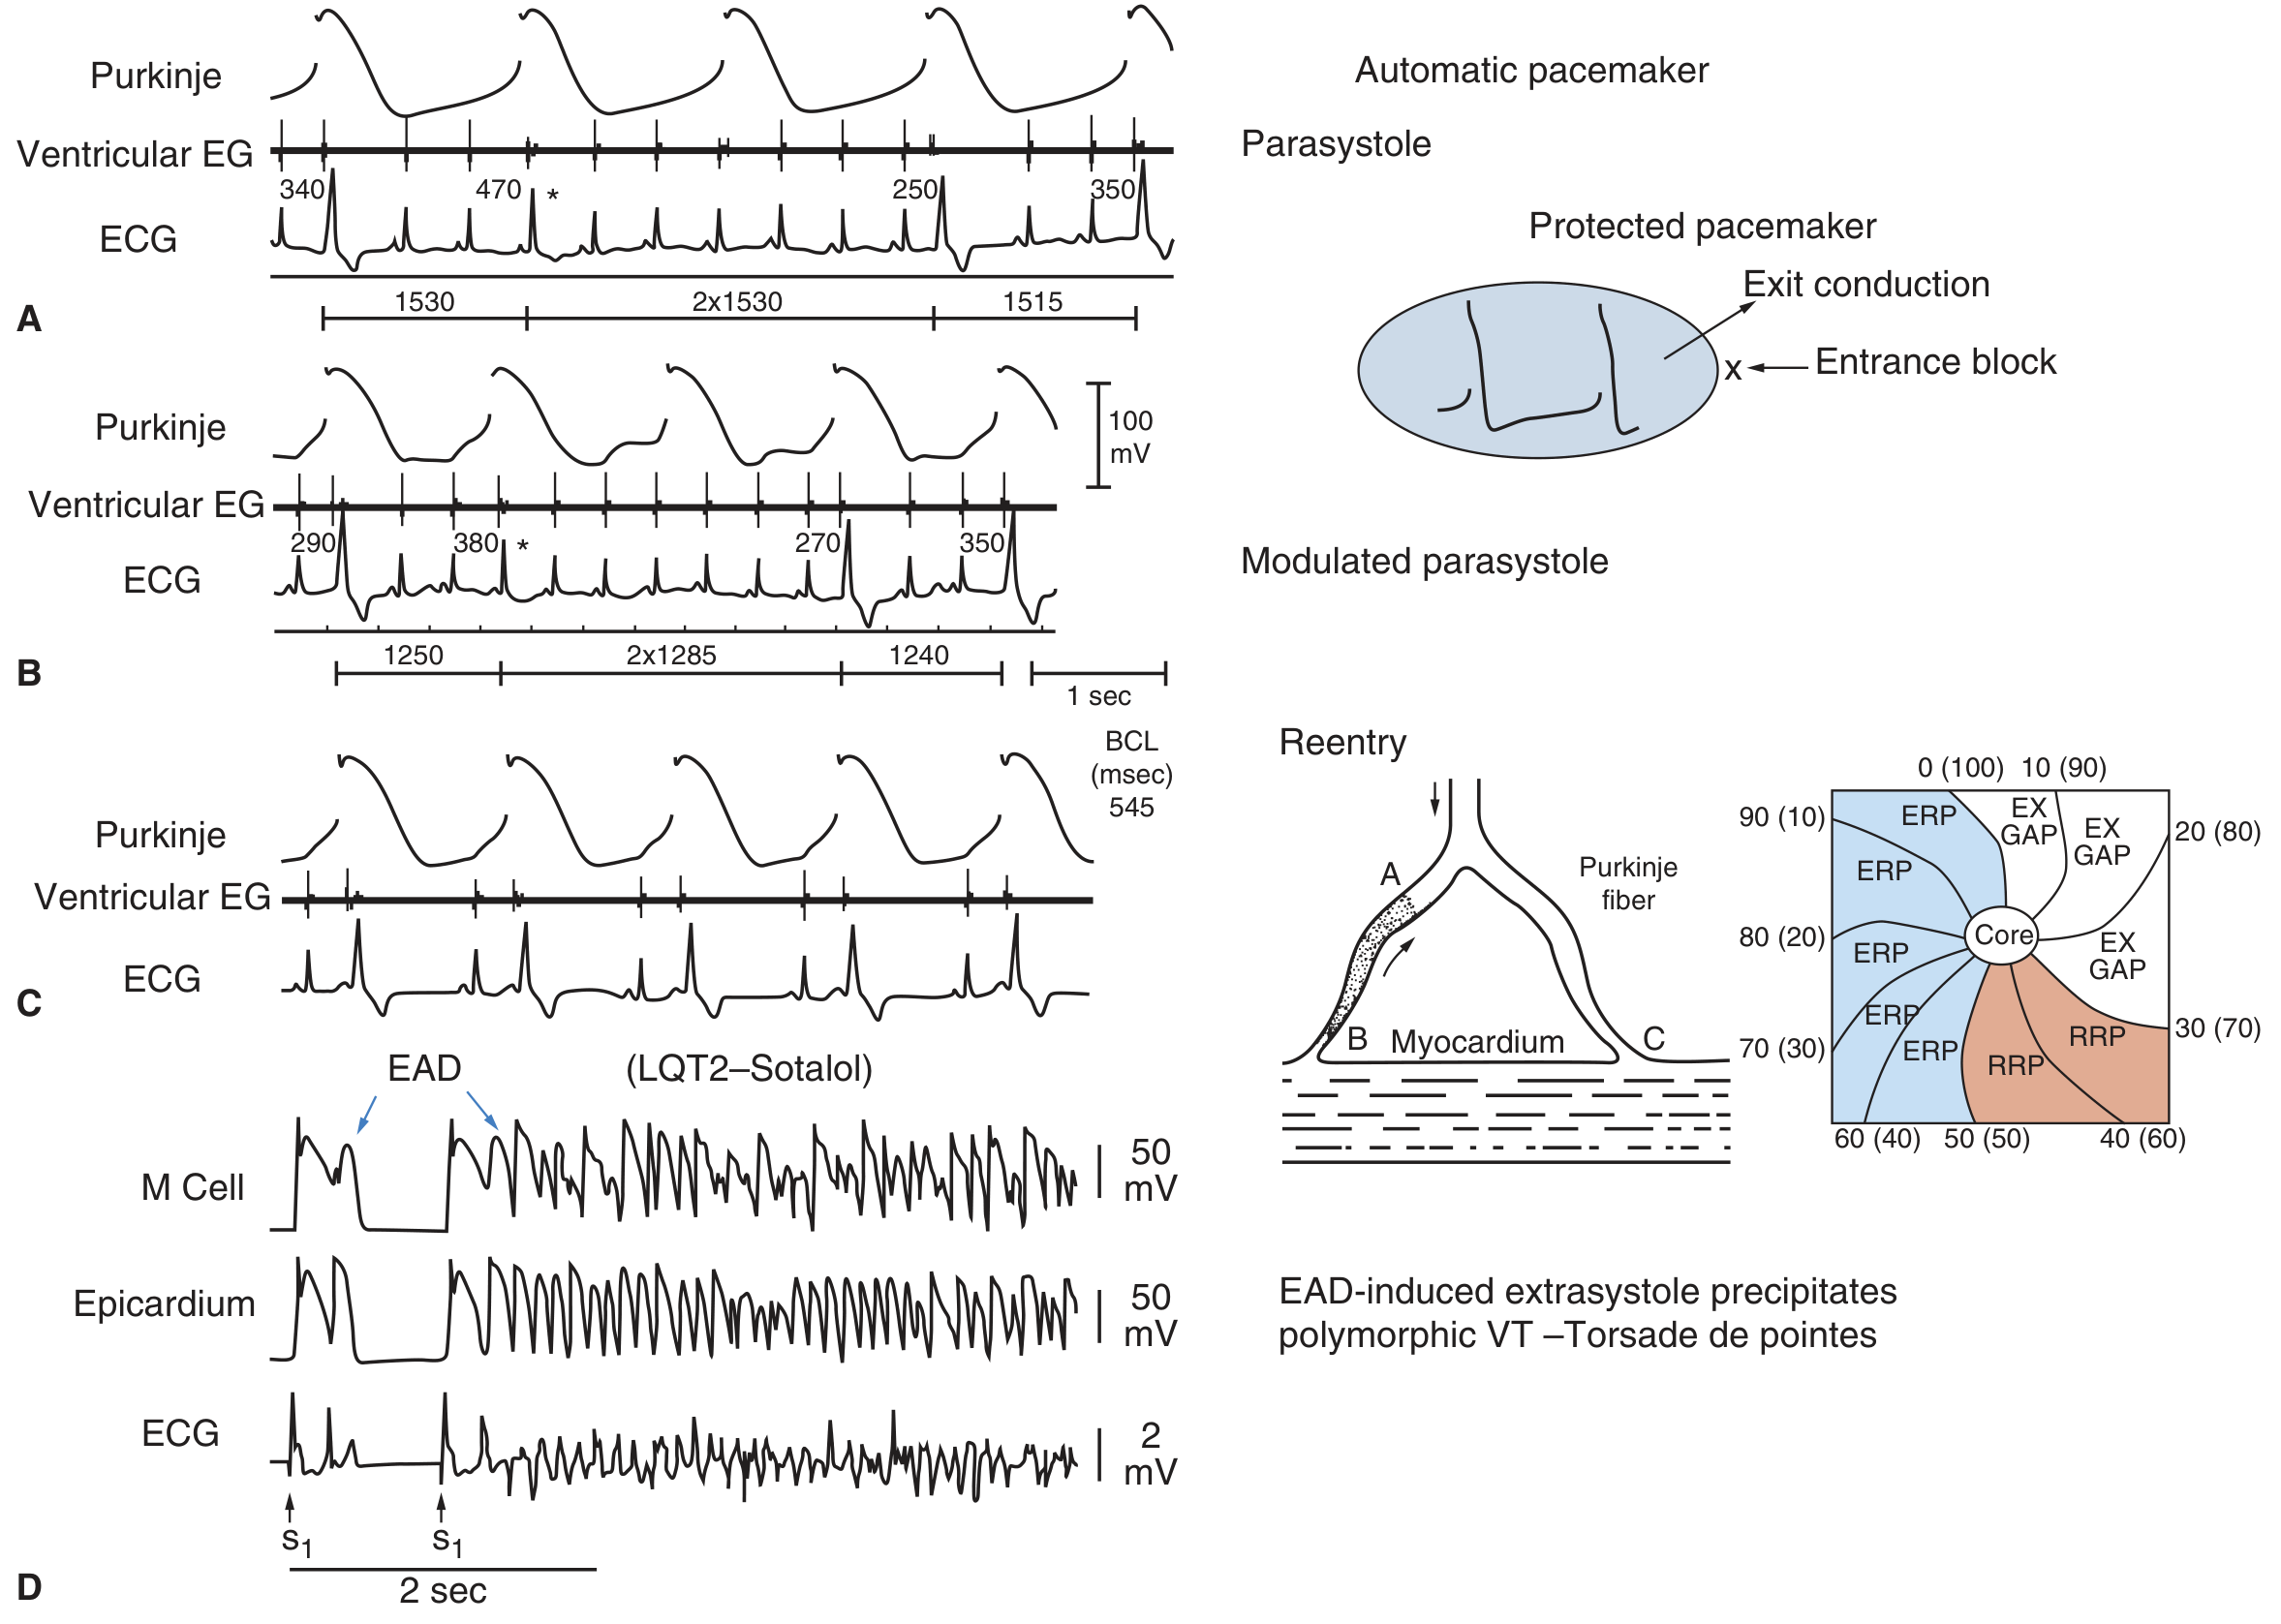
Complete Chapter Map of This Edition
Chapter 0 - History of Cardiology (The Full Timeline)
- Ancient Egypt (1550 BCE) → Ebers Papyrus; heart as center of life
- Aristotle (384 BCE) → wrong about brain cooling, correct about heart as center
- Ibn al-Nafis (1213 CE) → FIRST to describe pulmonary circulation (300 years before Harvey!)
- William Harvey (1628) → "De Motu Cordis" - quantitative proof of systemic circulation; Father of Modern Cardiology
- René Laennec (1816) → Invented the stethoscope from rolled paper
- Luigi Galvani (1791) → Discovered bioelectricity (frog legs experiment)
- Augustus Waller (1887) → First human ECG recording; his dog Jimmie was the first ECG "patient"
- Einthoven (1893-1924) → Named PQRST; String galvanometer; Nobel Prize 1924
- WHY PQRST NOT ABCDE - full 3-theory explanation (Descartes convention; room for future waves; practical reason - he already used A-D for the uncorrected tracing)
- History of Holter (Norman Holter 1914-1983; 38 kg backpack 1949 → modern patch)
- History of TMT (Master's Two-Step 1929 → Bruce Protocol 1956)
- History of Echo (Edler + Hertz 1953; borrowed industrial reflectoscope; "Father of Echocardiography")
Chapter 1 - What Is the Heart
- Heart = 100,000 beats/day, 2.5 billion in a lifetime, 60,000 miles of vessels
- Precise location (mediastinum, 2/3 left of midline, apex at 5th ICS MCL)
- Why the heart is tilted left (embryonic cardiac tube looping on day 23-28)
- Detailed 3-layer diagram (pericardium → myocardium → endocardium)
- All 4 chambers with internal landmarks (crista terminalis, fossa ovalis, moderator band, LA appendage)
- Valves - mechanism of opening/closing, MV leaflets (P1/P2/P3), aortic cusp anatomy and why Valsalva sinuses exist
Chapter 2 - Circulation
- Dual circulation diagram with pressures
- Coronary circulation in depth: LMCA → LAD (septal perforators + diagonals) + LCx (marginals); RCA (SA nodal artery + AV nodal artery + PDA)
- Coronary dominance (70% right, 15% left, 10-15% co-dominant) - why it matters clinically
- Ischemia Cascade diagram (seconds → diastolic dysfunction → wall motion → ECG → symptoms → necrosis → troponin) - explains timing for all tests
- Coronary → ECG → Echo wall segment correlation table
Chapter 3 - Conduction System
- Full conduction pathway diagram with locations, blood supply, intrinsic rates, speeds
- SA node (60-100 bpm; SA nodal artery); AV node (40-60 bpm; Koch's triangle); His bundle; RBB (moderator band!); LBB (3 fascicles); Purkinje (4 m/s fastest)
- Ventricular AP graph: all 5 phases with ions (INa, Ito, ICaL, IKr/IKs, IK1) + corresponding QT segments
- SA node AP graph: pacemaker potential, funny current (If), HCN channels, ivabradine mechanism
- Hierarchy of automaticity explained
- Conduction block at each level → ECG pattern summary
Chapter 4 - ECG Fundamentals
- ECG paper complete - 25 vs 50 mm/sec tables; thermosensitive paper; small box = 0.04 sec, large box = 0.20 sec (at 25mm/sec)
- Voltage calibration - 10mm = 1mV; double/half standard; always check calibration box
- ECG Gel chemistry - NaCl electrolytes, carbomer thickener, why it works (reduces skin impedance 100,000 Ω → 1,000 Ω)
- Electrode types (disposable self-adhesive Ag/AgCl hydrogel vs reusable suction)
- TWO COLOR CODING STANDARDS - AHA vs IEC full table for all 10 leads; mnemonics; consequences of lead reversal (mimics dextrocardia)
- Einthoven's Triangle - mathematical derivation; Einthoven's Law (II = I + III); augmented leads
- PQRST wave-by-wave explanation with why T is upright (reverse repolarization: EPI→ENDO repolarization + ENDO→EPI depolarization = both produce upward deflection in left-sided leads)
- U wave origin (Purkinje / M-cell repolarization)
Chapter 5 - Patient Preparation
- ECG: Supine position (why), skin prep steps, artifact recognition and causes (muscle, wander, AC interference)
- TMT: Day-before instructions, in-lab pre-test protocol, emergency equipment checklist, during and post-test monitoring
- Holter: Electrode positions (3-channel), patient diary instructions, activity restrictions, return protocol
- Echo: TTE (minimal prep), contrast echo, TEE full protocol (6-hour fast, sedation, bite guard, left lateral decubitus, post-procedure gag reflex recovery)
Chapter 6 - Interrelationships
- Grand unified diagram: Anatomy ↔ Echo; Physiology ↔ Echo; Electrophysiology ↔ ECG/Holter; Perfusion ↔ TMT/Stress Echo
- How Hypertension → LVH → affects all 4 tests simultaneously
- How MI → affects all 4 tests across acute/subacute/chronic phases
- How AF → affects all 4 tests
- 3 mechanisms of ALL arrhythmias (automaticity, triggered [EAD/DAD], reentry) with ECG examples
- Electrolytes (K+, Ca2+, Mg2+) → exactly how each affects AP phases → exactly what ECG changes result
- Complete cardiac examination flow diagram (when to order which test in which sequence)
By analysing all previous conversation make it the perfect guided master class notes topic wise perfect in easy language and extremely elaborated well detailed information, explanations and defination. Including all the answers of how,why,when and further more.
?