
How to read MRI plates
how to read MRI plates interpretation guide radiology
MRI sequences T1 T2 brain comparison axial
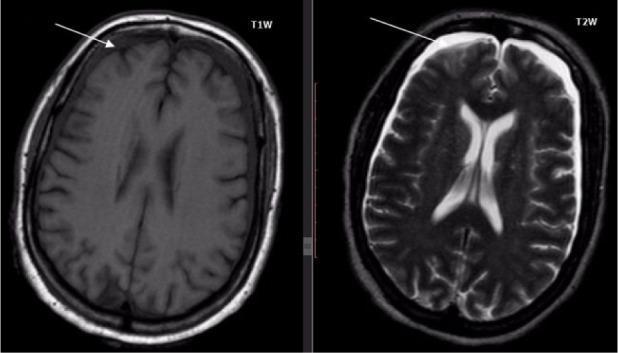
Diagnostic axial brain MRI comparing T1-weighted (T1W) and T2-weighted (T2W) sequences. The images demonstrate a thin, crescentic subdural collection extending bilaterally across the frontoparietal convexities. On the T1W sequence (left), the collection is hypointense (dark) relative to the gray matter. On the T2W sequence (right), the collection is markedly hyperintense (bright), mimicking the signal intensity of cerebrospinal fluid. White arrows on both images highlight the anterior extent of the collection. The wide distribution and signal characteristics are indicative of a subdural effusion or empyema (SDE). There is a slight effacement of the underlying cortical sulci without significant midline shift or ventricular compression at this level. This comparison illustrates the importance of multi-sequence imaging in identifying extra-axial fluid collections and differentiating their composition based on signal intensity changes.
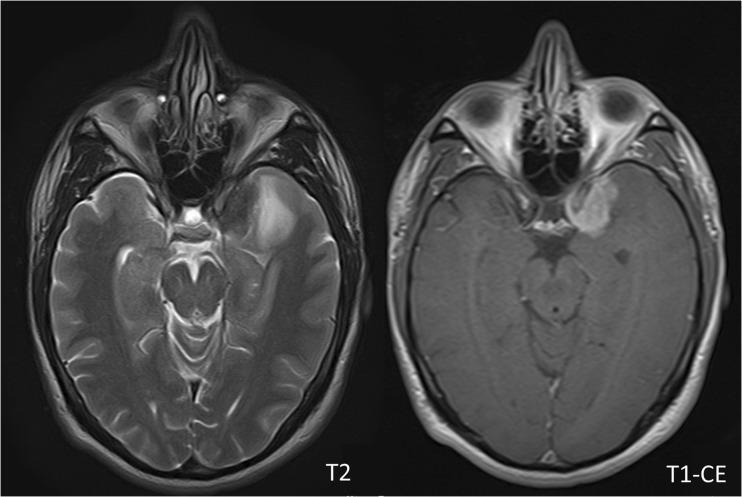
Diagnostic axial MRI of the brain comparing T2-weighted and T1-weighted contrast-enhanced (T1CE) sequences in a 41-year-old male with a WHO Grade II meningioma. The lesion is located at the left medial sphenoid wing. On the T2-weighted image (left), the tumor presents as a hyperintense (bright) mass with well-defined borders and associated mild peritumoral edema, visible as a surrounding high-signal intensity region in the adjacent brain parenchyma. On the T1CE image (right), the meningioma demonstrates intense, relatively homogeneous gadolinium enhancement, characteristic of this extra-axial tumor entity. The anatomical region clearly shows the skull base, temporal lobes, and brainstem. This image pair serves as an educational example of how different MRI sequences highlight specific tumor characteristics: T2 for evaluating peritumoral edema and T1CE for assessing vascularity and tumor margins through contrast uptake. This comparison is clinically significant for neuroradiological assessment and neurosurgical planning for skull base tumors.
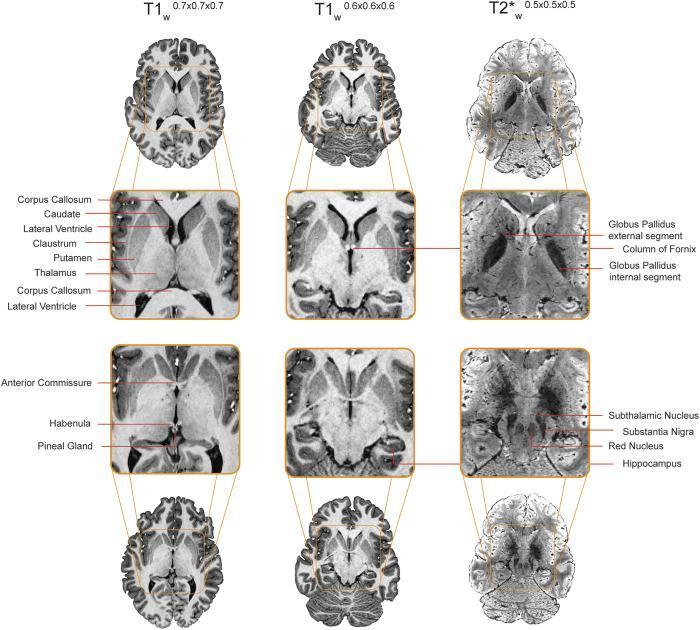
Diagnostic neuroimaging comparison featuring three axial MRI sequences of a human brain at varying spatial resolutions: T1-weighted (0.7mm³ and 0.6mm³) and T2*-weighted (0.5mm³). The image illustrates the differential contrast and visibility of subcortical structures based on sequence weighting. In the T1-weighted columns, there is high contrast between gray and white matter, clearly delineating the Corpus Callosum, Caudate, Putamen, Thalamus, Claustrum, and the dark signal of the Lateral Ventricles. The T2*-weighted column displays a different contrast profile, where fluid in the ventricles appears brighter and iron-rich structures are more prominently visualized. Key labels in the T2* sequence identify deep brain nuclei including the Globus Pallidus (internal and external segments), Subthalamic Nucleus, Substantia Nigra, and Red Nucleus, alongside the Hippocampus and Column of Fornix. Other labeled midline structures include the Anterior Commissure, Habenula, and Pineal Gland. This comparison highlights the clinical necessity of multi-modal MRI acquisition for comprehensive evaluation of subcortical anatomy and pathology.
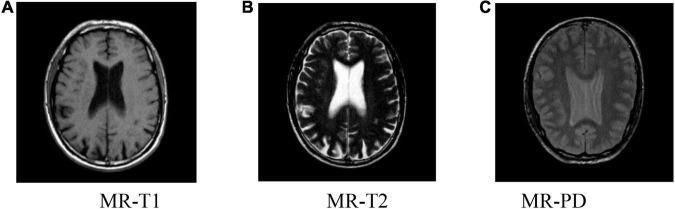
Diagnostic axial MRI brain scans illustrating three standard imaging sequences: T1-weighted (MR-T1), T2-weighted (MR-T2), and Proton Density (MR-PD). The comparison demonstrates distinct signal intensities for intracranial tissues. In the MR-T1 image (A), cerebrospinal fluid (CSF) within the lateral ventricles is dark (hypointense), while white matter is brighter (hyperintense) than gray matter. The MR-T2 image (B) shows a characteristic signal reversal, where CSF is bright (hyperintense) and the cortical ribbon is brighter than the underlying white matter. The MR-PD image (C) provides an intermediate contrast level, where CSF remains relatively bright but with reduced contrast between gray and white matter compared to T1. Anatomical structures including the lateral ventricles, cortical sulci, and deep gray matter nuclei are visible across all slices. This multi-sequence comparison is essential in neuroradiology for identifying pathology such as edema, demyelination, or vascular lesions by observing signal variations across different weighting modalities.
MRI planes axial sagittal coronal orientation
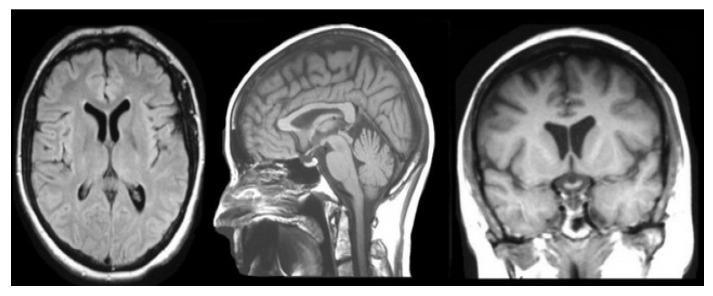
This diagnostic image provides a comprehensive anatomical overview of the human brain using magnetic resonance imaging (MRI) in three cardinal planes: axial, sagittal, and coronal. The axial view (left) demonstrates the symmetric cerebral hemispheres, gyri, sulci, and the butterfly-shaped lateral ventricles with dark signal intensity. The sagittal view (center) provides a midline perspective, clearly illustrating the C-shaped corpus callosum superior to the brainstem, the foliated structure of the cerebellum in the posterior fossa, and the vertical orientation of the brainstem and spinal cord. The coronal view (right) highlights the lateral ventricles and the slit-like third ventricle situated between the thalami, along with the vertical distribution of cerebral structures. These T1-weighted or FLAIR-like images emphasize tissue architectures, providing high-contrast detail between gray matter, white matter, and cerebrospinal fluid spaces. The visual is intended for neuroanatomical education and diagnostic training, focusing on spatial relationships and signal intensity variations in healthy brain tissue.
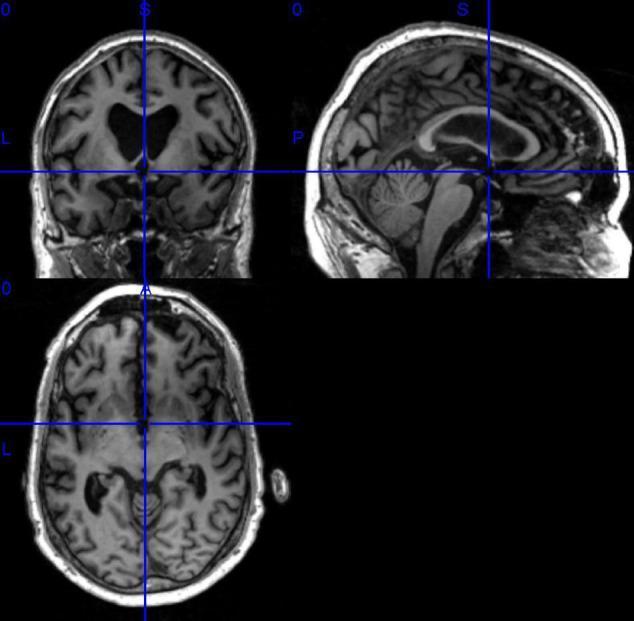
This diagnostic image displays a T1-weighted 3D MRI of the human brain presented in three orthogonal planes: coronal (top left), sagittal (top right), and axial (bottom left). The visualization uses cross-hair markers to indicate the precise anatomical intersection across these planes. The coronal view reveals the bilateral cerebral hemispheres, cortical gyri and sulci, and the central ventricular system. The sagittal view provides a midline perspective, clearly illustrating the cerebellum, brainstem (pons and medulla), corpus callosum, and the cingulate gyrus. The axial view displays a horizontal cross-section showing the basal ganglia regions, internal capsule, and the lateral ventricles. Tissue contrast demonstrates typical T1-weighting where gray matter appears darker than white matter, and cerebrospinal fluid (CSF) in the ventricles appears hypointense. Notably, the ventricles appear moderately enlarged, which is a feature often studied in the context of neurodegenerative conditions such as Alzheimer’s disease or Mild Cognitive Impairment (MCI). Blue orientation labels (S, I, L, R, A, P) facilitate anatomical referencing for neuroimaging research and clinical education.
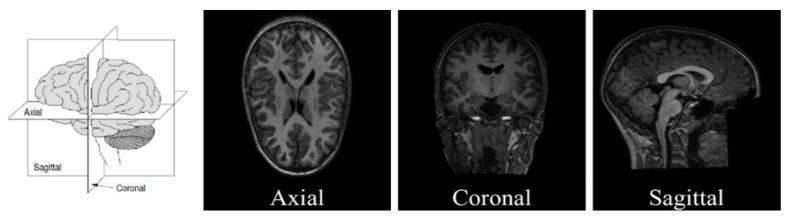
This educational graphic illustrates the primary anatomical planes used in neuroimaging, specifically structural MRI (sMRI). The figure consists of an anatomical diagram followed by three representative diagnostic images. The initial diagram demonstrates the three-dimensional orientation of the axial (transverse), coronal (frontal), and sagittal (longitudinal) planes relative to a human brain model. The subsequent panels present T1-weighted sMRI slices corresponding to these orientations: 1) Axial plane, showing a superior-to-inferior view with visible ventricles and symmetrical cerebral hemispheres; 2) Coronal plane, providing a front-to-back perspective highlighting the brain's vertical structures and cortical thickness; and 3) Sagittal plane, offering a lateral view of the midline structures including the brainstem, cerebellum, and corpus callosum. The educational focus is on standard radiological orientation and spatial classification of neuroanatomical data, essential for diagnostic workflows and computational neuroanalysis, such as Autism Spectrum Disorder (ASD) research.
How to Read MRI Plates
Step 1 - Verify Before You Interpret
- Patient details: name, DOB, hospital number
- Date and time: ensure you have the most recent study
- Body part and side: e.g., "left knee" vs. "right knee"
- Comparison: look for prior imaging to compare changes over time
Step 2 - Understand the Three Planes (Orientations)
| Plane | View | What it shows |
|---|---|---|
| Axial | Top-down (horizontal slices) | Best for bilateral comparison, masses, midline shift |
| Sagittal | Side view (left-right cut) | Best for spine, corpus callosum, brainstem, midline structures |
| Coronal | Front-to-back (vertical slice) | Best for temporal lobes, hippocampus, sinuses, pituitary |
Tip: On axial images, the patient's right is on your LEFT (radiological convention).
Step 3 - Know Your Sequences (The Most Important Step)
T1-Weighted
- Fat = bright (hyperintense)
- Water/CSF = dark (hypointense)
- Best for: anatomy, fat-containing lesions, post-contrast enhancement (with gadolinium, enhancing tissue appears bright)
- Mnemonic: "T1 = 1 bright tissue = FAT"
T2-Weighted
- Fat = bright
- Water/CSF = bright (hyperintense)
- Pathology (edema, tumors, inflammation) = bright
- Best for: detecting most pathology - anything with increased water content lights up
- Mnemonic: "T2 = 2 bright tissues = FAT and WATER"
FLAIR (Fluid-Attenuated Inversion Recovery)
- Like T2 but CSF is suppressed to black
- Lesions near CSF surfaces (e.g., periventricular MS plaques) stand out much more clearly
- Best for: white matter disease, MS, stroke, leptomeningeal disease
DWI (Diffusion-Weighted Imaging)
- Detects restricted diffusion (water molecules can't move freely)
- Restricted areas appear bright
- Best for: acute ischemic stroke (bright within minutes), abscess (bright core)
- Always paired with ADC map: lesion bright on DWI + dark on ADC = true restriction (infarct/abscess). Bright on both = T2 shine-through (not true restriction)
T2* / GRE (Gradient Echo)
- Very sensitive to blood products and calcification, which appear very dark (blooming artifact)
- Best for: hemorrhage, cavernous malformations, hemosiderin, microbleeds
Post-Contrast T1 (T1+Gad)
- After gadolinium injection, areas with blood-brain barrier breakdown enhance (turn bright)
- Best for: tumors, active inflammation, meningitis, abscesses, MS active plaques
Step 4 - Signal Intensity Terminology
| Term | Meaning |
|---|---|
| Hyperintense | Brighter than the reference tissue (appears white) |
| Hypointense | Darker than the reference tissue (appears dark/black) |
| Isointense | Same signal as reference tissue (often indistinguishable from surroundings) |
| Heterogeneous | Mixed signal within a lesion (complex pathology) |
Step 5 - Systematic Approach When Reading Any MRI
- Identify the sequence - Look at the label (T1, T2, FLAIR, DWI, etc.)
- Check all planes - Never read just one plane
- Compare left vs. right - Pathology is rarely perfectly bilateral
- Be methodical - Go region by region (e.g., for brain: cortex → white matter → ventricles → basal ganglia → brainstem → cerebellum → skull/sinuses/orbits)
- Compare sequences - A finding that appears on T1, T2, AND DWI tells a different story than one that only appears on T2
- Correlate with clinical context - Radiology never exists in a vacuum
Step 6 - Quick Reference Cheat Sheet
| Tissue / Finding | T1 | T2 | DWI |
|---|---|---|---|
| Fat | Bright | Bright | - |
| Water / CSF | Dark | Bright | - |
| Acute infarct | Dark/normal | Bright | Bright |
| Subacute blood | Bright (met-Hb) | Variable | - |
| Acute blood | Dark | Dark | - |
| Tumor/edema | Dark | Bright | Variable |
| Enhancement (gadolinium) | Bright | - | - |
| Calcification | Dark | Dark | - |
| Air | Dark | Dark | - |
Common Pitfalls to Avoid
- Don't read only one sequence - a finding may be invisible on T1 but obvious on T2
- Don't ignore the "normal" side - comparing both sides reveals subtle asymmetries
- Beware T2 shine-through on DWI - always check the ADC map
- Fat saturation matters - some sequences suppress fat signal, altering what looks "bright"
- Window/level (contrast) - adjusting brightness/contrast when viewing DICOM files reveals details invisible at default settings