
Describe neuromuscular junction with the help of diagram explain neuromuscular transmission for 10 marks
neuromuscular junction diagram structure motor end plate
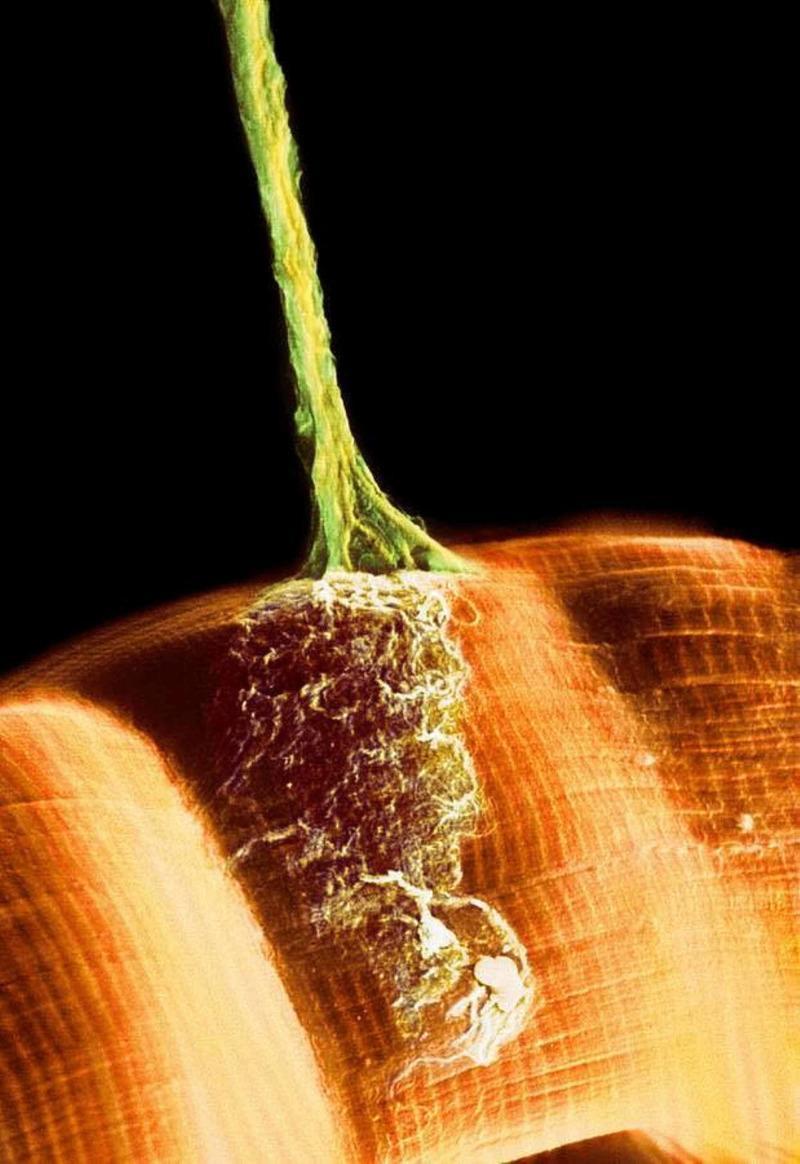
This false-color scanning electron micrograph (SEM) illustrates the morphology of a neuromuscular junction. A single motor axon, depicted in green, descends from the top of the frame to contact a skeletal muscle fiber, shown in orange. The axon exhibits a long, cylindrical structure that tapers and subsequently branches as it approaches the muscle surface. At the terminal end, the axon expands into a complex, granular network of synaptic terminals or motor endplates, which spread across a localized region of the muscle sarcolemma. The muscle fiber displays prominent transverse striations, characteristic of sarcomere organization in skeletal muscle. This visual demonstrates the physical connection between the somatic nervous system and the muscular system, highlighting the site of chemical neurotransmission and the structural adaptation of synapses to maximize contact area with the muscle cell for effective motor signaling.
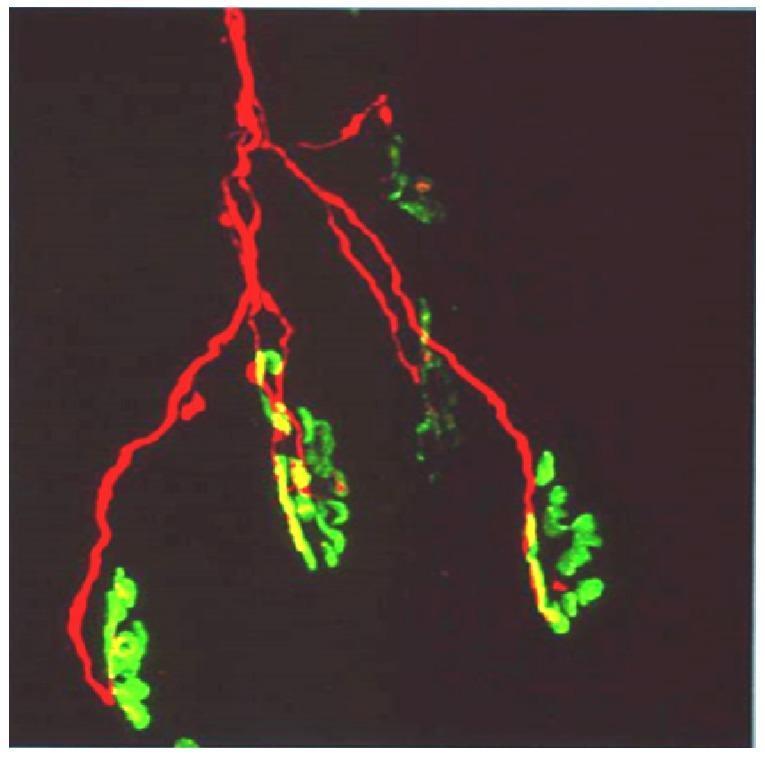
This diagnostic fluorescence microscopy image illustrates the neuromuscular junction (NMJ) architecture. The image features a single motor axon labeled with red fluorescence (TRITC-conjugated anti-neurofilament antibody), showing a characteristic distal branching pattern. These red axonal branches terminate at multiple motor end-plates, which are visualized in green (FITC-conjugated α-bungarotoxin) to reveal the high density of postsynaptic acetylcholine receptors (AChRs). The spatial relationship demonstrates a single axon innervating a cluster of six individual end-plates. Areas of colocalization between the presynaptic nerve terminal and the postsynaptic membrane appear yellow, indicating functional synaptic contact. This visual serves as an educational model for neuroanatomy and toxicology, particularly in the study of neurotoxic snake venoms (like those from the elapid family) that target presynaptic proteins or postsynaptic receptors, leading to neuromuscular paralysis and axonal degeneration.
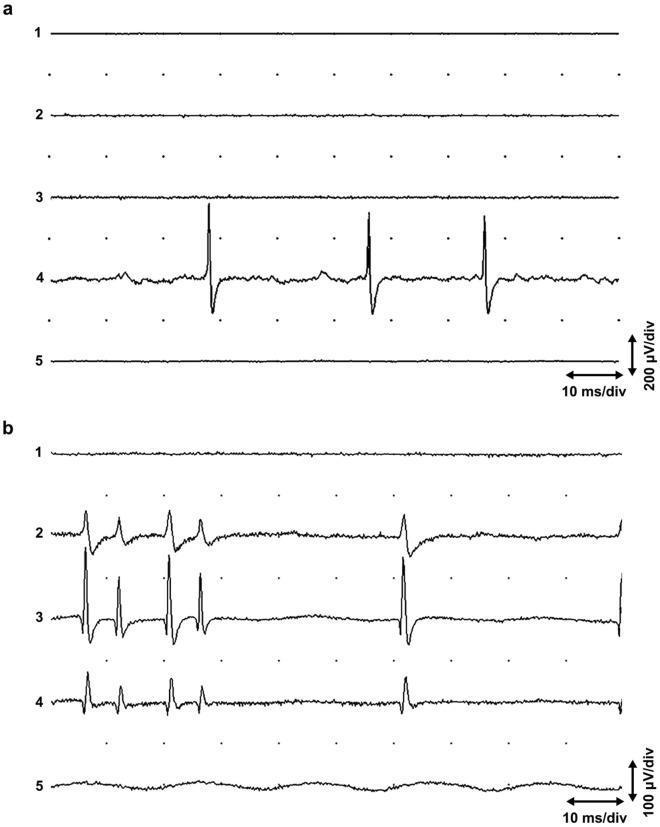
This diagnostic image displays two sets of five-channel needle electromyography (EMG) recordings (a and b) from the human extensor carpi radialis muscle. The electrodes were placed 2 mm apart in parallel within a single muscle fasciculus to study spontaneous neuromuscular junction activity. Panel (a) illustrates local end plate activity. Channel 4 shows non-propagating 'end plate spikes' characterized by high-frequency biphasic waveforms superimposed on low-amplitude, irregular 'end plate noise.' Channels 1, 2, 3, and 5 remain quiescent, indicating the highly localized nature of these potentials. Panel (b) demonstrates propagating end plate spikes. Unlike the local activity in (a), the potentials here are visible across channels 2, 3, and 4. These spikes show variations in amplitude and morphology, reflecting the spatial propagation of action potentials for a short distance along the muscle fiber. Calibrations are provided as 10 ms/div horizontally, with vertical sensitivity at 200 µV/div for (a) and 100 µV/div for (b). This comparison is educationally significant for distinguishing between stationary end plate noise and propagated intrafusal or extrafusal potentials in clinical neurophysiology.
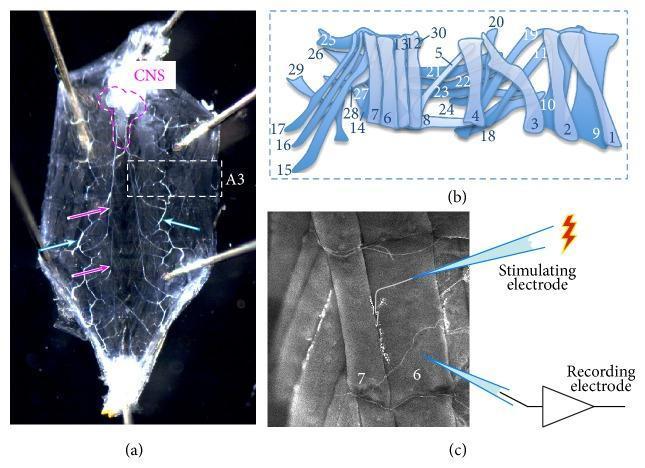
This composite educational image illustrates the Drosophila larval neuromuscular junction (NMJ), a widely used biomedical model for studying human neurodegenerative diseases like Parkinson's. (a) A dark-field micrograph showing a dissected third-instar larva. The central nervous system (CNS) is outlined in magenta, with magenta arrows indicating main nerve trunks. Cyan arrows highlight the branching tracheal respiratory system, and segment A3 is boxed. (b) An anatomical diagram of a larval hemisegment, labeling 30 distinct muscles (1-30) that form the archetypal body wall structure. (c) A grayscale fluorescence or DIC micrograph detailing the experimental setup for electrophysiology at muscle 6 and 7. The image demonstrates the placement of a suction stimulating electrode on the motor nerve and a recording electrode on the postsynaptic muscle fiber. This model is utilized in translational research to study synaptic vesicle dynamics, mitochondrial function, and glutamate release relevant to central nervous system synapse pathology.
neuromuscular transmission steps acetylcholine release synaptic cleft
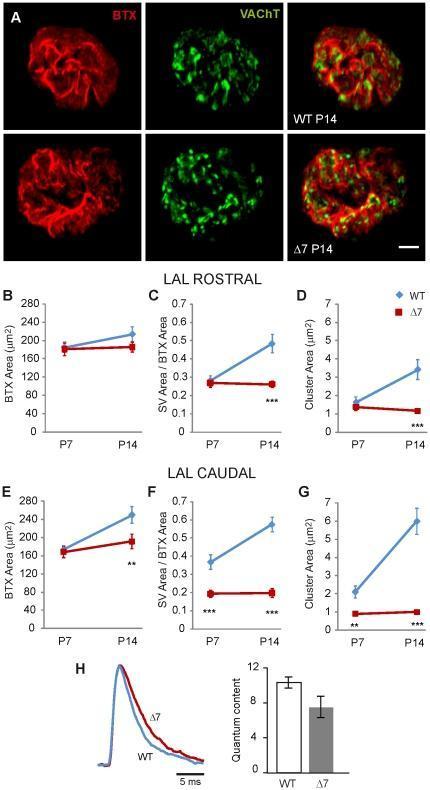
This composite educational graphic details neuromuscular junction (NMJ) alterations in Spinal Muscular Atrophy (SMA) using a SMNΔ7 mouse model. Section A presents immunofluorescence images of motor terminals at postnatal day 14 (P14) in wild-type (WT) and SMNΔ7 mice. Postsynaptic acetylcholine receptors are labeled with Bungarotoxin (BTX-Rho, red) and presynaptic synaptic vesicles (SVs) with Vesicular Acetylcholine Transporter (VAChT, green). The images reveal that while postsynaptic morphology appears similarly mature and reticulated in both groups, the SVs in SMNΔ7 terminals exhibit abnormal clustering and reduced occupancy compared to the dispersed distribution in WT. Sections B–G provide quantitative line graphs comparing the levator auris longus (LAL) muscle's rostral and caudal divisions. These plots track mean postsynaptic area, SV area normalized to BTX area, and cluster area from P7 to P14. The data show significant developmental stagnation and reduction in SV parameters in the SMNΔ7 group, particularly in the caudal division. Section H includes representative endplate potential (EPP) traces and a bar graph of quantum content, illustrating functional synaptic transmission deficits in the mutant terminals.
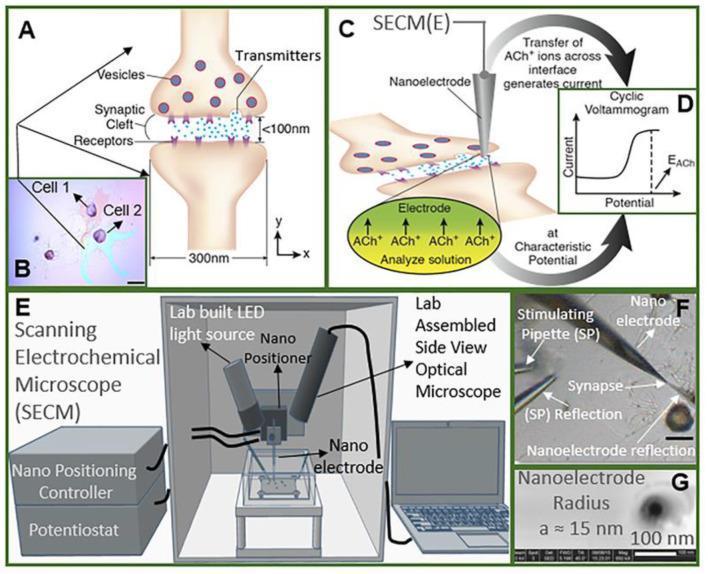
Educational scientific illustration and clinical micrograph set detailing cholinergic neurotransmission and its measurement via scanning electrochemical microscopy (SECM). (A) Pathophysiology diagram of a synapse showing a <100nm synaptic cleft, neurotransmitter vesicles, and postsynaptic receptors. (B) Light micrograph of cultured Aplysia ganglion neurons (Cell 1 and Cell 2). (C, D) Schematic of a nanoITIES pipette electrode and associated cyclic voltammogram demonstrating acetylcholine (ACh+) detection through ion transfer across a nanoscale interface. (E) Diagram of the experimental SECM setup, including a nano-positioning controller, potentiostat, and side-view optical microscope. (F) Real-time optical microscope image showing the spatial orientation of a stimulating pipette and nanoelectrode relative to a target synapse. (G) High-resolution scanning electron microscope (SEM) image of the nanoelectrode tip with a 15 nm radius. The composite illustrates high-precision electrochemical monitoring of neurotransmitter release dynamics at the single-synapse level, relevant to neurophysiology and diagnostic imaging research.
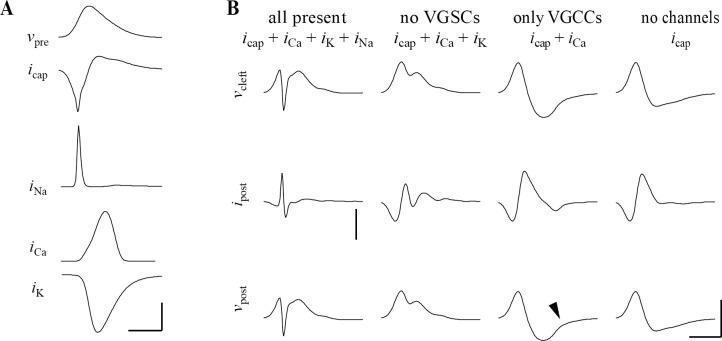
This pathophysiology diagram illustrates the electrophysiological properties of a synaptic cleft, specifically focusing on ephaptic coupling at the calyx of Held synapse. Panel A displays the temporal relationship between a presynaptic action potential (Vpre) and specific voltage-gated ion currents: capacitive current (Icap), sodium current (INa), calcium current (ICa), and potassium current (IK). INa shows a sharp peak during the AP upstroke, while ICa and IK occur primarily during the repolarization phase. Panel B presents four comparative simulation models demonstrating the impact of different voltage-gated ion channels on cleft potential (Vcleft), postsynaptic current (Ipost), and postsynaptic voltage (Vpost/prespike). The conditions include: 'all present' (showing complex biphasic waveforms), 'no VGSCs' (voltage-gated sodium channels), 'only VGCCs' (voltage-gated calcium channels), and 'no channels' (capacitive-only model). The simulations demonstrate how specific conductances at the release face shape the 'prespike'—the ephaptically coupled presynaptic AP recorded in the postsynaptic neuron. Arrowheads highlight subtle calcium-generated deflections in the current clamp prespike, providing insights into synaptic transmission and neural signaling mechanisms.
Neuromuscular Junction (NMJ) - Structure and Transmission
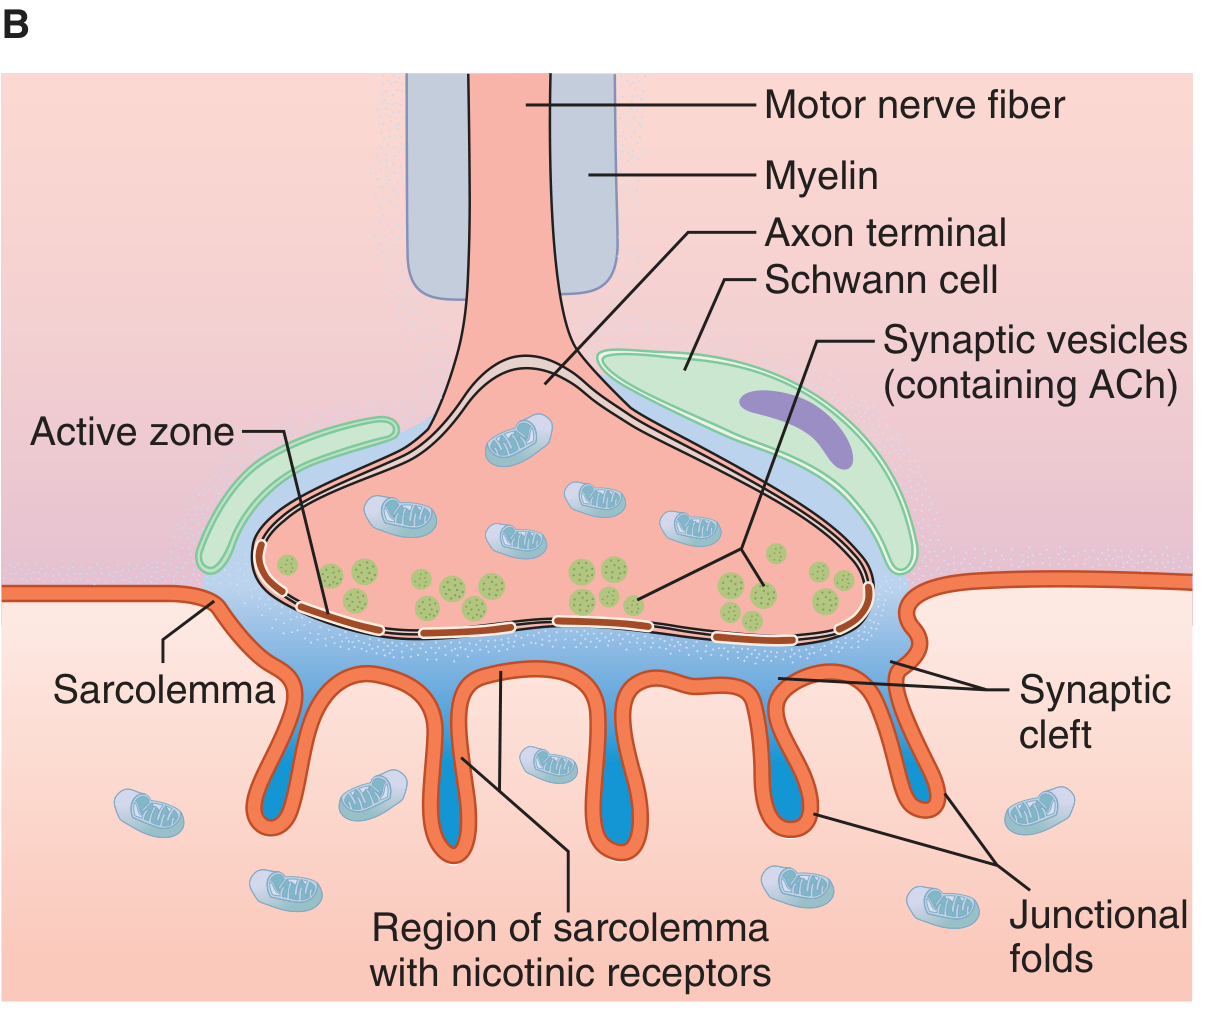
PART 1 - STRUCTURE OF THE NEUROMUSCULAR JUNCTION
Structural Components
- As the motor axon approaches the muscle, it loses its myelin sheath and divides into several terminal boutons (knob-like expansions)
- Each terminal bouton contains:
- Mitochondria (for energy/ACh synthesis)
- Synaptic vesicles - each vesicle contains ~10,000 molecules of acetylcholine (ACh)
- Active zones - specialized docking sites where vesicles align for exocytosis
- Voltage-gated Ca²+ channels located at the active zones
- The terminal is covered by Schwann cells except at the synaptic surface
- A gap of approximately 50-70 nm between the nerve terminal and the muscle membrane
- Contains acetylcholinesterase (AChE) enzyme, which rapidly hydrolyzes ACh after release
- The sarcolemma (muscle membrane) at this site is thrown into deep invaginations called junctional folds (subneural clefts)
- Nicotinic cholinergic receptors (N_M type) are densely concentrated at the crests (tops) of the junctional folds
- AChE is also found deep within the junctional folds
- Each endplate receives input from only a single nerve fiber
Diagram of NMJ Structure
PART 2 - NEUROMUSCULAR TRANSMISSION
Diagram of Neuromuscular Transmission
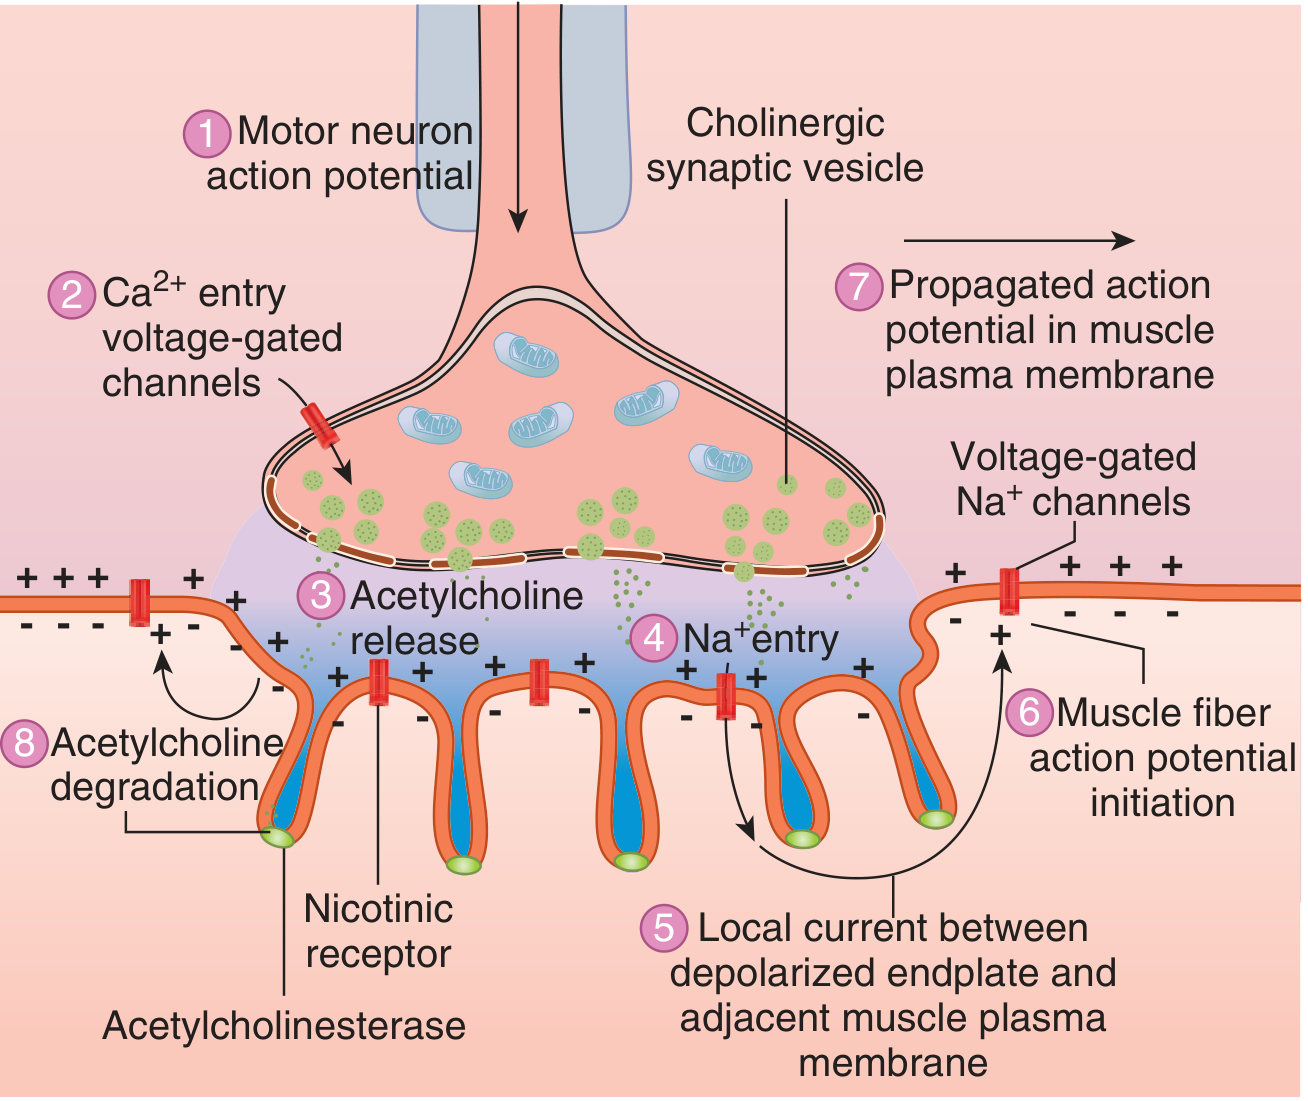
Step-by-Step Sequence
- An action potential travels down the motor axon and reaches the nerve terminal (axon terminal bouton)
- Membrane depolarization opens voltage-gated Ca²+ channels at the active zones in the presynaptic terminal
- Ca²+ flows into the terminal down its concentration gradient
- Ca²+ triggers exocytosis of synaptic vesicles - vesicles fuse with the presynaptic membrane and release ACh into the synaptic cleft
- Each nerve impulse releases ACh from approximately ~60 synaptic vesicles, totaling ~600,000 ACh molecules
- ACh release is quantal (in discrete packets)
- ACh diffuses rapidly across the narrow synaptic cleft
- It binds to nicotinic (N_M) receptors concentrated at the tops of the junctional folds on the postsynaptic membrane
- These are ligand-gated ion channels (ionotropic receptors)
- Binding of ACh opens the nicotinic receptor channel, increasing Na⁺ and K⁺ conductance
- The large inward Na⁺ current produces a local depolarization called the endplate potential (EPP)
- The EPP is typically ~70 mV in amplitude - well above the ~-55 mV firing threshold
- The EPP creates a current sink, driving current flow into adjacent non-junctional sarcolemma
- This depolarizes the surrounding muscle membrane to its firing threshold, generating a muscle fiber action potential
- The action potential propagates in both directions along the muscle fiber via voltage-gated Na⁺ channels
- This triggers excitation-contraction coupling (via T-tubules and sarcoplasmic reticulum) and ultimately muscle contraction
- ACh in the synaptic cleft is rapidly hydrolyzed by acetylcholinesterase (AChE) into acetate and choline
- This terminates the signal and allows the muscle to relax
- Choline is recycled back into the presynaptic terminal for resynthesis of ACh
Quantal Release of ACh
- At rest, vesicles are spontaneously released randomly, producing tiny depolarizations called miniature endplate potentials (MEPPs) - amplitude ~0.5 mV each
- MEPPs are too small to reach firing threshold - they are subthreshold events
- On nerve stimulation, hundreds of vesicles release simultaneously, producing the full EPP
- Quantal release varies: directly with Ca²+ concentration and inversely with Mg²+ concentration
Safety Margin of NMJ
Clinical Relevance
| Condition | Defect | Mechanism |
|---|---|---|
| Myasthenia Gravis | Post-synaptic | Autoantibodies destroy nicotinic ACh receptors |
| Lambert-Eaton Syndrome | Pre-synaptic | Autoantibodies against voltage-gated Ca²+ channels; impaired ACh release |
| Botulinum toxin | Pre-synaptic | Blocks SNARE proteins; prevents ACh exocytosis |
| Organophosphate poisoning | Synaptic cleft | Inhibits AChE; ACh accumulates, causing continuous stimulation |
| Non-depolarizing NMBs (e.g., rocuronium) | Post-synaptic | Competitive antagonism at nicotinic receptors |
Motor AP → Ca²+ influx → ACh exocytosis → ACh + N_M receptor → EPP → Muscle AP → Contraction → AChE hydrolyzes ACh → Termination