
Intra arterial pressure monitoring Explanations about fourier analysis on intra arterial pressure monitoring, about frequency,harmonic, resonance Tell me from basics
I'll start by reading the medical library skill, then search for content on intra-arterial pressure monitoring and Fourier analysis.
Reading File
Now let me search the medical library and web in parallel for this topic.
Finding Sources
Finding Sources
Searching the Web
Fourier analysis intra-arterial pressure monitoring frequency harmonic resonance explained
Excellent results. Now let me read the key textbook sections in parallel - Miller's Anesthesia on IAP monitoring and Morgan & Mikhail's sections, plus extract from the WFSA resource.
Reading File
Reading File
Reading Web Page
https://resources.wfsahq.org/wp-content/uploads/137_english.…
Now let me read the Miller's Anesthesia section on invasive arterial pressure monitoring and the Morgan & Mikhail section on waveform physics, and also the block13 section from Miller's on waveform analysis.
Reading File
Reading File
I have very rich content now. Let me fetch the key waveform diagrams from the textbook to include in my answer.
Loading Image
Loading Image
Excellent! I now have all the material I need for a thorough, well-illustrated answer. Let me compile this comprehensive explanation.
Intra-Arterial Pressure Monitoring: Fourier Analysis, Frequency, Harmonics, and Resonance - From Basics
1. What is Intra-Arterial Pressure (IAP) Monitoring?
Intra-arterial pressure monitoring is the direct, continuous, beat-to-beat measurement of blood pressure obtained by cannulating a peripheral artery (most commonly the radial artery) and connecting it via a fluid-filled catheter-tubing system to a pressure transducer. Unlike a cuff reading taken every few minutes, it gives a real-time waveform on the monitor for every single heartbeat.
It is considered the gold standard for blood pressure measurement in critical care and perioperative settings.
Indications include:
- Anticipated or current hemodynamic instability (major surgery, shock, vasopressor use)
- Need for tight, beat-to-beat BP control (neurosurgery, cardiac surgery, aortic procedures)
- Frequent arterial blood gas sampling
- Conditions where NIBP is unreliable (obesity, arrhythmias, severe vasoconstriction)
Morgan and Mikhail's Clinical Anesthesiology, 7e - "Because intraarterial cannulation allows continuous beat-to-beat blood pressure measurement, it is considered the optimal blood pressure monitoring technique."
2. The Arterial Waveform is a Complex Wave
The pressure wave produced by each heartbeat is not a simple, clean sine wave. It has a complex shape with:
- A steep systolic upstroke (rapid LV ejection)
- A rounded systolic peak
- A dicrotic notch (aortic valve closure)
- A gradual diastolic decay
This complex shape is the starting point for understanding Fourier analysis.
3. Sine Waves - The Building Blocks (Basics First)
Before Fourier analysis, you need to understand sine waves. A sine wave is the simplest oscillating wave, described by three properties:
| Property | What it means | Unit |
|---|---|---|
| Frequency | How many complete cycles per second | Hz (Hertz) |
| Amplitude | Height of the wave (the "loudness") | mmHg (for pressure) |
| Phase | Shift in time position relative to another wave | Degrees (0-360°) |
The key mathematical insight (discovered by Joseph Fourier in the early 1800s) is:
Any complex, repeating waveform - no matter how complicated - can be built by adding together a set of simple sine waves of different frequencies, amplitudes, and phases.
This is the foundation of Fourier analysis.
4. Fourier Analysis Applied to the Arterial Waveform
The arterial pressure waveform repeats with every heartbeat. Because it is a periodic (repeating) waveform, it can be broken down into a series of sine waves:
The Fundamental Frequency
The fundamental frequency (f₀) is equal to the heart rate.
- If heart rate = 60 bpm = 1 beat/second → f₀ = 1 Hz
- If heart rate = 120 bpm = 2 beats/second → f₀ = 2 Hz
This is the lowest-frequency, highest-amplitude component - it represents the "basic pulse."
The Harmonics
Harmonics are additional sine waves at integer multiples of the fundamental frequency.
| Harmonic | Frequency (if HR = 60 bpm, f₀ = 1 Hz) | Description |
|---|---|---|
| 1st (fundamental) | 1 Hz | The basic pulse wave |
| 2nd harmonic | 2 Hz | 2× the fundamental |
| 3rd harmonic | 3 Hz | 3× the fundamental |
| 4th harmonic | 4 Hz | 4× the fundamental |
| ...8th harmonic | 8 Hz | 8× the fundamental |
Each successive harmonic has a smaller amplitude but adds finer detail to the reconstructed waveform shape.
The key rule: To accurately reconstruct the arterial waveform, you need at least the first 8-10 harmonics. This means the monitoring system must be able to faithfully respond to frequencies up to 8-10× the heart rate.
- For HR 120 bpm (f₀ = 2 Hz): you need up to ~16-24 Hz response
- The general rule: the system's natural frequency must be >24 Hz (some sources say at least 8-10× maximum anticipated HR)
How Harmonics Build the Waveform (Visual Concept)
Think of it like this: the 1st harmonic gives you the rough "humped" shape. Adding the 2nd harmonic sharpens the systolic peak. Adding more harmonics progressively refines the dicrotic notch, the slope, and fine detail. The more harmonics you include, the closer the reconstructed waveform matches the true original:
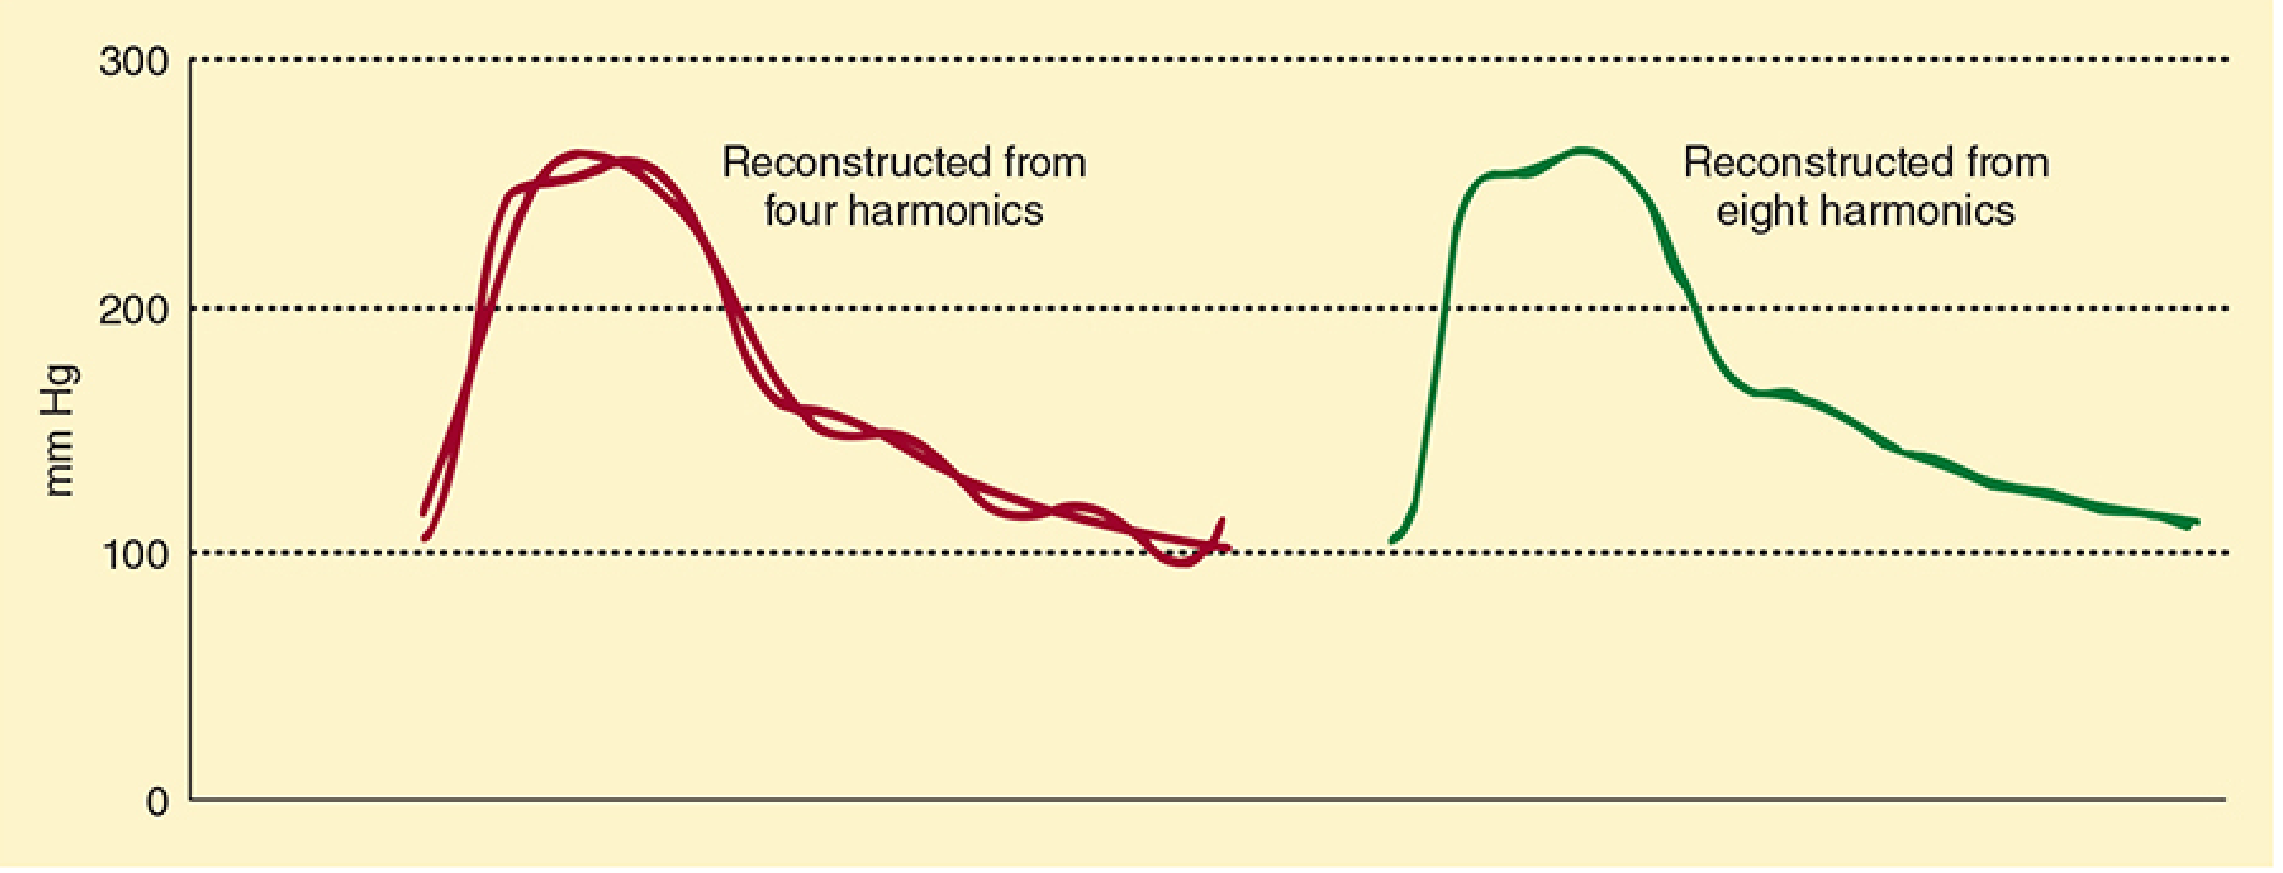
Figure: Left (red) - reconstructed from only 4 harmonics: the waveform is "messy" and inaccurate. Right (green) - reconstructed from 8 harmonics: the waveform closely resembles the true arterial waveform. (Morgan & Mikhail's Clinical Anesthesiology, 7e)
In the bedside monitoring system, the microprocessor performs this Fourier decomposition: it breaks the incoming complex pressure signal into its component sine waves, then reassembles the waveform from the fundamental + 8 or more harmonics to display an accurate waveform on the screen.
Morgan and Mikhail's Clinical Anesthesiology, 7e - "A complex waveform, such as an arterial pulse wave, can be expressed as a summation of simple harmonic waves (according to the Fourier theorem). For accurate measurement of pressure, the catheter-tubing-transducer system must be capable of responding adequately to the highest frequency of the arterial waveform (approximately 16-24 Hz)."
5. Natural Frequency and Resonance
This is the most clinically important concept for understanding why arterial line readings can be inaccurate.
Natural (Resonant) Frequency of the Monitoring System
Every physical object - a guitar string, a tuning fork, and yes, a catheter-tubing-transducer system - has its own natural frequency: the rate at which it spontaneously oscillates when disturbed.
For the arterial line system (catheter + tubing + transducer), this natural frequency depends on:
- Tubing length (longer = lower natural frequency)
- Tubing compliance (more compliant = lower frequency)
- Fluid density
- Air bubbles, stopcocks, clots in the line
Commercial disposable transducer sets have a natural frequency of ~200 Hz - deliberately designed to be far above the frequency range of the arterial waveform.
Resonance: When Things Go Wrong
Resonance occurs when the natural frequency of the measuring system matches or comes close to the frequency of an incoming signal. When this happens, the system amplifies that signal dramatically - producing an artifactually exaggerated waveform.
In clinical terms:
- The arterial waveform contains harmonics up to 8-10× the HR
- At HR 120 bpm: harmonics reach ~16-24 Hz
- If the system's natural frequency drops (due to added stopcocks, air bubbles, long tubing, clots) toward this range, resonance occurs
Consequences of resonance (underdamping/hyperresonance):
- Falsely HIGH systolic pressure (overshoot artifact)
- Falsely LOW diastolic pressure (undershoot artifact)
- The mean arterial pressure (MAP) remains relatively accurate
Morgan and Mikhail's Clinical Anesthesiology, 7e - "Catheter-tubing-transducer systems must also prevent hyperresonance, an artifact caused by reverberation of pressure waves within the system."
6. Damping
Damping is the process of attenuating (reducing) oscillations in the system. It is the counterpart of resonance.
The damping coefficient (β) describes how quickly oscillations die down:
| Damping state | β value | Effect on waveform | Systolic BP | Diastolic BP |
|---|---|---|---|---|
| Optimal damping | 0.6-0.7 | Accurate waveform | Accurate | Accurate |
| Underdamped | <0.5 | Ringing, overshoot | Falsely HIGH | Falsely low |
| Overdamped | >0.7 | Sluggish, blunted | Falsely LOW | Falsely high |
MAP is preserved in both under- and overdamping - which is why MAP is the most reliable pressure measurement from an arterial line.
Causes of overdamping (reduces natural frequency, attenuates signal):
- Air bubble in the line
- Blood clot at catheter tip
- Kinked catheter
- Excessive length of tubing
- Soft, compliant tubing
- Extra stopcocks
Causes of underdamping:
- Stiff, short tubing (raises natural frequency into waveform range - less common)
- Very high heart rate bringing harmonics up toward system natural frequency
The Fast-Flush Test (Snap Test)
This is the bedside test to assess natural frequency and damping coefficient:
- Briefly open the flush device - this creates a square-wave pressure spike
- Release it - the system rings at its natural frequency before settling
- Observe the oscillations:
- Natural frequency = paper speed ÷ wavelength of oscillations (e.g. 25 mm/s ÷ 1 mm wavelength = 25 Hz)
- Damping coefficient = ratio of successive oscillation amplitudes
- Optimal: 1-2 oscillations before returning to baseline, natural frequency >7 Hz
7. The Arterial Waveform: Forward and Reflected Waves
The shape of the arterial waveform is not only from the heart's ejection - it is actually the sum of forward-traveling waves and backward-reflected waves from peripheral vascular reflection sites (arterial bifurcations, arterioles).
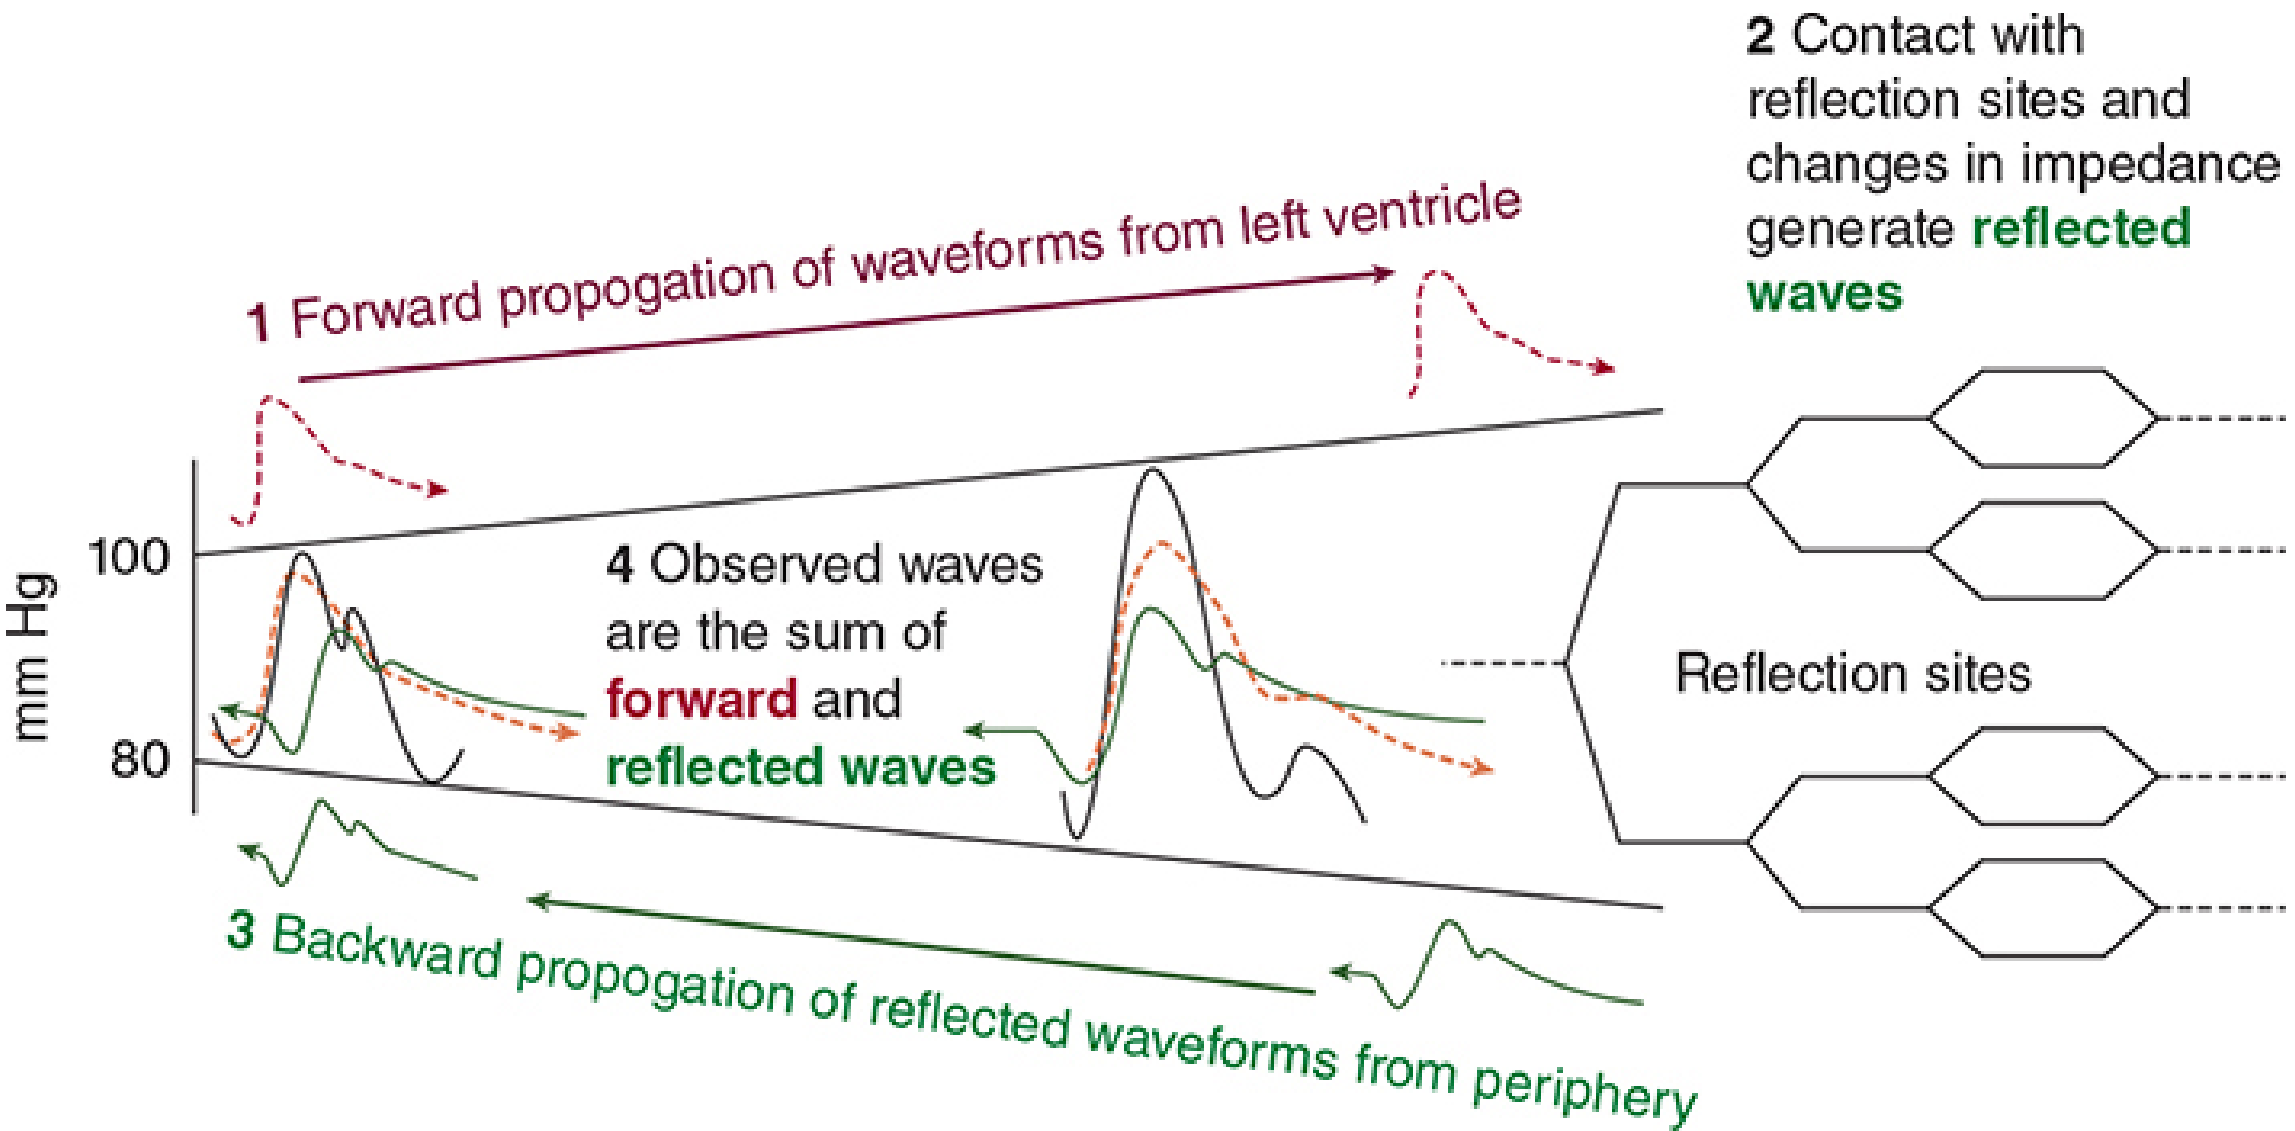
Figure: The observed waveform is the sum of forward-propagating LV waveforms and backward-propagating reflected waveforms from peripheral reflection sites. The phase difference between these waves - and their attenuation - creates the complex shape seen on the monitor. (Morgan & Mikhail's Clinical Anesthesiology, 7e)
This also explains why peripheral arterial waveforms look different from central ones:
- The radial artery waveform has a higher systolic peak and sharper upstroke than the aorta
- The dorsalis pedis waveform is even more distorted
- MAP is constant (or slightly lower) throughout the arterial tree
8. Practical Implications - Summary Table
| Concept | Clinical Relevance |
|---|---|
| Fundamental frequency = HR | System must respond to at least 8-10× HR |
| Harmonics (1st-8th) | Determine waveform shape accuracy; system needs ~24 Hz bandwidth |
| Natural frequency of system | Should be >200 Hz (commercial sets); reduced by air, long tubing, clots |
| Resonance | Occurs when system natural frequency ≈ harmonic frequency; falsely high systolic |
| Optimal damping (β 0.6-0.7) | Accurate readings; minimise tubing length, remove air, use rigid tubing |
| Overdamping | Blunted, sluggish trace; low systolic, high diastolic; MAP still reliable |
| Fast-flush test | Bedside assessment of natural frequency and damping coefficient |
| MAP reliability | MAP is preserved even with damping errors; use as primary target in unstable patients |
9. How to Optimise Your Arterial Line System
Based on all the above physics:
- Use short, rigid, low-compliance tubing (increases natural frequency)
- Minimise stopcocks (each one reduces natural frequency)
- Eliminate all air bubbles rigorously (air is highly compressible and dramatically reduces natural frequency)
- Flush to prevent clot at catheter tip
- Level and zero the transducer at the phlebostatic axis (right atrium level, 4th intercostal space, mid-axillary line)
- Perform a fast-flush test and observe for optimal damping after any manipulation of the line
Sources:
- Morgan and Mikhail's Clinical Anesthesiology, 7e - Chapter 5, Invasive Arterial Blood Pressure Monitoring
- Miller's Anesthesia, 10e - Chapter 32, Direct Arterial Pressure Monitoring
- ATOTW #137: Physical principles of intra-arterial blood pressure measurement - World Federation of Societies of Anaesthesiologists
This is a shared conversation. Sign in to Orris to start your own chat.