tell me everything about Respiratory physiolohy from basics to clinicals
Reading File
Finding Sources
Finding Sources
Finding Sources
Finding Sources
Finding Sources
Finding Sources
Reading File
Reading File
Reading File
Reading File
Reading File
Reading File
Reading File
Reading File
Reading File
Reading File
Reading File
Loading Image
I now have comprehensive material across all major respiratory physiology topics. Let me compile the complete, detailed response.
Respiratory Physiology: Basics to Clinicals
A complete reference covering anatomy, mechanics, gas exchange, transport, acid-base, control of breathing, V/Q relationships, and clinical correlations - sourced from Guyton & Hall, Costanzo Physiology, Ganong's Review of Medical Physiology, and Fishman's Pulmonary Diseases.
1. Overview and Goals of the Respiratory System
The primary function of the respiratory system is uptake of O₂ from the environment and removal of CO₂ from the body. At rest, a normal human breathes 12-15 times/minute, with each breath containing ~500 mL of air (tidal volume), giving a minute ventilation of 6-8 L/min. On average, 250 mL of O₂ enters the body per minute and 200 mL of CO₂ is excreted.
Secondary functions include:
- Humidification and filtration of inspired air
- Acid-base regulation (via CO₂ excretion)
- Phonation (speech)
- Pulmonary defense (mucociliary clearance, alveolar macrophages)
- Metabolic functions (conversion of angiotensin I → II; inactivation of bradykinin, serotonin)
(Ganong's Review of Medical Physiology)
2. Anatomy of the Respiratory System
Conducting Zone (Dead Space)
- Nose → pharynx → larynx → trachea → bronchi → bronchioles → terminal bronchioles
- No gas exchange occurs here - this constitutes the anatomical dead space (~150 mL)
- Functions: warm, humidify, filter air; mucociliary escalator clears particles
Respiratory Zone (Gas Exchange)
- Respiratory bronchioles → alveolar ducts → alveolar sacs → alveoli
- ~300 million alveoli; total surface area = 50-100 m²
- Alveolar wall consists of:
- Type I pneumocytes (95% of surface) - thin, for gas diffusion
- Type II pneumocytes (5% of surface) - produce surfactant (dipalmitoyl phosphatidylcholine, DPPC), can regenerate Type I cells
- Alveolar macrophages - first-line defense
The Respiratory Membrane
The membrane through which gas exchange occurs has 6 layers:
- Alveolar fluid layer (surfactant)
- Alveolar epithelium (Type I cell)
- Epithelial basement membrane
- Thin interstitial space
- Capillary basement membrane
- Capillary endothelium
Total thickness: ~0.6 µm - extremely thin for rapid diffusion.
3. Lung Volumes and Capacities
These are measured by spirometry (except RV, FRC, TLC which require helium dilution or body plethysmography):
| Measurement | Value (adult male) | Definition |
|---|---|---|
| Tidal Volume (TV) | 500 mL | Air per normal breath |
| Inspiratory Reserve Volume (IRV) | 3,000 mL | Extra air forcefully inspired |
| Expiratory Reserve Volume (ERV) | 1,100 mL | Extra air forcefully expired |
| Residual Volume (RV) | 1,200 mL | Air remaining after maximal expiration |
| Inspiratory Capacity (IC) | 3,500 mL | TV + IRV |
| Functional Residual Capacity (FRC) | 2,300 mL | ERV + RV |
| Vital Capacity (VC) | 4,600 mL | IRV + TV + ERV |
| Total Lung Capacity (TLC) | 5,800 mL | VC + RV |
Key clinical relationships:
- FRC = the volume at end of passive expiration where inward lung recoil = outward chest wall recoil. RV cannot be measured by spirometry alone.
- FEV₁/FVC ratio: normal ≥0.70
- Obstructive (asthma, COPD): FEV₁↓, FVC normal/↓, ratio <0.70; TLC↑, RV↑
- Restrictive (fibrosis, pleural effusion): FEV₁↓, FVC↓, ratio normal or ↑; TLC↓
(Guyton & Hall Textbook of Medical Physiology)
4. Lung Mechanics
4a. Pressures
- Atmospheric pressure: 760 mm Hg (reference = 0 cmH₂O)
- Pleural (intrapleural) pressure: normally -5 cmH₂O at rest; becomes -7.5 cmH₂O during inspiration. This negative pressure holds the lung against the chest wall.
- Alveolar pressure: 0 cmH₂O at rest; -1 cmH₂O during inspiration (air flows in); +1 cmH₂O during expiration (air flows out)
- Transpulmonary pressure = Alveolar - Pleural = the pressure that keeps the lung open
Pneumothorax (air in pleural space) eliminates the negative pleural pressure → lung collapses.
4b. Compliance
Compliance (C) = ΔVolume / ΔPressure
Normal lung compliance = ~200 mL/cmH₂O
- ↑ Compliance (easier to inflate): emphysema (loss of elastic recoil), aging
- ↓ Compliance (stiffer): pulmonary fibrosis, ARDS, pulmonary edema, neonatal RDS (surfactant deficiency)
4c. Surface Tension and Surfactant
The air-water interface in alveoli generates surface tension (La Place's Law: P = 2T/r). Without surfactant:
- Small alveoli would collapse into large ones (atelectasis)
- Much greater work of breathing would be needed
Surfactant (produced by Type II pneumocytes, appears at ~28 weeks gestation) reduces surface tension by ~15-fold, stabilizes alveoli of different sizes, and prevents alveolar collapse at end-expiration.
Clinical: Premature infants lacking surfactant develop Neonatal Respiratory Distress Syndrome (NRDS) - treated with exogenous surfactant and CPAP/ventilation.
4d. Airway Resistance
R = ΔP / Flow (Ohm's law analogy)
Normal airway resistance = 1-2 cmH₂O/L/sec
- Determined primarily by medium-sized bronchi (not the tiny bronchioles which are too numerous, or the large airways)
- ↑ Resistance: bronchospasm (asthma), mucus plugging, foreign body
- Sympathetics (β₂ stimulation) → bronchodilation
- Parasympathetics (ACh, M₃) → bronchoconstriction
- Histamine, leukotrienes → bronchoconstriction
5. Pulmonary Circulation
The pulmonary circuit is a low-pressure, high-flow system:
- Mean pulmonary arterial pressure: 15 mm Hg (vs. 100 mm Hg systemic)
- Pulmonary capillary wedge pressure (PCWP): ~7 mm Hg
- Pulmonary vascular resistance (PVR): very low
Important features:
- Hypoxic pulmonary vasoconstriction (HPV): When PO₂ in an alveolus drops, the adjacent blood vessels constrict - this is the opposite of systemic vessels. HPV diverts blood away from poorly ventilated areas to better-ventilated ones, optimizing V/Q matching.
- Zone model (West's Zones): Blood flow varies throughout the lung based on the relationship between PA (alveolar), Pa (arterial), and Pv (venous) pressures:
- Zone 1 (apex): PA > Pa > Pv → capillaries can collapse → dead space (not normally present)
- Zone 2 (mid): Pa > PA > Pv → flow determined by Pa - PA
- Zone 3 (base): Pa > Pv > PA → flow determined by Pa - Pv (highest flow)
6. Gas Exchange - Diffusion
Dalton's Law (Partial Pressures)
In a gas mixture, each gas exerts its own partial pressure. In dry atmospheric air (760 mm Hg):
- PO₂ = 0.21 × 760 = 160 mm Hg
- PCO₂ = 0.0004 × 760 = 0.3 mm Hg
After humidification in airways (water vapor pressure = 47 mm Hg at 37°C):
- PO₂ = 0.21 × (760-47) = ~150 mm Hg (inspired)
- Alveolar PO₂ ~104 mm Hg (after mixing with alveolar gas and CO₂ addition)
Alveolar Gas Equation
PAO₂ = PiO₂ - (PaCO₂/RQ)
Where PiO₂ = inspired PO₂, RQ (respiratory quotient) = VCO₂/VO₂ = 0.8 normally
Normal values: PAO₂ ≈ 100 mmHg, PaCO₂ = 40 mmHg
A-a gradient = PAO₂ - PaO₂ (normal = 5-15 mmHg, increases with age)
- ↑ A-a gradient → problem with diffusion, V/Q mismatch, or shunt
- Normal A-a gradient with hypoxia → hypoventilation or low FiO₂
Fick's Law of Diffusion
Diffusion rate ∝ (Surface area × Pressure difference × Solubility) / (Thickness × √Molecular weight)
Key facts:
- CO₂ is 20 times more soluble than O₂ → diffuses far more easily despite having same or lower partial pressure gradient
- Normal diffusing capacity for O₂ (DLCO) = ~21 mL/min/mmHg at rest; triples during exercise
Factors reducing DLCO clinically:
- Emphysema (↓ surface area)
- Pulmonary fibrosis (↑ thickness)
- Pulmonary hypertension (↓ perfusion)
- Anemia (↓ Hb)
(Guyton & Hall Textbook of Medical Physiology)
7. Ventilation-Perfusion (V/Q) Relationships
Normal V/Q ratio = 0.8 (V = 4 L/min alveolar ventilation; Q = 5 L/min cardiac output)
V/Q mismatch is the most common cause of hypoxemia in clinical practice.
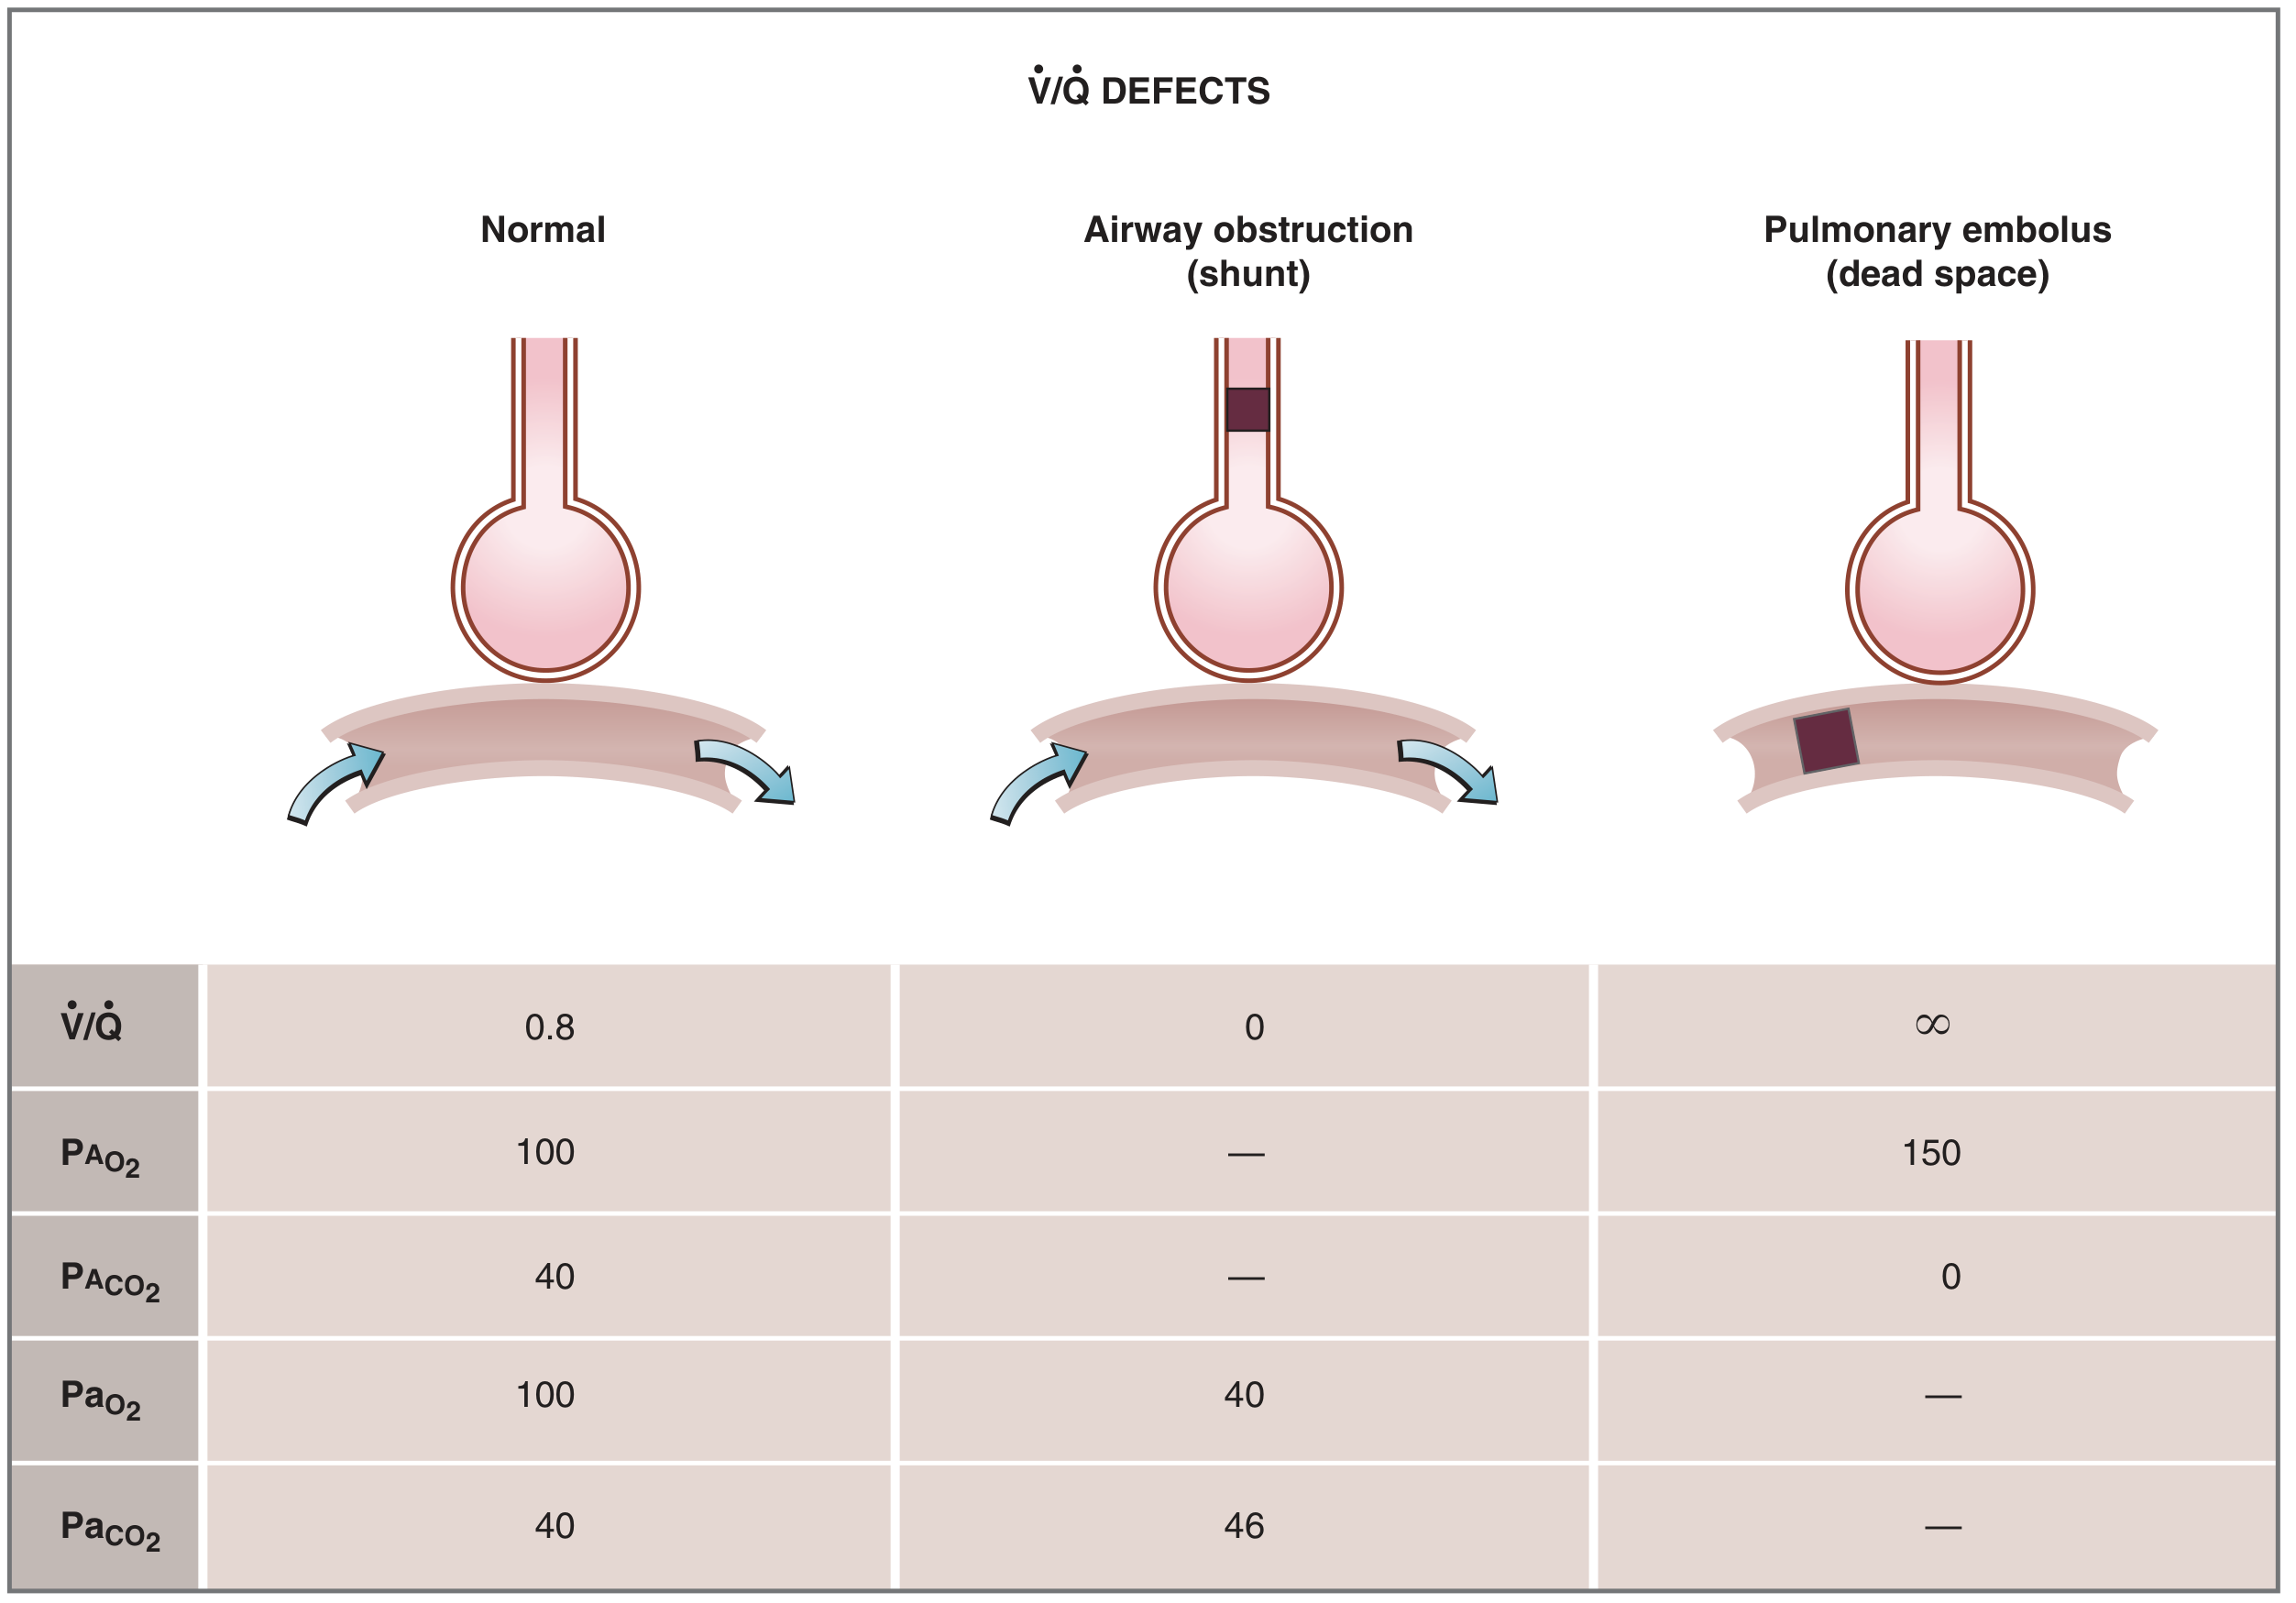
| Condition | V/Q Ratio | Blood Gas Effect | Clinical Example |
|---|---|---|---|
| Normal | 0.8 | PaO₂ 100, PaCO₂ 40 | - |
| Shunt (V=0) | → 0 | PaO₂ → mixed venous (40 mmHg); hypoxia not corrected by O₂ | Pneumonia, ARDS, AV malformation |
| Dead Space (Q=0) | → ∞ | Alveolar air approaches inspired; ↑ PaCO₂ | Pulmonary embolus |
Key clinical point: Shunt hypoxemia does NOT correct with 100% O₂ (because the shunted blood never sees the high-O₂ alveolus). This distinguishes true shunt from V/Q mismatch.
(Costanzo Physiology 7th Edition)
8. Oxygen Transport in Blood
Dissolved O₂
Only ~1.5% of O₂ is dissolved (0.003 mL O₂/dL blood per mmHg PO₂). At PaO₂ = 100 mmHg → 0.3 mL O₂/dL - far too little alone.
Hemoglobin-Bound O₂ (98.5%)
- Hb carries O₂ as oxyhemoglobin
- Each Hb molecule has 4 heme groups → carries up to 4 O₂ molecules
- Fully saturated Hb carries 1.34 mL O₂/g Hb
- At normal Hb (15 g/dL): O₂ content = 15 × 1.34 × 0.98 + 0.3 = ~20 mL O₂/dL
Oxyhemoglobin Dissociation Curve (ODC)
The S-shaped curve reflects cooperative binding:
- P50 (PO₂ at 50% saturation) = 26.8 mmHg normally
- Flat upper portion (PaO₂ 60-100 mmHg): protects against drops in PO₂ (SaO₂ stays >90% even if PaO₂ falls from 100→60)
- Steep lower portion (PaO₂ 20-60 mmHg): O₂ readily unloads to tissues
Bohr Effect - Factors shifting curve RIGHT (↓ O₂ affinity, more O₂ delivery to tissues):
- ↑ PCO₂
- ↑ Temperature
- ↑ H⁺ (↓ pH/acidosis)
- ↑ 2,3-DPG (chronic hypoxia, anemia)
Factors shifting curve LEFT (↑ O₂ affinity, less unloading):
- ↓ PCO₂, ↓ H⁺ (alkalosis), ↓ Temperature
- Carbon monoxide (CO) - 240× affinity for Hb vs O₂ → cherry-red color, carboxyhemoglobin
- Fetal hemoglobin (HbF) - has γ chains instead of β; less 2,3-DPG binding → higher O₂ affinity (good for fetal O₂ uptake across placenta)
- Methemoglobin (oxidized Fe³⁺)
O₂ delivery (DO₂) = Cardiac output × O₂ content = ~1,000 mL O₂/min
O₂ consumption (VO₂) = 250 mL/min normally
9. CO₂ Transport
CO₂ is transported in three forms:
| Form | % of Total | Mechanism |
|---|---|---|
| Dissolved in plasma | 7-8% | PCO₂ gradient |
| As carbamino compounds | 5-8% | CO₂ + Hb-NH₂ → HbNHCOOH |
| As bicarbonate (HCO₃⁻) | 70-75% | Via carbonic anhydrase in RBCs |
The Chloride Shift (Hamburger Phenomenon):
In tissues: CO₂ → (carbonic anhydrase) → H₂CO₃ → H⁺ + HCO₃⁻
HCO₃⁻ exits RBC into plasma; Cl⁻ enters RBC (to maintain electroneutrality) = chloride shift
In lungs: reverse occurs - HCO₃⁻ re-enters RBC, is converted back to CO₂, and expired.
Haldane Effect: Oxygenation of Hb in the lungs reduces its affinity for CO₂ → releases CO₂ for expiration. Deoxygenated Hb binds CO₂ more readily (in tissues).
Normal values: PaCO₂ = 40 mmHg, PvCO₂ = 45 mmHg - only a 5 mmHg gradient is needed for CO₂ to diffuse from pulmonary capillaries into alveoli.
(Guyton & Hall Textbook of Medical Physiology)
10. Acid-Base Balance and Respiratory Contribution
Henderson-Hasselbalch equation:
pH = 6.1 + log([HCO₃⁻] / 0.03 × PaCO₂)
Normal: pH = 7.40, PaCO₂ = 40 mmHg, HCO₃⁻ = 24 mEq/L
The lungs rapidly compensate for metabolic disturbances (within minutes-hours):
- Metabolic acidosis → hyperventilation → ↓ PaCO₂ (Kussmaul breathing in DKA)
- Metabolic alkalosis → hypoventilation → ↑ PaCO₂
Acid-Base Disorders
| Disorder | pH | PaCO₂ | HCO₃⁻ | Compensation |
|---|---|---|---|---|
| Respiratory acidosis | ↓ | ↑ | ↑ (renal) | Kidneys retain HCO₃⁻ |
| Respiratory alkalosis | ↑ | ↓ | ↓ (renal) | Kidneys excrete HCO₃⁻ |
| Metabolic acidosis | ↓ | ↓ (respiratory) | ↓ | Hyperventilation |
| Metabolic alkalosis | ↑ | ↑ (respiratory) | ↑ | Hypoventilation |
Winter's formula for expected PaCO₂ in metabolic acidosis:
PaCO₂ = (1.5 × HCO₃⁻) + 8 ± 2
11. Control of Breathing
Brainstem Centers
Breathing is controlled by medullary and pontine centers (involuntary):
- Dorsal Respiratory Group (DRG) - medulla - controls inspiration rhythm; sends output via phrenic nerve (C3,4,5) to diaphragm; receives input from CN IX (glossopharyngeal) and CN X (vagus)
- Ventral Respiratory Group (VRG) - medulla - inactive during quiet breathing; activated during forced expiration (exercise)
- Pneumotaxic Center (upper pons) - turns OFF inspiration, limits tidal volume, regulates respiratory rate
- Apneustic Center (lower pons) - excites inspiratory center; stimulation → prolonged inspiratory gasps (apneusis); normally inhibited by pneumotaxic center
Voluntary control: cerebral cortex can temporarily override brainstem (breath-holding, singing).
Chemoreceptors
Central chemoreceptors:
- Located on ventral surface of medulla
- Respond to changes in CSF pH/PCO₂ (CO₂ freely diffuses across blood-brain barrier → forms H⁺)
- Most important for minute-to-minute control of ventilation
- Not directly sensitive to O₂
Peripheral chemoreceptors:
- Carotid bodies (CN IX - most important) and aortic bodies (CN X)
- Respond to: ↓ PaO₂ (<60 mmHg), ↑ PaCO₂, ↓ pH
- Primary stimulus in patients with chronic hypercapnia (COPD) who have lost CO₂ sensitivity → "hypoxic drive" (caution with high-flow O₂)
- Also respond to: cyanide, hypotension, severe anemia
Summary of ventilatory responses:
- PaCO₂: most potent stimulus; ↑ by 1 mmHg → ↑ ventilation by ~3 L/min
- pH: acidosis stimulates breathing (partially independent of PaCO₂)
- PaO₂: weak stimulus until PaO₂ drops below 60 mmHg (below the flat part of ODC)
(Costanzo Physiology 7th Edition)
Lung Reflexes (Stretch Receptors)
- Hering-Breuer Inflation Reflex: pulmonary stretch receptors (in smooth muscle) → via vagus → inhibit inspiration when lungs overdistended (prevents over-inflation)
- Deflation reflex: stimulates inspiration when lungs collapse
- Irritant receptors (rapidly adapting): cough, bronchoconstriction in response to chemicals/particulates
- J receptors (juxtacapillary, C-fibers): activated by pulmonary edema, emboli → rapid shallow breathing, dyspnea
12. Applied / Clinical Correlations
12a. Hypoxemia - Five Mechanisms
| Mechanism | A-a Gradient | Response to O₂ | Example |
|---|---|---|---|
| Hypoventilation | Normal | Corrects | Opioid overdose, obesity hypoventilation |
| Low FiO₂ | Normal | Corrects | High altitude |
| V/Q Mismatch | ↑ | Corrects | COPD, asthma, pneumonia |
| Diffusion impairment | ↑ | Corrects | Pulmonary fibrosis |
| Shunt | ↑ | Does NOT correct | ARDS, hepatopulmonary syndrome |
12b. COPD
- Emphysema: ↓ elastic recoil, ↑ compliance, ↑ TLC/RV, ↓ DLCO (destroyed alveolar surface), airway collapse on expiration (dynamic hyperinflation), barrel chest
- Chronic bronchitis: excess mucus, ↑ airway resistance, V/Q mismatch
- FEV₁/FVC < 0.70 is diagnostic criterion
- "Pink puffer" (emphysema): maintains near-normal PaO₂ by hyperventilating; dyspnea prominent, thin
- "Blue bloater" (chronic bronchitis): hypercapnia, polycythemia, cor pulmonale, edema
12c. Asthma
- Reversible airway obstruction: ↑ resistance, air trapping, ↑ RV
- Triggers: allergens, exercise, cold air, irritants
- Pathology: airway inflammation, smooth muscle hypertrophy, mucus plugging
- Treatment: β₂-agonists (bronchodilation via cAMP), inhaled corticosteroids, leukotriene antagonists
12d. Restrictive Lung Disease
- ↓ TLC, ↓ VC, ↓ FVC; FEV₁/FVC normal or ↑
- Causes: pulmonary fibrosis (IPF), sarcoidosis, pneumoconiosis, pleural effusion, kyphoscoliosis, obesity, neuromuscular disease (ALS, myasthenia gravis)
- IPF: progressive fibrosis, Velcro crackles, clubbing, ↓ DLCO → lung transplant
12e. Pulmonary Embolism (PE)
- Clot occludes pulmonary artery → dead space ↑ (V/Q → ∞)
- Hypoxemia due to V/Q mismatch in rest of lung + reflex bronchoconstriction
- Classic presentation: sudden dyspnea, pleuritic chest pain, tachycardia
- ABG: hypoxia + hypocapnia (hyperventilation), ↑ A-a gradient
- Wells score for pretest probability; CT-PA for diagnosis; anticoagulation for treatment
12f. ARDS (Acute Respiratory Distress Syndrome)
- Diffuse alveolar damage → protein-rich edema → ↓ compliance, ↓ DLCO, severe hypoxemia (shunt)
- Berlin criteria: acute onset <1 week, bilateral infiltrates, PaO₂/FiO₂ ≤300 (mild), ≤200 (moderate), ≤100 (severe), not fully explained by heart failure
- Treatment: lung-protective ventilation (6 mL/kg tidal volume, PEEP to open collapsed alveoli), prone positioning in severe ARDS
12g. Pulmonary Hypertension
- Mean PAP >20 mmHg at rest
- Causes: idiopathic (IPAH, PAH), left heart failure (Group 2), chronic hypoxia/COPD (Group 3), PE (Group 4)
- Chronic hypoxia → sustained HPV → remodeling → fixed pulmonary hypertension → right heart failure (cor pulmonale)
- Treatment of PAH: phosphodiesterase-5 inhibitors (sildenafil), prostacyclin analogues, endothelin receptor antagonists
12h. Respiratory Failure
| Type | PaO₂ | PaCO₂ | Mechanism | Example |
|---|---|---|---|---|
| Type 1 (Hypoxemic) | ↓ | Normal or ↓ | V/Q mismatch, shunt, diffusion | Pneumonia, ARDS, PE |
| Type 2 (Hypercapnic) | ↓ | ↑ | Hypoventilation (↓ alveolar ventilation) | COPD, neuromuscular, obesity |
12i. High Altitude Physiology
- ↓ Barometric pressure → ↓ PiO₂ → hypoxemia → hyperventilation (respiratory alkalosis)
- Compensations over days-weeks:
- ↑ EPO → polycythemia
- ↑ 2,3-DPG → rightward shift of ODC
- Renal HCO₃⁻ excretion to normalize pH
- ↑ pulmonary vasodilation (locally)
- Acute Mountain Sickness (AMS): headache, nausea at altitude; treated with acetazolamide (carbonic anhydrase inhibitor → forced bicarbonate diuresis → metabolic acidosis → drives ventilation)
12j. CO₂ Narcosis and Oxygen Therapy in COPD
Patients with chronic hypercapnia (type 2 RF) adapt their central chemoreceptors to high PaCO₂. Their main ventilatory drive becomes hypoxemia via peripheral chemoreceptors ("hypoxic drive"). Giving high-flow O₂ removes this drive → hypoventilation → worsening hypercapnia.
- Use controlled O₂ (24-28% Venturi mask) targeting SpO₂ 88-92% in acute exacerbations of COPD.
13. Key Numbers to Remember
| Parameter | Normal Value |
|---|---|
| PaO₂ | 80-100 mmHg |
| PaCO₂ | 35-45 mmHg |
| pH | 7.35-7.45 |
| SaO₂ | 95-100% |
| HCO₃⁻ | 22-26 mEq/L |
| A-a gradient | <15 mmHg (↑ with age) |
| FEV₁/FVC | ≥0.70 |
| Tidal Volume | ~500 mL |
| Dead Space (anatomical) | ~150 mL |
| Alveolar PO₂ | ~104 mmHg |
| Mixed venous PO₂ | ~40 mmHg |
| P50 | 26.8 mmHg |
| O₂ content arterial blood | ~20 mL/dL |
| Normal V/Q | 0.8 |
| Pulmonary artery pressure (mean) | ~15 mmHg |
Sources
- Guyton and Hall Textbook of Medical Physiology (14th ed.) - Chapters 38-41
- Costanzo Physiology (7th ed.) - Chapter 5
- Ganong's Review of Medical Physiology (26th ed.) - Section VI
- Fishman's Pulmonary Diseases and Disorders (5th ed.)
Tell me everything about renal anatomy and physiology from basics to clinicals. And also include diagrams and illustrations.
Reading File
Finding Sources
Finding Sources
Finding Sources
Finding Sources
Finding Sources
Finding Sources
Finding Sources
Finding Sources
Finding Sources
Finding Sources
Reading File
Reading File
Reading File
Reading File
Reading File
Reading File
Reading File
Loading Image
Loading Image
Reading File
Reading File
Reading File
Loading Image
Reading File
Loading Image
Reading File
Loading Image
Loading Image
Renal Anatomy and Physiology: Basics to Clinicals
A comprehensive reference from anatomy through clinical correlations, sourced from Guyton and Hall Textbook of Medical Physiology (14e), Costanzo Physiology (7e), Brenner and Rector's The Kidney, and Comprehensive Clinical Nephrology.
1. Renal Anatomy
Gross Anatomy
- Two kidneys lie retroperitoneally on either side of the vertebral column at T12-L3
- Dimensions: ~11 cm long, 6 cm wide, 3 cm thick; each weighs ~150 g
- The right kidney sits slightly lower due to the liver
- Each kidney is surrounded by perirenal fat, renal (Gerota's) fascia, and pararenal fat
Macroscopic cross-section:
- Cortex (outer): contains glomeruli, proximal and distal convoluted tubules, cortical collecting ducts - pale in color
- Medulla (inner): contains loops of Henle, collecting ducts - forms 8-18 pyramid-shaped renal pyramids
- Renal columns of Bertin: cortical tissue extending between pyramids
- Renal papillae: tips of pyramids, where collecting ducts (of Bellini) drain into the minor calyces
- Minor calyces → Major calyces → Renal pelvis → Ureter
Vascular Supply
Blood supply to each kidney is approximately 1,200 mL/min (20-25% of cardiac output):
Renal artery → Segmental arteries → Interlobar arteries → Arcuate arteries → Interlobular (cortical radial) arteries → Afferent arteriole → Glomerular capillaries → Efferent arteriole
After the efferent arteriole:
- Cortical nephrons: efferent arteriole → peritubular capillaries (surround PCT and DCT)
- Juxtamedullary nephrons: efferent arteriole → vasa recta (long hairpin capillaries that descend into the medulla alongside the loop of Henle - critical for the countercurrent mechanism)
Venous drainage: follows the same arrangement in reverse → renal vein → inferior vena cava
Lymphatics and Innervation
- Lymphatics drain to para-aortic nodes
- Innervation: sympathetic fibers via T8-L1 (renal plexus); no significant parasympathetic innervation
- Sympathetic activation → afferent arteriole constriction → ↓ GFR; also stimulates renin release and tubular Na⁺ reabsorption
2. The Nephron - Functional Unit
Each kidney contains approximately 1-1.3 million nephrons. There are no new nephrons formed after birth - loss is permanent.
Two Types of Nephrons
| Feature | Cortical Nephrons (85%) | Juxtamedullary Nephrons (15%) |
|---|---|---|
| Location | Glomerulus in outer cortex | Glomerulus near corticomedullary junction |
| Loop of Henle | Short (stays in cortex) | Long (penetrates deep into medulla) |
| Efferent arteriole | Peritubular capillaries | Vasa recta |
| Function | General filtration/reabsorption | Urinary concentration/dilution |
Parts of the Nephron (in order of filtrate flow)
- Glomerulus + Bowman's capsule - filtration
- Proximal convoluted tubule (PCT) - bulk reabsorption
- Loop of Henle (descending thin limb → ascending thin limb → ascending thick limb) - countercurrent multiplier
- Distal convoluted tubule (DCT) - fine-tuning of NaCl, Ca²⁺, Mg²⁺
- Connecting tubule → Cortical collecting duct → Medullary collecting duct - final water/electrolyte regulation; site of ADH and aldosterone action
3. The Glomerulus and Glomerular Filtration
Glomerular Structure
The glomerulus is a tuft of ~50 parallel capillaries enclosed by Bowman's capsule. The filtration barrier has three layers:
- Fenestrated capillary endothelium (pores 70-100 nm): prevents cells from passing; pores covered by glycocalyx (negative charge)
- Glomerular basement membrane (GBM) (Type IV collagen + heparan sulfate proteoglycans): primary barrier to proteins; negatively charged → repels albumin
- Visceral epithelium (podocytes): foot processes with filtration slits (25-60 nm) bridged by the slit diaphragm (nephrin, podocin proteins) - main size barrier
Filtration barrier is:
- Freely permeable to: water, ions, glucose, amino acids, urea, creatinine, inulin
- Restricts: large proteins (albumin MW 69,000 Da is 0.04% filtered)
- Completely blocks: blood cells, large plasma proteins
Mesangial cells lie between glomerular capillaries - provide structural support, can contract (reducing GFR), phagocytose debris, and respond to angiotensin II.
Starling Forces at the Glomerulus (Net Filtration Pressure)
| Force | Value (mmHg) | Direction |
|---|---|---|
| Glomerular capillary hydrostatic pressure (PGC) | 60 | Favors filtration |
| Bowman's capsule hydrostatic pressure (PBS) | 18 | Opposes filtration |
| Glomerular oncotic pressure (πGC) | 32 | Opposes filtration |
| Bowman's oncotic pressure (πBS) | ~0 | Favors filtration |
| Net filtration pressure | ~10 mmHg | Favors filtration |
GFR = Kf × Net filtration pressure
GFR - Normal Values and Regulation
- Normal GFR: 125 mL/min (180 L/day) in men; ~110 mL/min in women
- Urine output: only 1-2 L/day → 99% of filtered water is reabsorbed
- Filtered load = GFR × Plasma concentration
Autoregulation of GFR (maintains GFR constant with MAP 80-180 mmHg):
- Myogenic mechanism: ↑ arterial pressure → afferent arteriole stretch → smooth muscle contracts → ↑ resistance → GFR stays constant
- Tubuloglomerular feedback (TGF): ↑ GFR → ↑ NaCl delivery to macula densa (in the thick ascending limb where the DCT contacts the afferent arteriole) → macula densa releases adenosine → afferent arteriole constricts → ↓ GFR. This is mediated by the juxtaglomerular apparatus (JGA)
Juxtaglomerular Apparatus (JGA):
- Macula densa cells: NaCl-sensing cells in the thick ascending limb
- Juxtaglomerular (granular) cells: modified smooth muscle cells in the afferent arteriole; contain renin granules; act as baroreceptors
- Mesangial cells (extraglomerular)
Factors altering GFR:
| Factor | Effect on GFR | Mechanism |
|---|---|---|
| ↑ Afferent arteriole tone | ↓ GFR | ↓ PGC |
| ↓ Afferent arteriole tone | ↑ GFR | ↑ PGC |
| ↑ Efferent arteriole tone (Angiotensin II) | ↑ GFR slightly | ↑ PGC (but too much → ↓ GFR) |
| ACE inhibitors/ARBs | ↓ GFR in RAS | Dilate efferent arteriole → ↓ PGC |
| NSAIDs | ↓ GFR | Block prostaglandin-mediated afferent dilation |
| Plasma oncotic pressure ↑ | ↓ GFR | ↑ opposing force |
| Urinary obstruction | ↓ GFR | ↑ PBS |
4. Tubular Transport - Segment by Segment
4a. Proximal Convoluted Tubule (PCT)
The workhorse of the nephron - reabsorbs ~67% of the filtered load.
Na⁺ reabsorption drives everything else:
- Na⁺-K⁺-ATPase on the basolateral membrane pumps Na⁺ out of the cell, creating a low intracellular [Na⁺] and negative intracellular voltage (-70 mV)
- Na⁺ enters the cell from the tubular lumen down its electrochemical gradient via cotransporters and exchangers on the apical membrane
What is reabsorbed in PCT:
- 100% of glucose - via SGLT2 (90%) + SGLT1 (10%) on apical membrane; GLUT2/GLUT1 on basolateral
- 100% of amino acids - Na⁺-amino acid cotransporter
- ~85% of HCO₃⁻ - Na⁺/H⁺ exchanger (NHE3) secretes H⁺ → H⁺ + HCO₃⁻ → H₂CO₃ → CO₂ + H₂O (via carbonic anhydrase) → CO₂ enters cell → regenerated to HCO₃⁻
- 67% of Na⁺, Cl⁻, K⁺, water
- 50% of urea (passive)
- Phosphate, uric acid, organic acids
Secretion in PCT:
- Organic acids (urate, oxalate, bile salts)
- Drugs: penicillin, probenecid, methotrexate (via organic anion transporters, OAT)
- H⁺ (acid secretion)
- Creatinine (small amount)
Tm (Transport Maximum): The maximum rate at which a substance can be reabsorbed. For glucose: Tm = ~375 mg/min. When plasma glucose exceeds ~180-200 mg/dL (renal threshold), glucose appears in urine (glucosuria).
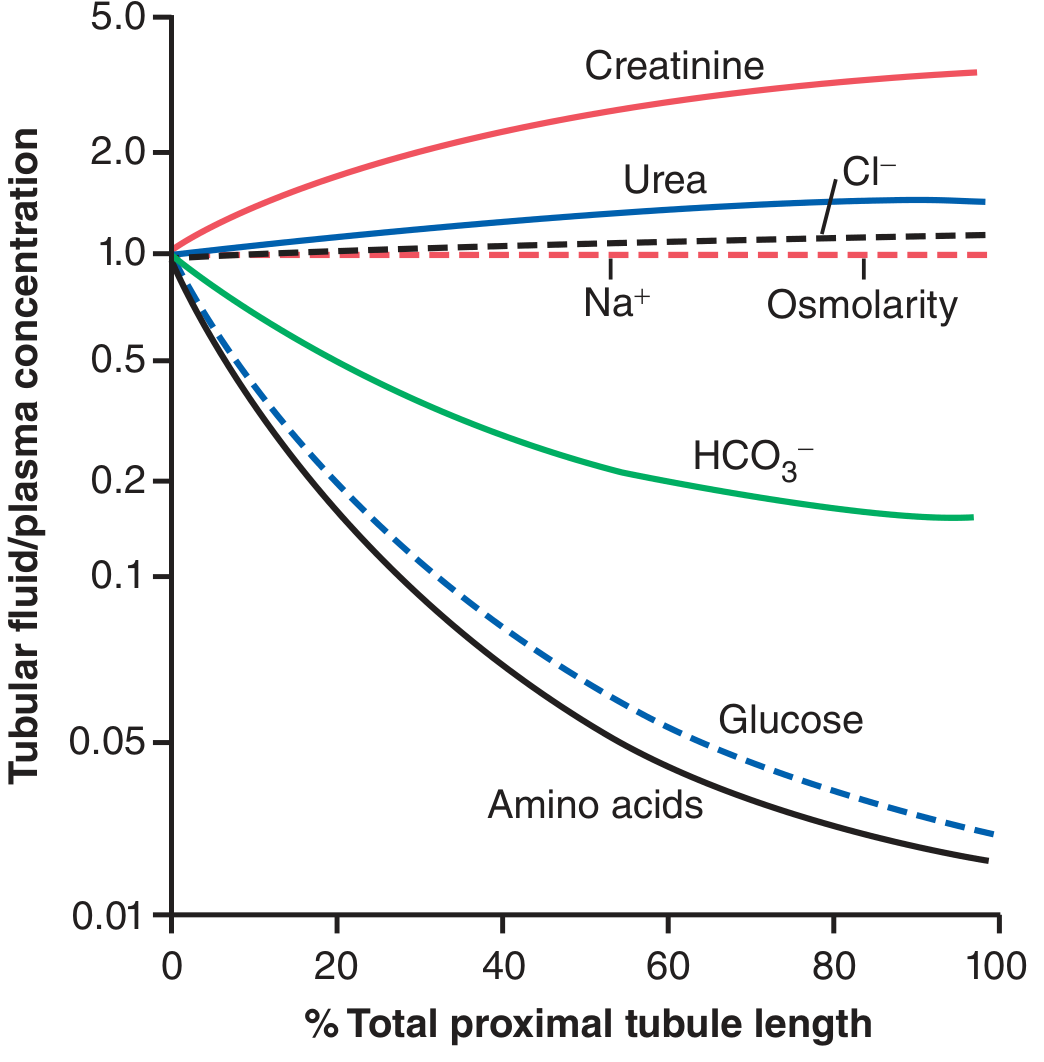
Figure: Changes in concentrations of different substances in tubular fluid along the proximal convoluted tubule. Amino acids and glucose are nearly completely reabsorbed; creatinine concentrates (not reabsorbed). (Guyton & Hall)
4b. Proximal Tubule Transport Mechanism (Illustration)
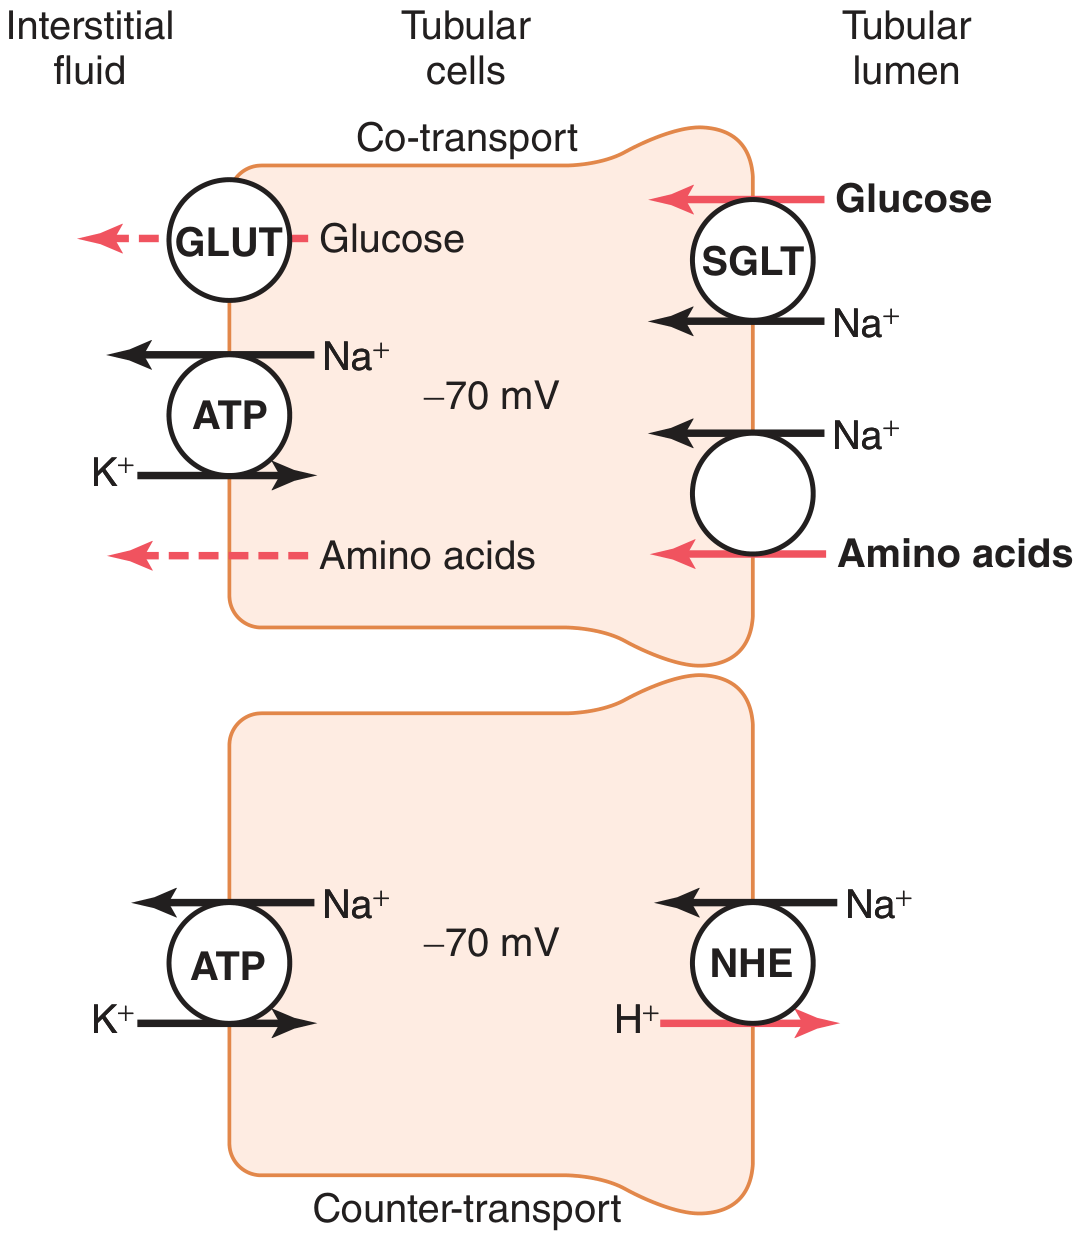
Figure: Secondary active transport. Upper cell - cotransport of glucose/amino acids with Na⁺ via SGLT on apical side; basolateral exit via GLUT. Lower cell - countertransport: NHE exchanges Na⁺ in for H⁺ out (acid secretion). (Guyton & Hall)
4c. Loop of Henle
Structure:
- Thin descending limb: highly permeable to water, less to solutes → water exits by osmosis as fluid descends into the hypertonic medulla → tubular fluid becomes concentrated (up to 1200 mOsm/L at the tip)
- Thin ascending limb: impermeable to water; some NaCl diffuses out passively
- Thick ascending limb (TAL): impermeable to water; actively pumps Na⁺, K⁺, 2Cl⁻ via NKCC2 cotransporter (furosemide target) → tubular fluid becomes dilute (~100 mOsm/L); this is the "diluting segment"
The NKCC2 transporter (thick ascending limb):
- Na⁺-K⁺-2Cl⁻ cotransporter: 1 Na⁺ + 1 K⁺ + 2 Cl⁻ into cell
- K⁺ recycles back through ROMK channels (into lumen) → generates a positive lumen potential → drives paracellular Ca²⁺ and Mg²⁺ reabsorption
- Loop diuretics (furosemide) block NKCC2 → massive Na⁺, K⁺, Cl⁻, Ca²⁺, Mg²⁺ loss in urine; abolish the medullary gradient → dilute urine even in the presence of ADH
4d. Distal Convoluted Tubule (DCT)
Two functionally distinct segments:
Early DCT ("diluting segment"):
- Reabsorbs Na⁺, Cl⁻ via NCC (Na⁺-Cl⁻ cotransporter) - thiazide diuretic target
- Also reabsorbs Ca²⁺ (stimulated by PTH) and Mg²⁺
- Impermeable to water
Late DCT and Cortical Collecting Tubule - Two cell types:
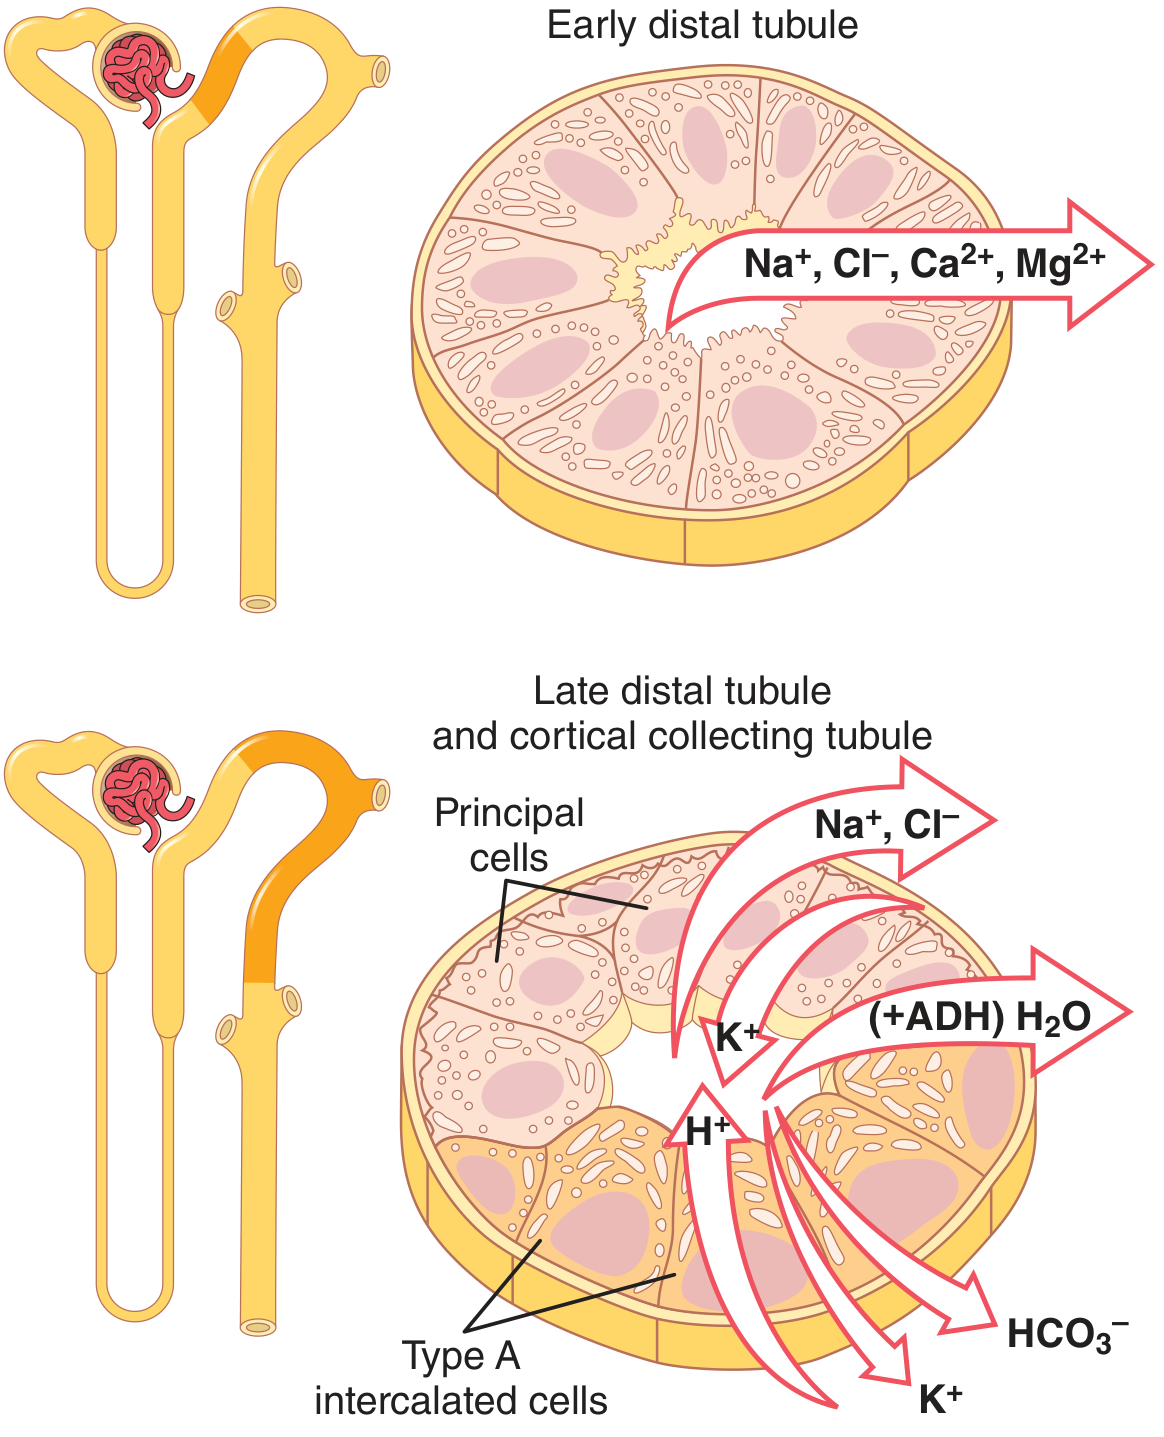
Figure: Early DCT reabsorbs Na⁺, Cl⁻, Ca²⁺, Mg²⁺. Late DCT/cortical collecting tubule contains principal cells (reabsorb Na⁺, secrete K⁺) and Type A intercalated cells (secrete H⁺, reabsorb K⁺ and HCO₃⁻). (Guyton & Hall)
Principal cells (60-70%):
- Apical: ENaC (epithelial Na⁺ channel) - aldosterone target; ROMK (K⁺ secretion)
- Basolateral: Na⁺-K⁺-ATPase
- Aldosterone ↑ ENaC and Na⁺-K⁺-ATPase synthesis → ↑ Na⁺ reabsorption + ↑ K⁺ secretion
- ADH (via V2 receptor → cAMP → AQP2 insertion) → ↑ water permeability
Type A intercalated cells (30-40%):
- Secrete H⁺ (via H⁺-ATPase and H⁺-K⁺-ATPase) into lumen
- Reabsorb K⁺ and HCO₃⁻
- Critical in metabolic acidosis (↑ H⁺ secretion)
Type B intercalated cells:
- Secrete HCO₃⁻ into lumen; reabsorb H⁺
- Active in metabolic alkalosis
4e. Aldosterone Mechanism (Na⁺ Channel and Diuretic Sites)
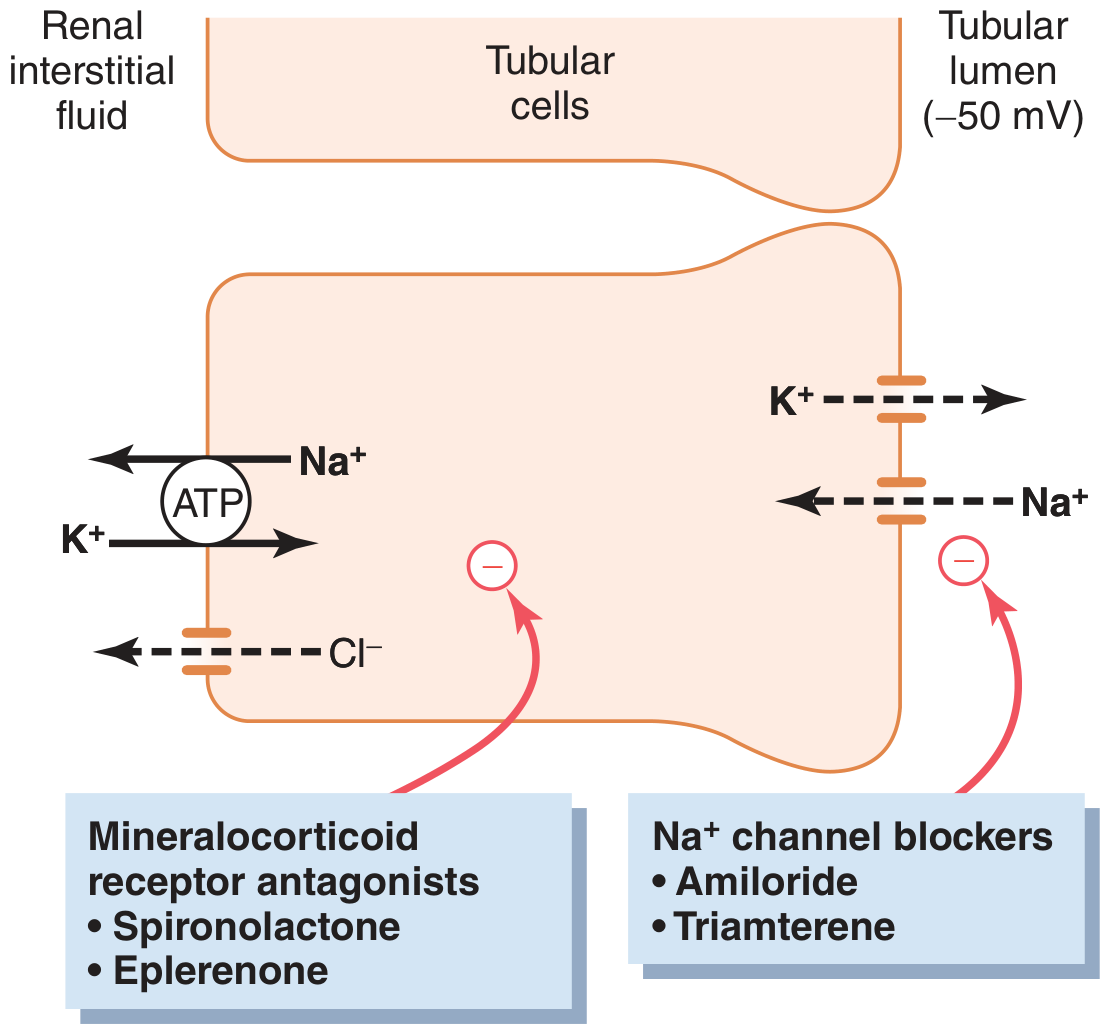
Figure: Na⁺ reabsorption in principal cells. Na⁺ enters via ENaC (luminal), pumped out by Na⁺-K⁺-ATPase (basolateral). K⁺ secreted into lumen via ROMK. Mineralocorticoid antagonists (spironolactone, eplerenone) block aldosterone receptors. Na⁺ channel blockers (amiloride, triamterene) directly block ENaC - both are potassium-sparing diuretics. (Guyton & Hall)
5. Urine Concentration and Dilution - The Countercurrent System
The kidney can produce urine ranging from 50 mOsm/L (very dilute) to 1200-1400 mOsm/L (highly concentrated).
The Medullary Osmotic Gradient
The renal medullary interstitium is hyperosmotic, graded from 300 mOsm/L at the corticomedullary junction to ~1200 mOsm/L at the papillary tip.
This gradient is maintained by:
- Active NaCl transport by thick ascending limb (pumps solute without water into interstitium → hyperosmotic medulla)
- Urea recycling: Urea is concentrated in the medullary collecting duct (permeable to urea via UT-A1/UT-A3 under ADH) → diffuses into inner medulla interstitium → some diffuses into thin ascending limb (UT-A2) → recycled
- Countercurrent exchange by vasa recta: descending vasa recta gains solutes and loses water; ascending vasa recta loses solutes and gains water → prevents "washout" of the medullary gradient
ADH (Vasopressin) - The Master Switch
ADH (arginine vasopressin, AVP) is produced in the hypothalamus (supraoptic and paraventricular nuclei) and released from the posterior pituitary.
Stimuli for ADH release:
- ↑ plasma osmolarity (main stimulus - detected by hypothalamic osmoreceptors)
- ↓ blood volume/pressure (detected by cardiopulmonary and carotid baroreceptors)
- Nausea (very potent)
- Morphine, nicotine, stress
Inhibitors of ADH:
- ↓ plasma osmolarity
- ↑ blood volume
- Alcohol (→ diuresis)
- Clonidine, haloperidol
ADH mechanism of action:
- Binds V2 receptors (Gs-coupled) on collecting duct principal cells
- → ↑ cAMP → PKA phosphorylates aquaporin-2 (AQP2)
- AQP2 vesicles insert into the apical membrane → ↑ water permeability
- Water moves from tubular lumen → hypertonic interstitium → vasa recta → concentrated urine
Without ADH (diabetes insipidus): collecting duct impermeable to water → large volumes of dilute urine (polyuria)
ADH excess (SIADH): inappropriate water retention → hyponatremia → confusion, seizures
Tubular Fluid Osmolarity Along the Nephron
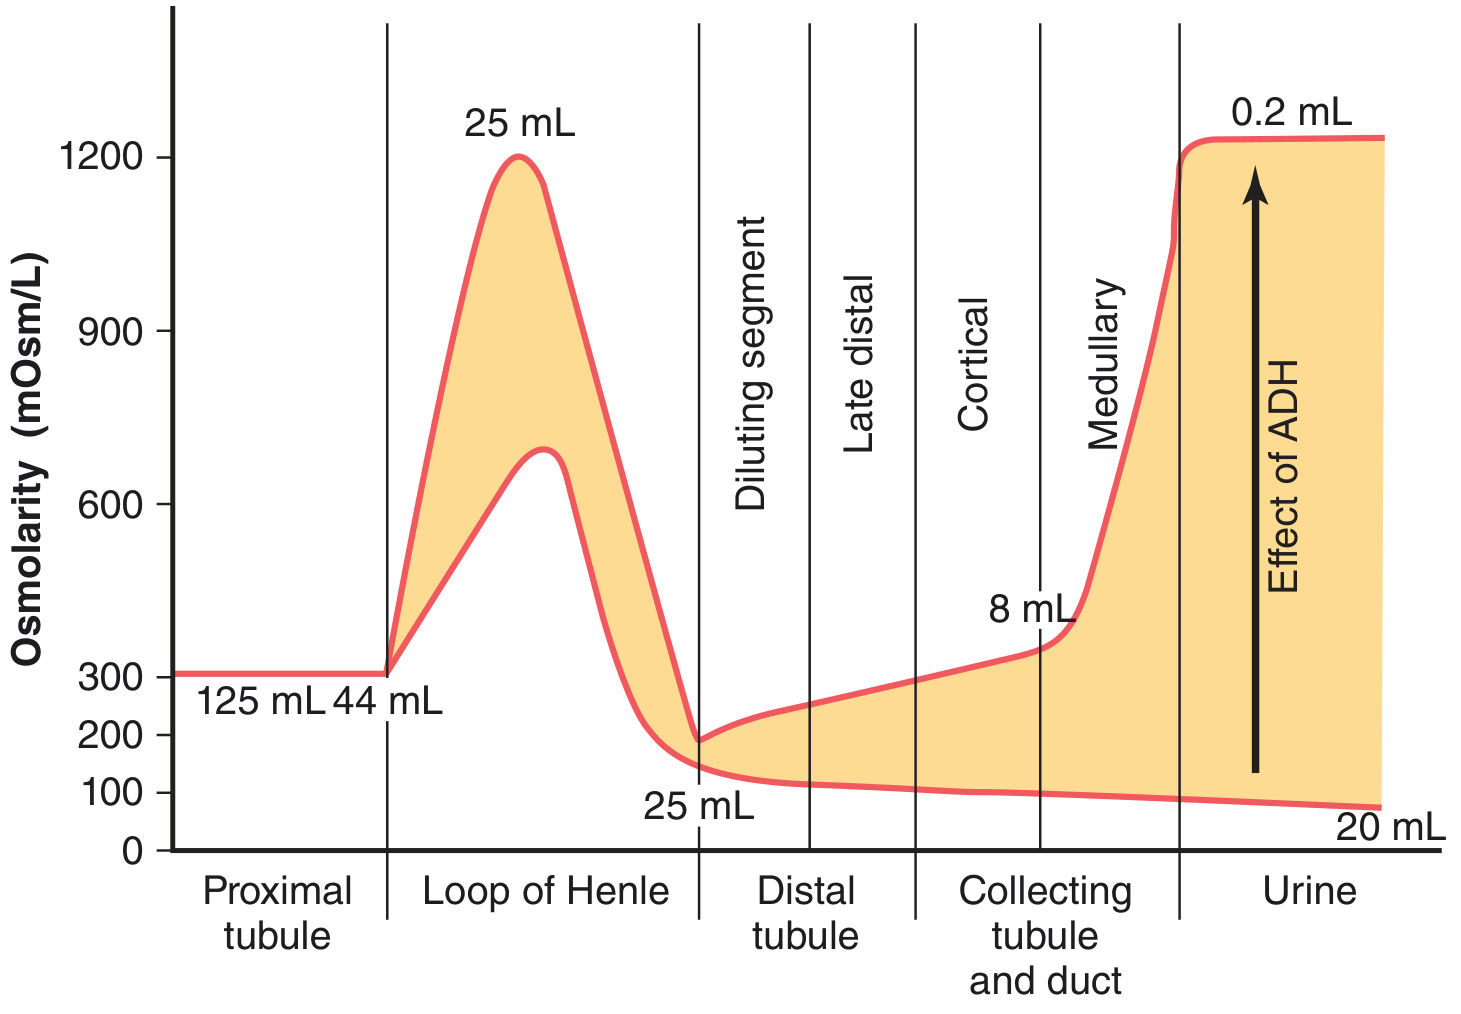
Figure: Osmolarity of tubular fluid at each segment. Proximal tubule - isosmotic (300 mOsm/L). Descending loop - increases to 1200 mOsm/L. Thick ascending loop - dilutes to ~100 mOsm/L. With high ADH: collecting duct fluid equilibrates with hypertonic medulla → concentrated urine (1200 mOsm/L). With low ADH: dilute urine (20 mOsm/L). Numbers = volumes in mL/min. (Guyton & Hall)
Table: Tubule Characteristics for Urine Concentration
| Segment | Active NaCl Transport | Water Permeability | NaCl Permeability | Urea Permeability |
|---|---|---|---|---|
| Proximal tubule | ++ | ++ | + | + |
| Thin descending limb | 0 | ++ | + | + |
| Thin ascending limb | 0 | 0 | + | + |
| Thick ascending limb | ++ | 0 | 0 | 0 |
| Distal tubule | + | +ADH | 0 | 0 |
| Cortical collecting duct | + | +ADH | 0 | 0 |
| Inner medullary collecting duct | + | +ADH | 0 | +ADH |
(ADH = permeability only present when ADH is high)
6. Renal Clearance - Measuring Kidney Function
Clearance (C) = volume of plasma completely cleared of a substance per unit time:
C = (U × V̇) / P (mL/min)
Where U = urine concentration, V̇ = urine flow rate, P = plasma concentration
Key Substances and Their Clinical Use
Inulin clearance = GFR (gold standard)
- Freely filtered, not reabsorbed or secreted → clearance = GFR exactly
- Not used clinically (requires IV infusion)
Creatinine clearance ≈ GFR (clinical standard)
- Freely filtered, small amount secreted → slightly overestimates GFR by ~10-15%
- MDRD and CKD-EPI equations use serum creatinine to estimate GFR (eGFR)
- If GFR falls to 50% → plasma creatinine doubles (hyperbolic relationship)
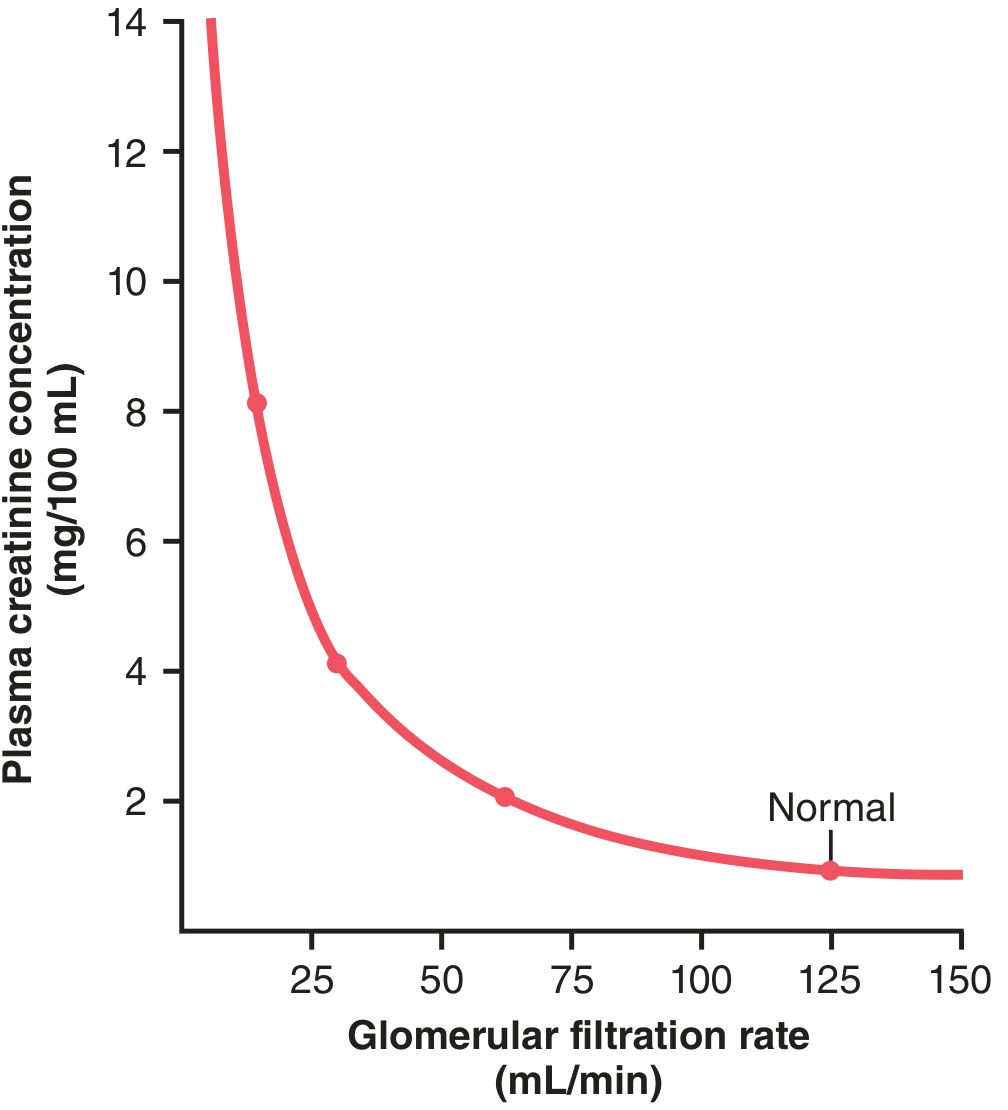
Figure: As GFR falls, plasma creatinine rises in a hyperbolic fashion. A 50% decrease in GFR doubles serum creatinine. (Guyton & Hall)
PAH (para-aminohippuric acid) clearance ≈ Renal Plasma Flow
- Filtered + secreted (90% extracted in one pass) → clearance ≈ renal plasma flow (~600 mL/min)
- Renal Blood Flow (RBF) = RPF / (1 - hematocrit) = 600 / 0.55 ≈ 1100 mL/min
- Filtration fraction (FF) = GFR/RPF = 125/600 = ~0.20 (20%)
Clearance ratios:
- Clearance ratio < 1 (Cs/Cinulin < 1): substance is reabsorbed (glucose = 0 in normal person)
- Clearance ratio = 1: neither reabsorbed nor secreted (inulin)
- Clearance ratio > 1: substance is secreted (PAH, creatinine)
7. Renin-Angiotensin-Aldosterone System (RAAS)
The RAAS is the most important hormonal system for long-term blood pressure and volume regulation.
Stimulus for Renin Release (from JG cells):
- ↓ afferent arteriole stretch (↓ BP)
- ↓ NaCl delivery to macula densa
- Sympathetic stimulation (β₁ receptors on JG cells)
- Prostaglandins (PGE₂, PGI₂) stimulate renin
Cascade:
Renin (JG cells of kidney) → cleaves angiotensinogen (liver) → Angiotensin I
→ ACE (angiotensin-converting enzyme, mainly pulmonary endothelium) → Angiotensin II
Effects of Angiotensin II:
- Vasoconstriction (particularly efferent arteriole > afferent) → ↑ GFR maintained even in low CO
- Adrenal cortex (zona glomerulosa) → ↑ aldosterone secretion → ↑ Na⁺ reabsorption + K⁺ secretion in collecting duct
- Posterior pituitary → ↑ ADH release
- Hypothalamus → thirst
- Proximal tubule → ↑ Na⁺-H⁺ exchange → ↑ Na⁺ and HCO₃⁻ reabsorption
- Adrenal medulla → catecholamine release
Aldosterone (Mineralocorticoid):
- Produced in adrenal cortex zona glomerulosa
- Binds intracellular mineralocorticoid receptor → transcription of new proteins
- ↑ ENaC (apical) and Na⁺-K⁺-ATPase (basolateral) in principal cells
- Net effect: Na⁺ retained, K⁺ excreted, H₂O retained (follows Na⁺)
- Excess aldosterone (primary hyperaldosteronism/Conn's syndrome): hypertension, hypokalemia, metabolic alkalosis
Atrial Natriuretic Peptide (ANP):
- Released from cardiac atria when stretched (↑ volume)
- Antagonizes RAAS: dilates afferent arteriole + constricts efferent arteriole → ↑ GFR
- Inhibits renin, aldosterone, ADH release
- Direct inhibition of NaCl reabsorption in collecting duct
- Net: natriuresis (Na⁺ + water excretion) → ↓ volume
8. Renal Acid-Base Regulation
The kidney maintains plasma pH 7.35-7.45 by:
- Reabsorbing filtered HCO₃⁻ (85% in PCT)
- Generating new HCO₃⁻ (titratable acids + NH₄⁺ excretion)
- Secreting H⁺ into the urine
Bicarbonate Reabsorption (PCT - 85%):
- H⁺ secreted by NHE3 (Na⁺/H⁺ exchanger) into lumen
- H⁺ + HCO₃⁻ → H₂CO₃ → CO₂ + H₂O (via luminal carbonic anhydrase IV)
- CO₂ diffuses into cell → H₂CO₃ → H⁺ + HCO₃⁻ (via intracellular CA II)
- HCO₃⁻ exits basolateral membrane → blood
- Net: HCO₃⁻ "reclaimed" without being truly excreted
H⁺ Secretion and New HCO₃⁻ Generation (Collecting Duct):
- Type A intercalated cells: H⁺-ATPase and H⁺-K⁺-ATPase pump H⁺ into the lumen
- H⁺ buffered in urine by:
- Phosphate (titratable acid): HPO₄²⁻ + H⁺ → H₂PO₄⁻
- Ammonia buffer: NH₃ (produced from glutamine in PCT cells) + H⁺ → NH₄⁺ (trapped in urine)
- NH₄⁺ excretion is the main mechanism for eliminating H⁺ in metabolic acidosis
Response to Acid-Base Disorders:
- Metabolic acidosis → ↑ H⁺ secretion, ↑ NH₄⁺ production, ↑ HCO₃⁻ generation
- Metabolic alkalosis → ↓ H⁺ secretion, ↑ HCO₃⁻ excretion (Type B intercalated cells secrete HCO₃⁻)
- Kidneys take hours to days to compensate (slower than lungs but more complete)
9. Electrolyte Handling by the Kidney
Potassium (K⁺)
- Freely filtered; ~67% reabsorbed in PCT (passive)
- ~20% reabsorbed in thick ascending limb (via NKCC2)
- Secretion in principal cells of collecting duct = main determinant of K⁺ excretion
- Aldosterone ↑ K⁺ secretion
- High tubular flow rate ↑ K⁺ secretion (dilutes luminal K⁺)
- Alkalosis → K⁺ secretion ↑; Acidosis → K⁺ secretion ↓
- Clinical: Loop/thiazide diuretics → K⁺ loss (hypokalemia); K⁺-sparing diuretics (spironolactone, amiloride) → K⁺ retention
Calcium (Ca²⁺)
- ~60% filtered (40% protein-bound, not filtered)
- ~67% reabsorbed PCT (passive, paracellular)
- ~25% thick ascending limb (paracellular, driven by positive lumen potential via NKCC2)
- ~8% early DCT (active, via TRPV5 channels, stimulated by PTH)
- PTH → ↑ Ca²⁺ reabsorption in DCT and connecting tubule; ↑ 1,25-(OH)₂ vitamin D synthesis (stimulates intestinal absorption)
- Loop diuretics → ↓ Ca²⁺ reabsorption (used in hypercalcemia)
- Thiazides → ↑ Ca²⁺ reabsorption in DCT (used in hypercalciuria/calcium stones)
Phosphate (PO₄³⁻)
- ~80% reabsorbed in PCT via NaPi-IIa/IIc (Na⁺-phosphate cotransporter)
- PTH inhibits NaPi → ↑ phosphate excretion (phosphaturic effect)
- FGF-23 (from osteocytes) also inhibits NaPi; elevated in CKD → phosphate retention
Magnesium (Mg²⁺)
- ~25% reabsorbed PCT
- ~70% thick ascending limb (paracellular, driven by lumen positive potential)
- ~5% DCT
- Loop diuretics → Mg²⁺ loss (hypomagnesemia - common in ICU patients on furosemide)
- Hypomagnesemia causes refractory hypokalemia (impairs K⁺ reabsorption)
Urea
- Freely filtered; ~50% passively reabsorbed in PCT
- Secreted into thin ascending limb (recycling)
- ~40% of inner medullary interstitial osmolality is from urea
- BUN (blood urea nitrogen) rises in renal failure; BUN:Creatinine ratio:
- Normal: 10:1 to 20:1
-
20:1 → prerenal azotemia (↑ urea reabsorption with ↓ flow), upper GI bleed, protein catabolism
- <10:1 → liver disease (↓ urea synthesis), protein malnutrition
10. Pressure-Natriuresis and Long-Term Blood Pressure Control
Pressure natriuresis: when arterial pressure rises, the kidneys excrete more Na⁺ and water → ↓ ECF volume → ↓ BP back to normal. This is the key mechanism for long-term BP control.
How it works:
- ↑ MAP → ↑ renal perfusion pressure → ↑ GFR (minor)
- ↑ MAP → ↓ renin, angiotensin II, aldosterone → ↓ tubular Na⁺ reabsorption
- ↑ MAP → ↑ medullary blood flow → "washout" of medullary gradient → ↓ urine concentration → ↑ water excretion
11. Clinical Correlations
11a. Staging of Chronic Kidney Disease (CKD)
CKD is defined as kidney damage or GFR <60 mL/min/1.73m² for >3 months.
| Stage | GFR (mL/min/1.73m²) | Description |
|---|---|---|
| G1 | ≥90 | Normal/high GFR + kidney damage markers |
| G2 | 60-89 | Mildly decreased |
| G3a | 45-59 | Mild-moderate decrease |
| G3b | 30-44 | Moderate-severe decrease |
| G4 | 15-29 | Severely decreased |
| G5 | <15 | Kidney failure (dialysis/transplant) |
Consequences of CKD:
- ↓ erythropoietin → normocytic anemia
- ↓ 1-α hydroxylase → ↓ active vitamin D (1,25-OH₂D₃) → hypocalcemia, secondary hyperparathyroidism → renal osteodystrophy
- ↑ phosphate retention → hyperphosphatemia (worsens hypocalcemia, calcification of vessels)
- ↑ BUN, creatinine → uremia (encephalopathy, pericarditis, nausea)
- ↓ H⁺ excretion → metabolic acidosis
- ↓ K⁺ excretion → hyperkalemia (life-threatening)
- Na⁺ and water retention → hypertension and edema
11b. Acute Kidney Injury (AKI) - Prerenal, Intrinsic, Postrenal
| Type | Cause | BUN:Cr | FENa | Urine Osmolarity | Urine Na⁺ |
|---|---|---|---|---|---|
| Prerenal | Volume depletion, CHF, hepatorenal syndrome | >20:1 | <1% | >500 mOsm/L | <20 mEq/L |
| Intrinsic (ATN) | Ischemia, nephrotoxins (aminoglycosides, contrast) | 10-15:1 | >2% | ~300 mOsm/L (isosthenuria) | >40 mEq/L |
| Postrenal | Obstruction (BPH, stones, malignancy) | >20:1 | Variable | Variable | Variable |
FENa (Fractional Excretion of Sodium):
FENa = (UNa × PCr) / (PNa × UCr) × 100
- <1%: tubules intact and avidly reabsorbing Na⁺ → prerenal or early obstruction
- >2%: tubular damage → ATN (can't reabsorb Na⁺)
Caution: FENa <1% can occur in ATN caused by contrast nephropathy, myoglobinuria, or early obstruction. Use FEUrea (<35% = prerenal) if patient is on diuretics.
11c. Glomerulonephritis (GN)
Nephritic syndrome (inflammation, hematuria):
- Poststreptococcal GN: immune complex deposition (GBM); low complement; "lumpy-bumpy" pattern on IF; 2-4 weeks post-strep throat/skin infection
- IgA nephropathy (Berger disease): most common GN worldwide; mesangial IgA deposits; hematuria concurrent with URI; IgA visible on IF
- Rapidly Progressive GN (RPGN)/Crescentic GN: pauci-immune (ANCA+, e.g., Wegener's/GPA, MPA) or anti-GBM (Goodpasture's - linear IgG on IF + pulmonary hemorrhage)
Nephrotic syndrome (podocyte/GBM damage, heavy proteinuria >3.5g/day):
- Minimal Change Disease (MCD): children; normal LM; effacement of podocyte foot processes on EM; responds to steroids
- Focal Segmental Glomerulosclerosis (FSGS): focal scarring; HIV, obesity, heroin; poor steroid response
- Membranous Nephropathy: thickened GBM, "spike and dome" pattern; subepithelial deposits; associated with PLA2R antibodies, hepatitis B, SLE, malignancy
- Diabetic Nephropathy: most common cause of CKD in developed world; Kimmelstiel-Wilson nodules (nodular glomerulosclerosis); microalbuminuria → macroalbuminuria → nephrotic syndrome
11d. Diuretics Summary
| Diuretic | Site of Action | Transporter | Effect | Key Use/Side Effects |
|---|---|---|---|---|
| Acetazolamide | PCT | Carbonic anhydrase | ↓ HCO₃⁻ reabsorption → metabolic acidosis, ↑ NaHCO₃ excretion | Glaucoma, altitude sickness; hypokalemia |
| Loop (furosemide, bumetanide) | Thick ascending limb | NKCC2 | ↓ NaCl, K⁺, Ca²⁺, Mg²⁺ reabsorption; abolish medullary gradient | Acute pulmonary edema, hypercalcemia; hypokalemia, hyponatremia, ototoxicity |
| Thiazide (hydrochlorothiazide, chlorthalidone) | Early DCT | NCC | ↓ NaCl reabsorption; ↑ Ca²⁺ reabsorption | Hypertension, nephrogenic DI, calcium stones; hypokalemia, hyponatremia, hyperglycemia, hyperuricemia |
| K⁺-sparing: Spironolactone/Eplerenone | Collecting duct | Mineralocorticoid receptor antagonist | ↓ Na⁺ reabsorption, ↓ K⁺ secretion | Heart failure (survival benefit), Conn's syndrome; hyperkalemia, gynecomastia (spiro) |
| K⁺-sparing: Amiloride/Triamterene | Collecting duct | ENaC blocker | ↓ Na⁺ reabsorption, ↓ K⁺ secretion | Used with loop/thiazide; hyperkalemia |
11e. Diabetes Insipidus (DI) vs SIADH
| Feature | Central DI | Nephrogenic DI | SIADH |
|---|---|---|---|
| Mechanism | ↓ ADH secretion | ↓ ADH action (AQP2) | ↑ ADH secretion |
| Serum Na⁺ | ↑ (hypernatremia) | ↑ (hypernatremia) | ↓ (hyponatremia) |
| Urine osmolarity | <300 mOsm/L | <300 mOsm/L | >100 mOsm/L |
| Urine Na⁺ | - | - | >40 mEq/L |
| Causes | Trauma, surgery, tumors | Lithium, demeclocycline, hypercalcemia | Lung cancer (SCLC), CNS disease, drugs |
| Treatment | Desmopressin (DDAVP) | Thiazides + low Na diet | Fluid restriction; tolvaptan (V2 antagonist) |
11f. Renal Tubular Acidosis (RTA) - "Normal Anion Gap Metabolic Acidosis"
| Type | Defect | Urine pH | K⁺ | Cause | Treatment |
|---|---|---|---|---|---|
| Type 1 (Distal) | H⁺ secretion ↓ in collecting duct | >5.5 (can't acidify) | ↓ (hypokalemia) | Sjögren's, SLE, amphotericin B | NaHCO₃ or sodium citrate |
| Type 2 (Proximal) | HCO₃⁻ reabsorption ↓ in PCT | <5.5 (when HCO₃⁻ is low) | ↓ | Fanconi syndrome, multiple myeloma, carbonic anhydrase inhibitors | NaHCO₃ + KCl; thiazides |
| Type 4 | Aldosterone deficiency or resistance | <5.5 | ↑ (hyperkalemia) | Diabetic nephropathy (hyporeninemic hypoaldosteronism), ACE inhibitors, Addison's | Fludrocortisone or dietary K⁺ restriction |
11g. RAAS Blockade - Clinical Applications
- ACE inhibitors / ARBs: dilate efferent arteriole → ↓ glomerular pressure → renoprotective in diabetic and hypertensive nephropathy; reduce proteinuria; can cause acute AKI in bilateral renal artery stenosis (remove the efferent constriction maintaining GFR)
- SGLT2 inhibitors (empagliflozin, dapagliflozin): block SGLT2 in PCT → glucosuria + natriuresis; reduce intraglomerular pressure via tubuloglomerular feedback; strongly renoprotective in CKD + DM2; also reduce cardiovascular mortality
- MRA (spironolactone, finerenone): block mineralocorticoid receptor in collecting duct; renoprotective in CKD + DM; ↑ K⁺ (monitor)
12. Key Normal Values to Remember
| Parameter | Normal Value |
|---|---|
| GFR | 125 mL/min (men); ~110 mL/min (women) |
| Renal plasma flow (RPF) | ~600 mL/min |
| Renal blood flow (RBF) | ~1100 mL/min (20-25% cardiac output) |
| Filtration fraction | ~0.20 (20%) |
| Urine output | 1-2 L/day |
| Glomerular capillary pressure | ~60 mmHg |
| Bowman's capsule pressure | ~18 mmHg |
| Glomerular oncotic pressure | ~32 mmHg |
| Net filtration pressure | ~10 mmHg |
| Proximal tubule reabsorption | 67% of filtrate |
| Medullary osmolarity (max) | ~1200 mOsm/L |
| Serum creatinine (male) | 0.7-1.2 mg/dL |
| BUN:Creatinine ratio | 10:1 to 20:1 |
| Urine glucose Tm | ~375 mg/min |
| Renal threshold for glucose | ~180-200 mg/dL |
Sources
- Guyton and Hall Textbook of Medical Physiology (14th ed.) - Chapters 26-32
- Costanzo Physiology (7th ed.) - Chapter 6
- Brenner and Rector's The Kidney (11th ed.)
- Comprehensive Clinical Nephrology (7th ed.)
- Tietz Textbook of Laboratory Medicine (7th ed.)
Now cardiology
Reading File
Finding Sources
Finding Sources
Finding Sources
Finding Sources
Finding Sources
Reading File
Reading File
Reading File
Reading File
Reading File
Reading File
Loading Image
Loading Image
Reading File
Finding Sources
Reading File
Reading File
Reading File
Reading File
Loading Image
Loading Image
Reading File
Finding Sources
Reading File
Loading Image
Finding Sources
Reading File
Finding Sources
Reading File
Reading File
Cardiology: Anatomy, Physiology, and Clinicals
A complete reference from cardiac structure through electrophysiology, hemodynamics, and major clinical syndromes - sourced from Guyton and Hall Medical Physiology (14e), Costanzo Physiology (7e), Goldman-Cecil Medicine, Braunwald's Heart Disease, and Harrison's Principles of Internal Medicine (22e).
1. Cardiac Anatomy
Gross Structure
The heart is a hollow muscular organ (~250-350 g in adults) located in the mediastinum, slightly left of midline, enclosed in the pericardial sac (two layers: fibrous and serous, with ~15-50 mL pericardial fluid for lubrication).
Four chambers:
- Right atrium (RA): receives deoxygenated blood from superior vena cava (SVC), inferior vena cava (IVC), and coronary sinus; contains the SA node and Eustachian valve (vestigial)
- Right ventricle (RV): pumps to pulmonary circulation (low pressure ~25/8 mmHg); crescent-shaped cross section; thinner walls than LV
- Left atrium (LA): receives oxygenated blood from 4 pulmonary veins; contains the fossa ovalis on interatrial septum (remnant of foramen ovale)
- Left ventricle (LV): pumps to systemic circulation (high pressure ~120/80 mmHg); elliptical, thick-walled (8-12 mm); contains papillary muscles and trabeculae carnae
Heart Valves
| Valve | Location | Cusps/Leaflets | Opens When | Closes When |
|---|---|---|---|---|
| Tricuspid (right AV) | Between RA and RV | 3 | RV fills (diastole) | RV contracts (systole) |
| Pulmonary (pulmonic) | RV outflow to pulmonary trunk | 3 semilunar | RV pressure > pulmonary | RV relaxes |
| Mitral (bicuspid, left AV) | Between LA and LV | 2 | LV fills (diastole) | LV contracts (systole) |
| Aortic | LV outflow to aorta | 3 semilunar | LV pressure > aortic | LV relaxes |
AV valves are attached to papillary muscles via chordae tendineae - these prevent valve prolapse (billowing back) during systole. Papillary muscle rupture (e.g., post-MI) → acute mitral regurgitation.
Coronary Circulation
Right Coronary Artery (RCA):
- Originates from right coronary sinus of aorta
- Supplies: RA, RV, SA node (~60%), AV node (~90%), inferior LV
- Branches: posterior descending artery (PDA) in right-dominant circulation (~85% of people) - supplies inferior wall and posterior interventricular septum
Left Coronary Artery (LCA):
- Short main (left main ~1-2 cm) then divides into:
- Left anterior descending (LAD): supplies anterior LV, anterior 2/3 of interventricular septum, anterior papillary muscle, apex. "Artery of widowmaker"
- Left circumflex (LCx): supplies lateral and posterior LV wall; SA node (~40%); in left-dominant systems, gives PDA
Coronary blood flow facts:
- ~250 mL/min at rest (~5% of cardiac output)
- Occurs mainly in diastole (LV compresses coronary arteries during systole)
- Autoregulated (metabolic: ↑ adenosine, NO when O₂ demand ↑)
- Subendocardium is most vulnerable to ischemia (lowest perfusion pressure, most wall stress)
Layers of the Heart Wall
- Epicardium: outer visceral pericardium; contains coronary arteries and fat
- Myocardium: cardiac muscle; the working layer
- Endocardium: inner lining; smooth endothelial surface; includes Purkinje fibers
2. Cardiac Electrophysiology
The Conduction System
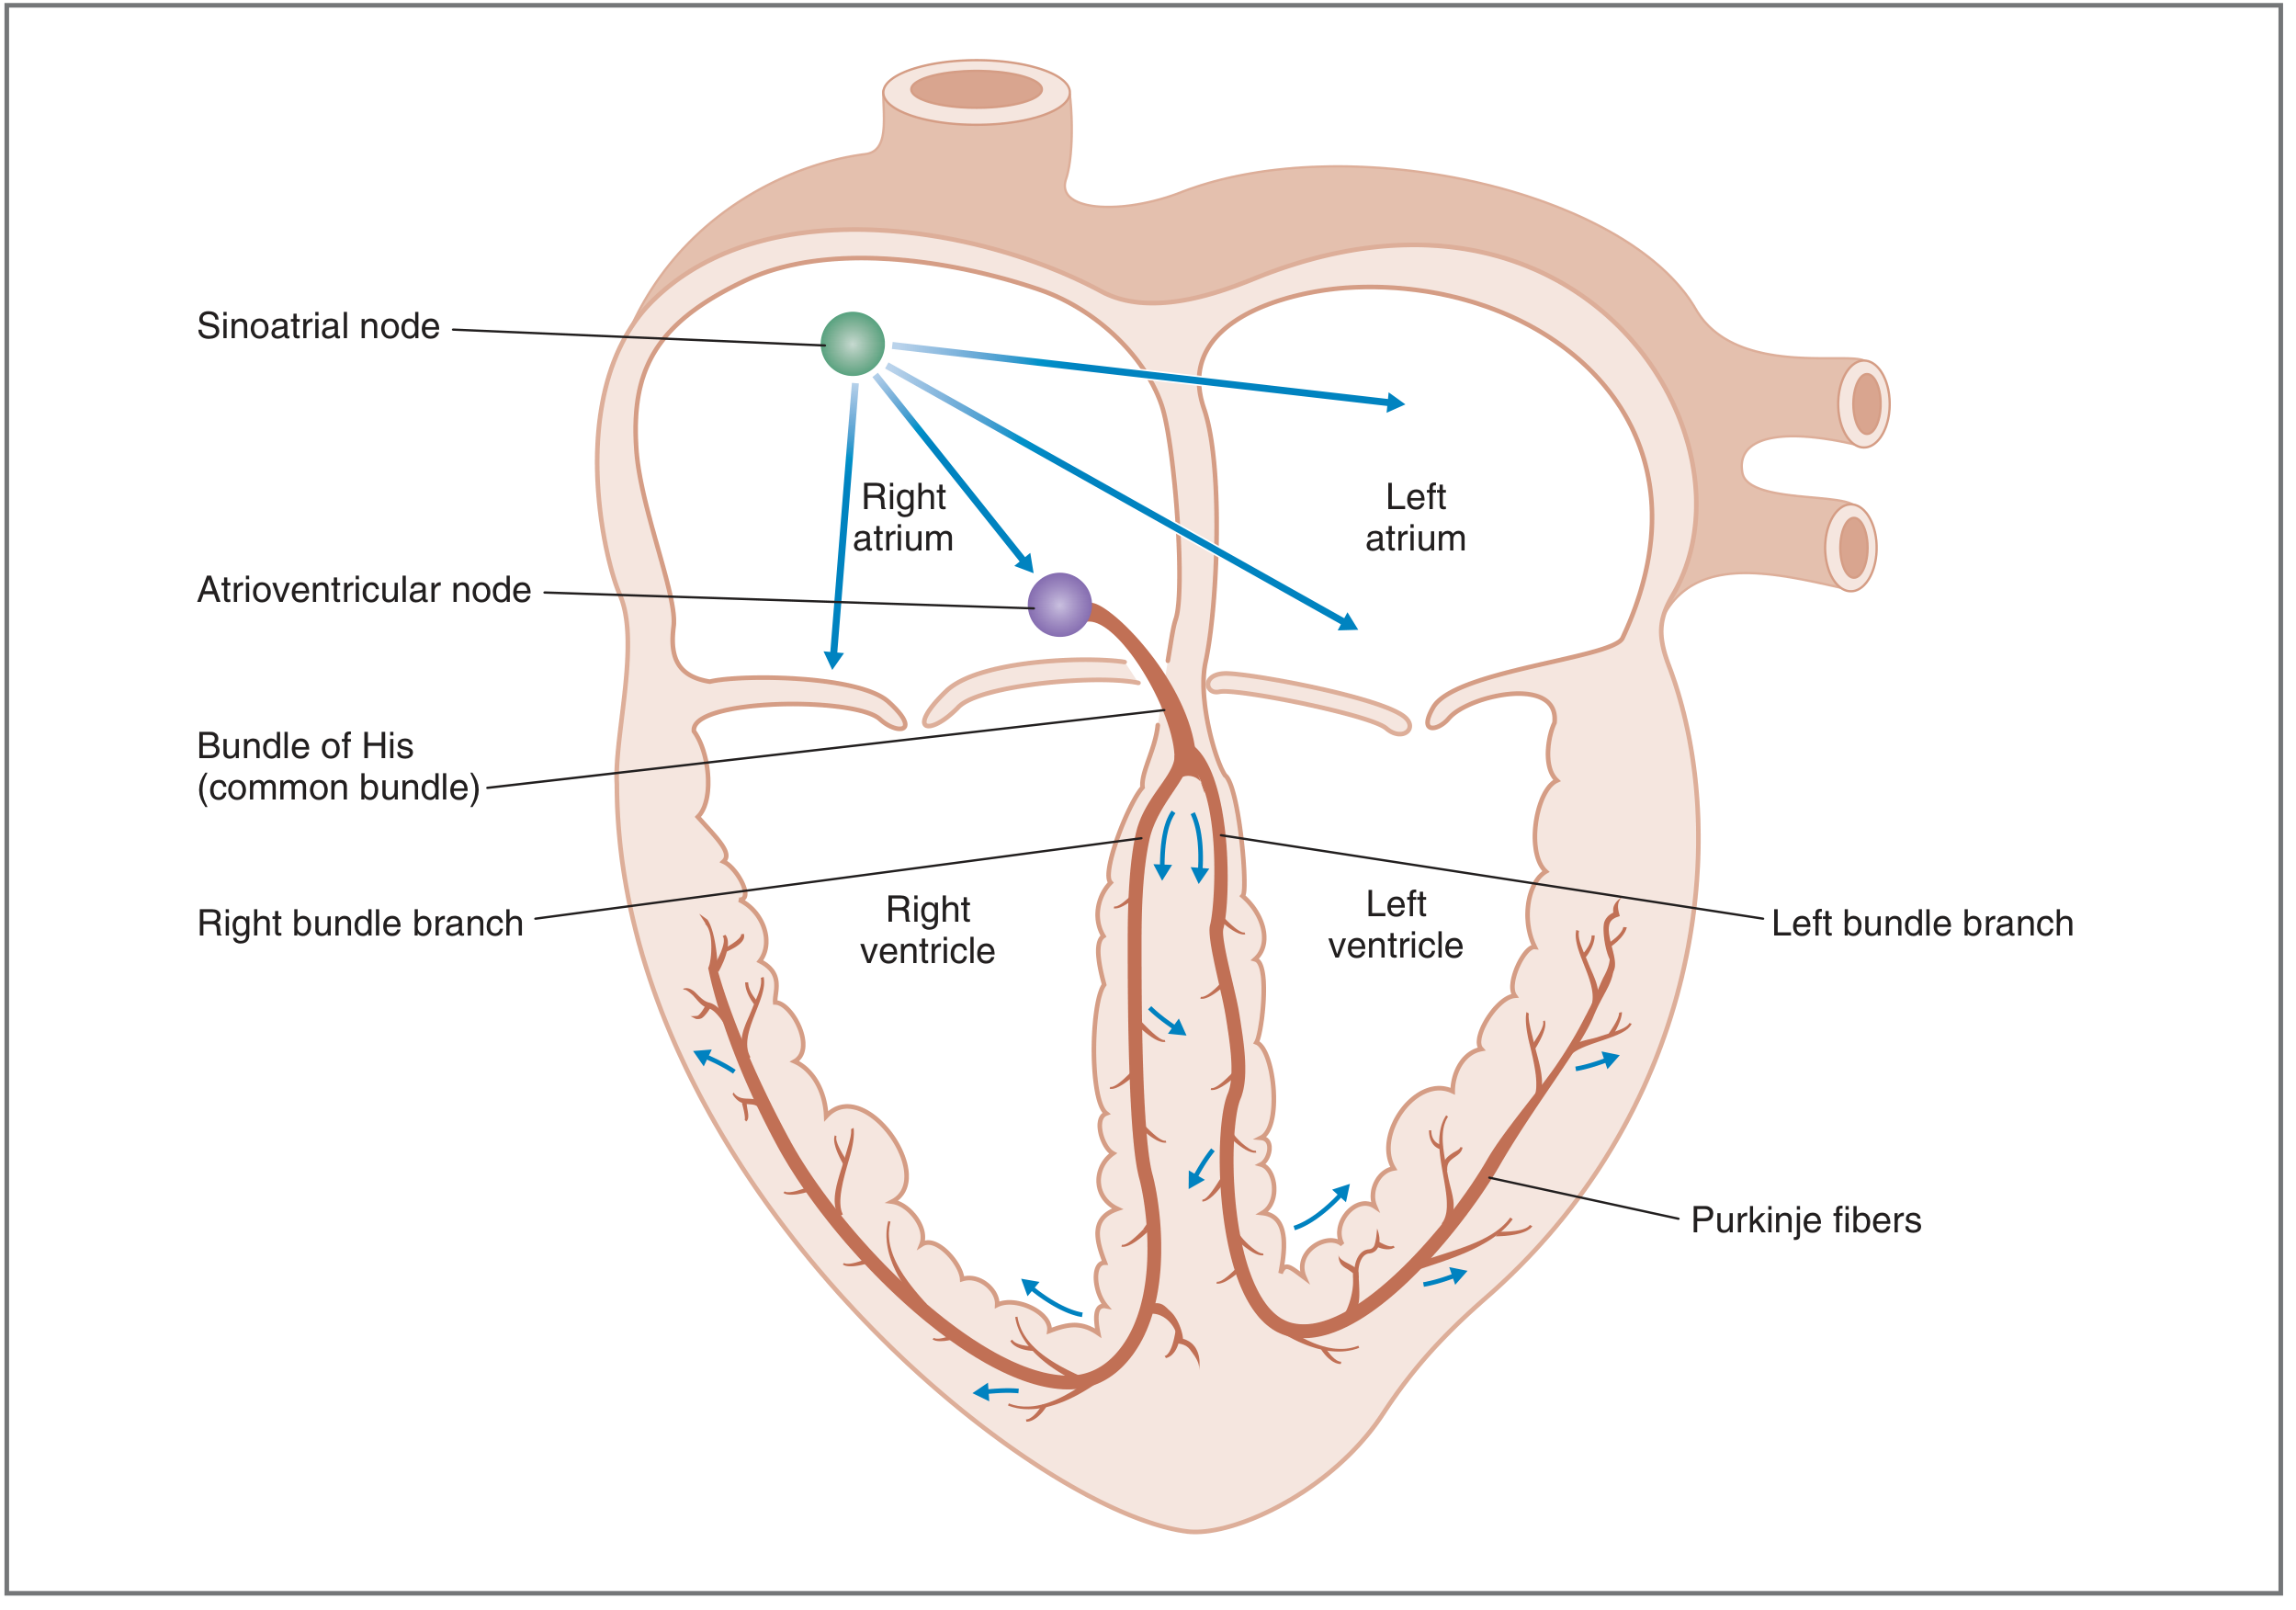
Figure: Sequence of electrical activation. Action potential initiated at SA node → spreads through atria via internodal tracts → AV node (delay) → Bundle of His → Left and Right bundle branches → Purkinje fibers → ventricular myocardium (apex to base). (Costanzo)
Normal Sinus Rhythm (NSR) criteria:
- Action potential originates in SA node
- Rate 60-100 beats/min
- Activation sequence and timing are correct
Intrinsic pacemaker rates (hierarchy):
- SA node: 60-100/min (dominant pacemaker)
- AV node / His: 40-60/min
- Bundle branches / Purkinje: 20-40/min
- Ventricular myocardium: <20/min
Lower pacemakers are normally suppressed by the faster SA node (overdrive suppression). If SA node fails → AV node escapes (junctional rhythm); if AV block → ventricular escape rhythm.
Conduction velocities:
- Atrial myocardium: 1 m/s
- AV node: 0.05 m/s (slowest - creates the PR interval delay for ventricular filling)
- His-Purkinje system: 4 m/s (fastest - ensures near-simultaneous ventricular activation)
- Ventricular myocardium: 1 m/s
Ventricular Action Potential - Phases
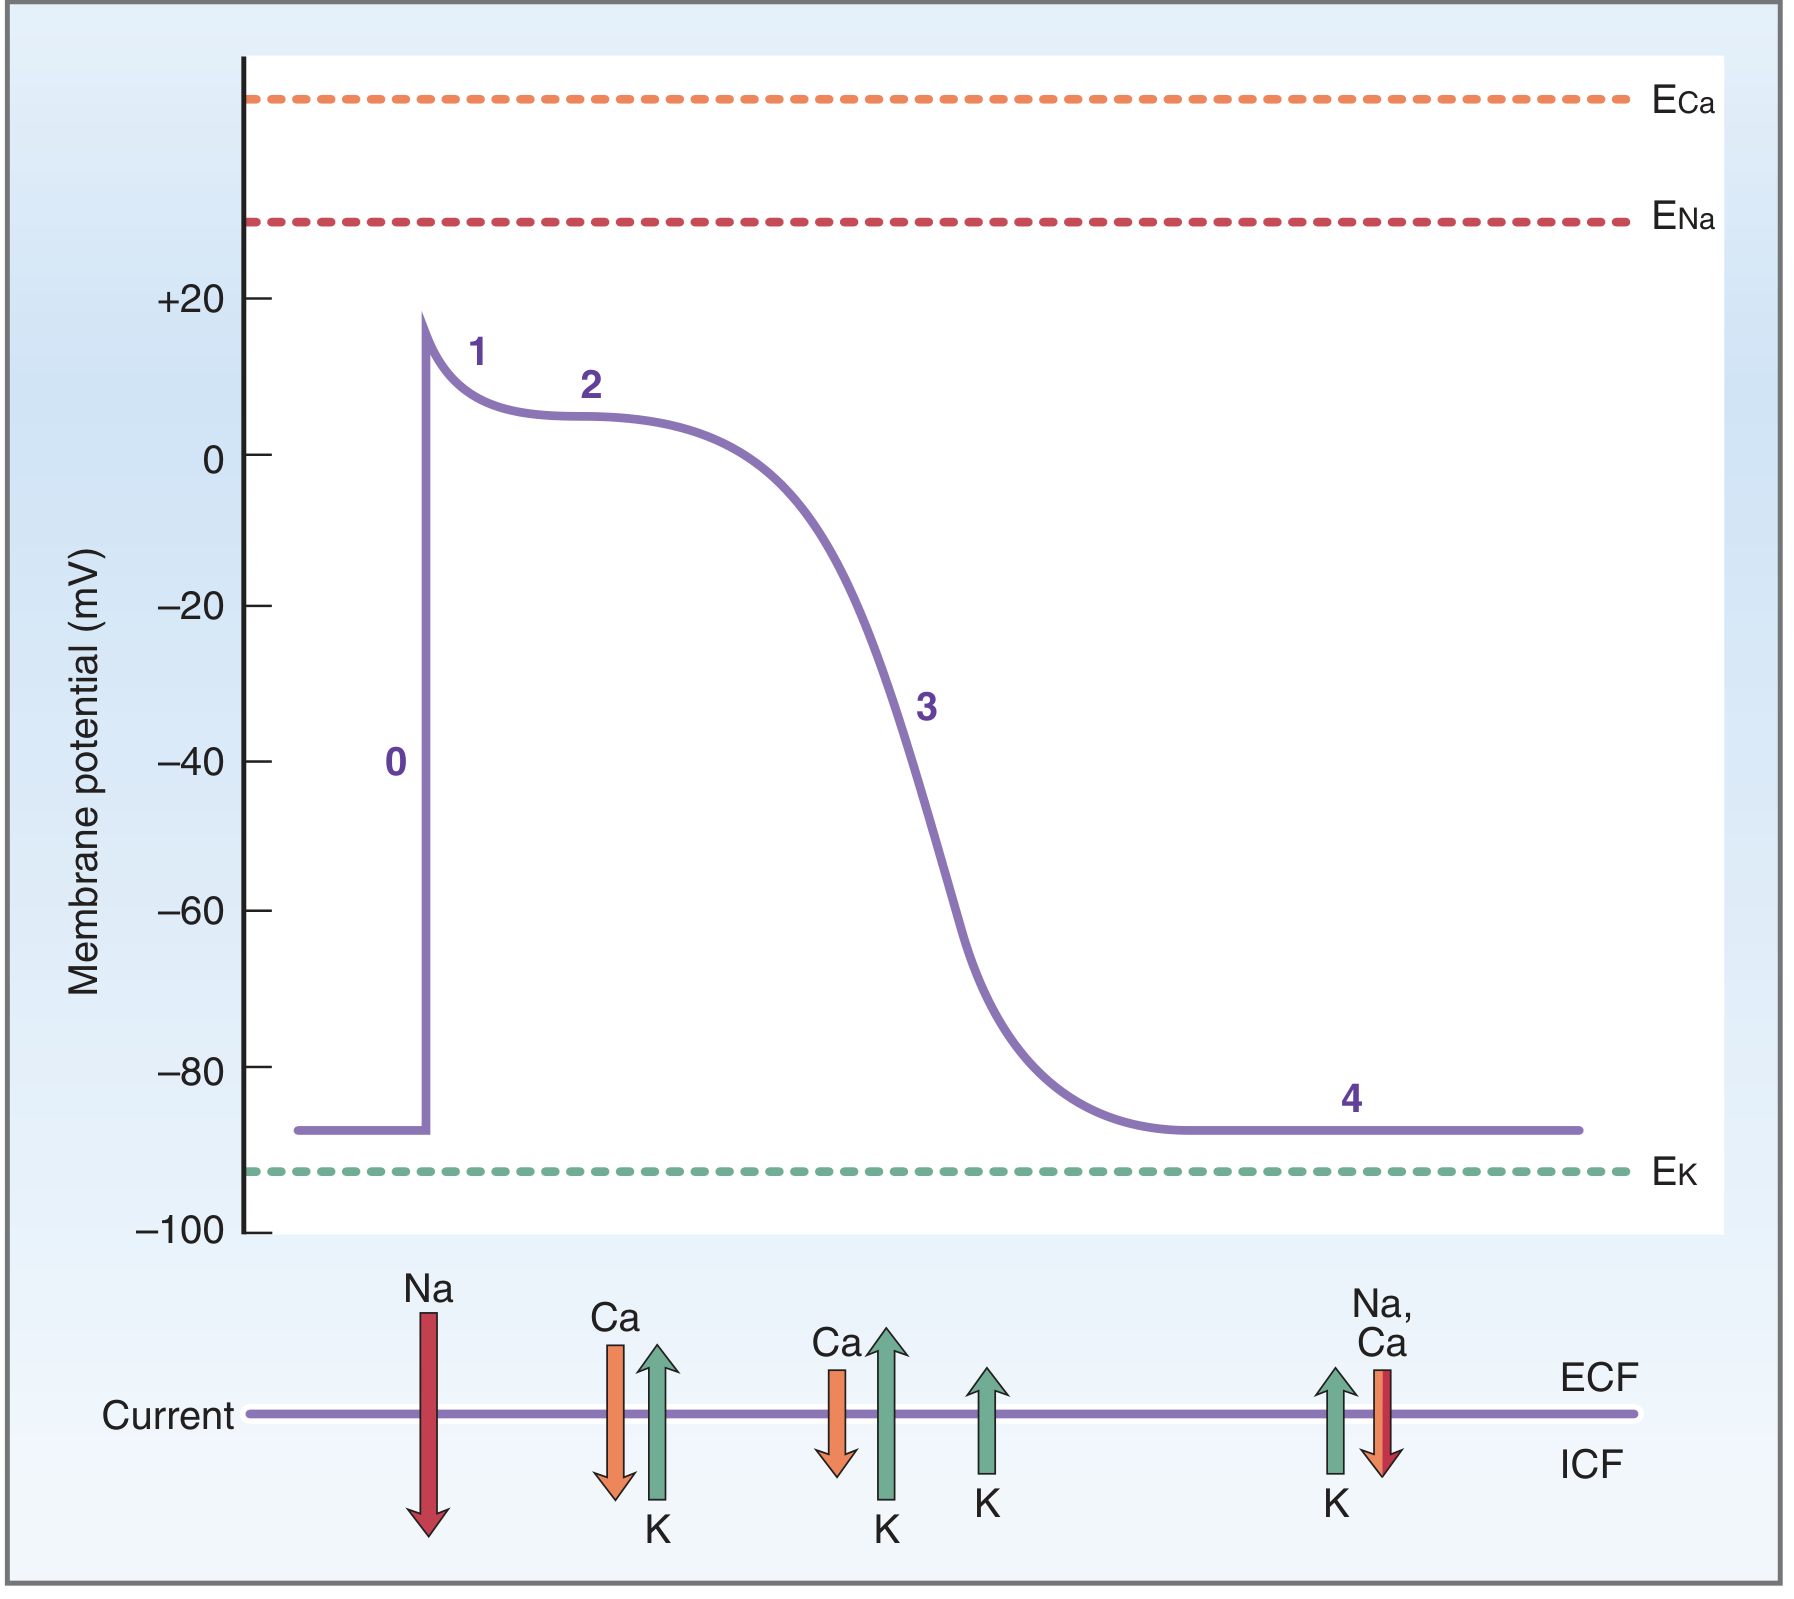
Figure: Ventricular action potential (phases 0-4) and the ionic currents underlying each phase. E = equilibrium potential for each ion. Resting membrane potential ≈ -85 mV. (Costanzo)
| Phase | Name | Ion Movement | Clinical Relevance |
|---|---|---|---|
| Phase 0 | Rapid upstroke | ↑ gNa → rapid Na⁺ influx (INa) | Class I antiarrhythmics block Na⁺ channels → slow phase 0 |
| Phase 1 | Early rapid repolarization | Na⁺ channels close; transient K⁺ efflux (Ito) | Notch appearance |
| Phase 2 | Plateau | Slow Ca²⁺ influx (ICa-L) balanced by K⁺ efflux (IK) | Calcium enters → triggers SR Ca²⁺ release → contraction; Class IV (CCBs) block ICa-L; QT interval determined here |
| Phase 3 | Rapid repolarization | ↓ gCa; ↑ gK (IKr, IKs) → K⁺ efflux | Class III antiarrhythmics block IKr → prolong QT |
| Phase 4 | Resting potential | Stable at ≈ -85 mV; maintained by IK1 (K⁺ outward) | Class II (β-blockers) affect nodal phase 4 |
SA Node Action Potential (Pacemaker Potential)
Different from ventricular AP:
- No stable phase 4 - instead has a spontaneous "funny current" (If, inward Na⁺/K⁺ current) that causes slow diastolic depolarization until threshold is reached → spontaneous firing = automaticity
- Phase 0 upstroke driven by slow Ca²⁺ channels (ICa-L), not fast Na⁺ channels
- No true plateau
- Resting membrane potential: ≈ -55 to -60 mV (less negative than ventricle)
- Ivabradine (heart rate drug) specifically blocks If channels in SA node
Autonomic Effects on the Heart
| Parameter | Sympathetic (β₁, ↑ cAMP) | Parasympathetic (M₂, ↓ cAMP) |
|---|---|---|
| Heart rate (chronotropy) | ↑ (steepens SA node phase 4 slope) | ↓ (hyperpolarizes SA node via IK-ACh) |
| Conduction velocity (dromotropy) | ↑ (through AV node especially) | ↓ (can cause AV block) |
| Contractility (inotropy) | ↑ ↑ (phosphorylates L-type Ca²⁺ channels, troponin I, phospholamban) | ↓ (atria only - minimal on ventricles) |
| Automaticity | ↑ (increases ectopic pacemaker rate) | ↓ |
Sympathetic: ↑ cAMP → PKA → phosphorylates:
- L-type Ca²⁺ channel → ↑ Ca²⁺ entry
- Phospholamban (removes inhibition of SERCA2) → faster SR Ca²⁺ uptake → faster relaxation (lusitropy)
- Troponin I → reduces Ca²⁺ sensitivity of myofibrils → faster cross-bridge cycling
Excitation-Contraction Coupling (E-C Coupling)
- Action potential → depolarization of T-tubule membrane
- L-type Ca²⁺ channels (DHP receptors) open → small Ca²⁺ influx ("trigger Ca²⁺")
- Trigger Ca²⁺ activates ryanodine receptors (RyR2) on sarcoplasmic reticulum → Ca²⁺-induced Ca²⁺ release (CICR) → large Ca²⁺ release into cytosol
- [Ca²⁺]i rises from 0.1 µM → ~1 µM → binds troponin C → conformational change → tropomyosin moves off actin binding sites
- Myosin heads bind actin → cross-bridge cycling → contraction
- Relaxation: Ca²⁺ removed by SERCA2 (back to SR), NCX (Na⁺/Ca²⁺ exchanger, extrudes Ca²⁺), and plasma membrane Ca²⁺-ATPase
Refractory periods:
- Absolute refractory period (ARP): No stimulus can trigger another AP (Na⁺ channels inactivated). Corresponds roughly to systole - prevents tetanus (essential for cardiac function)
- Relative refractory period (RRP): Above-threshold stimulus can trigger AP (partial Na⁺ channel recovery). Corresponds to early diastole - vulnerable to "R-on-T" phenomenon → VF
3. The Cardiac Cycle
Full Cycle - 7 Phases (at HR 75 bpm → cycle duration ~0.8 sec)
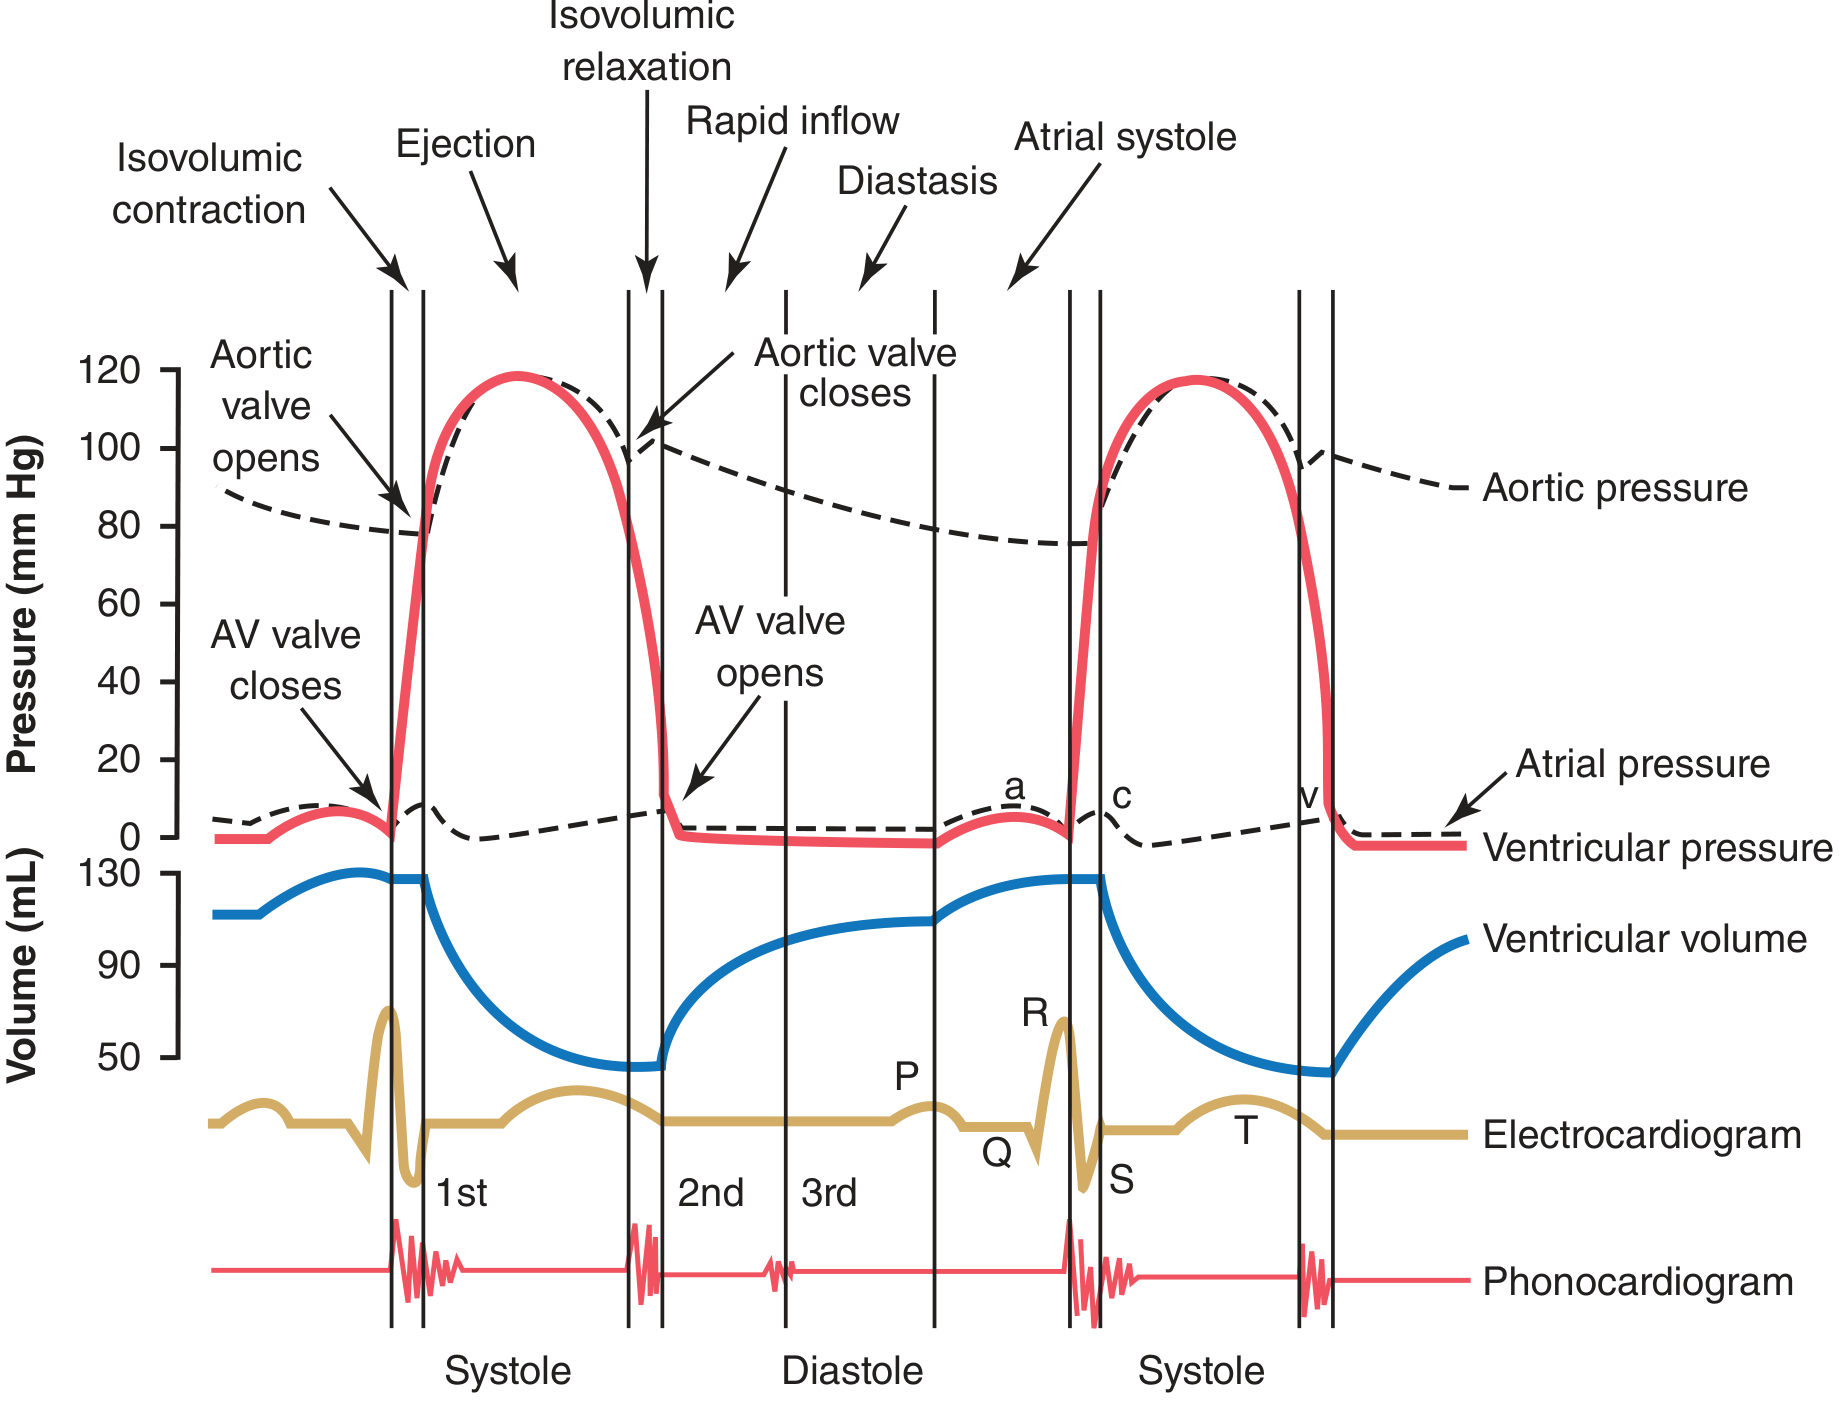
Figure: Events of the cardiac cycle. ECG, pressures (LV, aortic, atrial), ventricular volume, and phonocardiogram (heart sounds S1 and S2) shown simultaneously. Note: AV valve closes → S1; aortic valve closes → S2. (Guyton & Hall)
| Phase | Events | Valve Status | Heart Sound | ECG |
|---|---|---|---|---|
| A: Atrial systole | P wave → atria contract → final 20-30% LV filling | Mitral open, Aortic closed | S4 (abnormal, if present) | P wave |
| B: Isovolumetric ventricular contraction (IVC) | LV contracts, pressure rises rapidly; all valves closed; volume constant | Both closed (M closes, Ao still closed) | S1 (M/T valve closure) | QRS |
| C: Rapid ventricular ejection | LV pressure exceeds aortic diastolic → aortic valve opens; ~70% of SV ejected | Mitral closed, Aortic opens | - | ST segment |
| D: Reduced ventricular ejection | Slower ejection; LV starts to relax; volume at minimum (ESV) | Mitral closed, Aortic open | - | T wave |
| E: Isovolumetric ventricular relaxation (IVR) | LV relaxes; pressure falls; all valves closed; volume constant | Both closed (Ao closes, Mitral still closed) | S2 (Ao/P valve closure) | - |
| F: Rapid ventricular filling | LV pressure drops below LA → mitral opens; 70-80% passive filling | Mitral opens, Aortic closed | S3 (normal in children; abnormal in adults → volume overload/HF) | - |
| G: Diastasis (reduced filling) | Slow filling continues passively | Mitral open, Aortic closed | - | - |
Pressures (normal):
- LV systolic pressure: ~120 mmHg
- LV end-diastolic pressure (LVEDP): 5-12 mmHg (↑ in LV failure, mitral stenosis)
- Aortic systolic: ~120 mmHg; diastolic: ~80 mmHg
- Pulse pressure = systolic - diastolic = 40 mmHg (↑ in aortic regurgitation, ↓ in tamponade/severe AS)
Atrial Pressure Waves (a, c, v)
- a wave: atrial contraction (follows P wave)
- c wave: AV valve closure bulging back into atrium (small)
- v wave: venous filling of atrium while AV valve is closed (follows T wave)
- Cannon a waves: giant a waves when RA contracts against closed tricuspid valve → seen in complete AV block, VT
- Absent a wave: atrial fibrillation (no organized atrial contraction)
4. Key Hemodynamic Parameters
Volumes
- End-Diastolic Volume (EDV): ~120-130 mL (volume of blood in LV at end of diastole = preload)
- End-Systolic Volume (ESV): ~50-60 mL (blood remaining after ejection)
- Stroke Volume (SV) = EDV - ESV = 70 mL (range 60-100 mL)
- Ejection Fraction (EF) = SV/EDV = 70/130 = ~55-65% (normal ≥55%)
- EF <40% = reduced EF (HFrEF)
- EF 41-49% = mildly reduced (HFmrEF)
- EF ≥50% = preserved (HFpEF if symptoms present)
- Cardiac Output (CO) = SV × HR = 70 mL × 75 bpm = ~5 L/min
- Cardiac Index (CI) = CO/BSA = ~3 L/min/m² (normal >2.2 L/min/m²)
Determinants of Cardiac Output
1. Preload (= EDV; approximated by LVEDP or PCWP)
- ↑ Preload → ↑ sarcomere stretch → ↑ SV (Frank-Starling)
- Increased by: ↑ venous return, bradycardia, exercise (venous pump), regurgitant lesions
2. Afterload (= resistance the ventricle must overcome = aortic pressure/SVR)
- ↑ Afterload → ↓ SV (failing heart more sensitive)
- Increased by: hypertension, aortic stenosis, vasoconstriction
- Decreased by: vasodilators (ACE inhibitors) → ↑ SV in heart failure
3. Contractility (Inotropy) (= intrinsic force generation at given preload/afterload)
- ↑ by: catecholamines, digoxin, ↑ heart rate (Bowditch/staircase), digitalis
- ↓ by: heart failure, acidosis, hypoxia, β-blockers (acutely), Ca²⁺ channel blockers
4. Heart Rate
- ↑ HR → ↑ CO (to a point; >150-180 bpm → ↓ filling time → ↓ SV may offset)
- HR determined by SA node, modulated by ANS and baroreceptors
Frank-Starling Mechanism
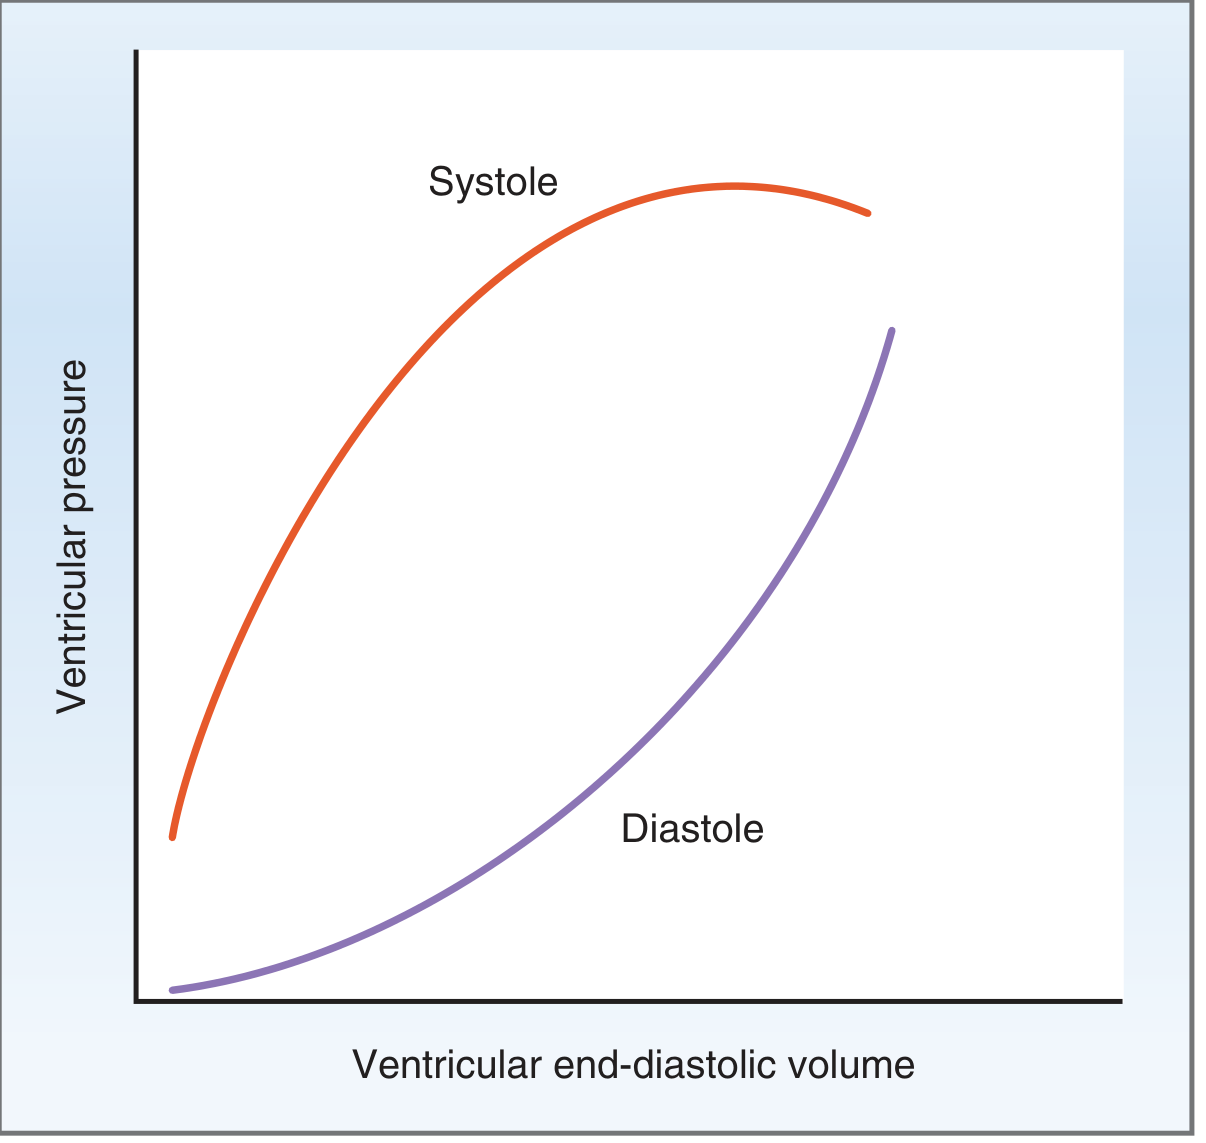
Figure: Systolic and diastolic pressure-volume curves. On systolic curve: as EDV increases (preload ↑), ventricular systolic pressure increases - this is the Frank-Starling relationship. Cardiac muscle operates only on the ascending limb (unlike skeletal muscle). (Costanzo)
- More filling → greater stretch → more Ca²⁺ sensitivity of troponin C + more Ca²⁺ release from SR → stronger contraction → ↑ SV
- Heart automatically matches output to venous return without neural input
- Clinical: fluid bolus in sepsis → ↑ preload → ↑ CO (if on ascending limb); in HF, curve shifts downward (less SV at same preload)
Cardiac and Vascular Function Curves
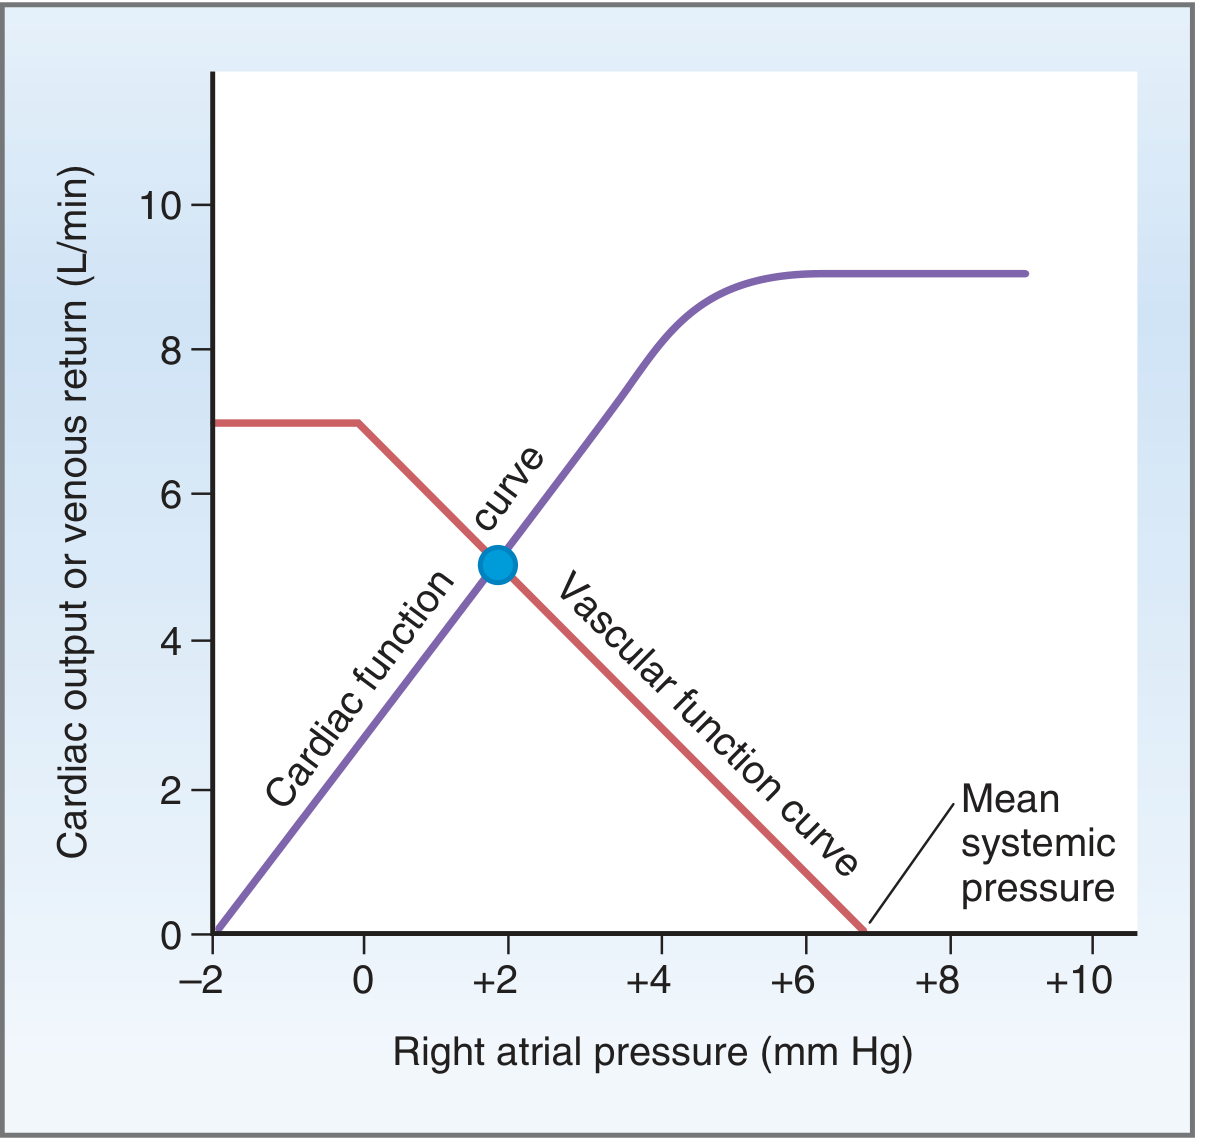
Figure: Steady-state intersection of the cardiac function curve (CO vs right atrial pressure) and vascular function curve (venous return vs right atrial pressure). Normal operating point: CO ≈ 5 L/min, RAP ≈ +2 mmHg. (Costanzo)
Mean systemic filling pressure (~7 mmHg): pressure in systemic circulation if heart stopped (x-intercept of vascular function curve) - set by blood volume. ↑ volume → rightward shift → ↑ CO.
5. ECG Basics
Intervals and Waves
| ECG Component | Represents | Normal Duration |
|---|---|---|
| P wave | Atrial depolarization | <0.12 sec; amplitude <2.5 mm |
| PR interval | AV nodal conduction delay | 0.12-0.20 sec |
| QRS complex | Ventricular depolarization | <0.12 sec (<3 small squares) |
| ST segment | Ventricular plateau (phase 2) | Isoelectric |
| T wave | Ventricular repolarization (phase 3) | Asymmetric, upright in most leads |
| QT interval | Total ventricular action potential (depolarization + repolarization) | 0.35-0.45 sec (rate-corrected QTc) |
ECG axis (normal -30° to +90°):
- Left axis deviation (LAD): left anterior fascicular block, inferior MI
- Right axis deviation (RAD): RVH, left posterior fascicular block, lateral MI
Key ECG Patterns
| Finding | Cause |
|---|---|
| ST elevation | STEMI, pericarditis (diffuse, saddle-shaped), Prinzmetal angina, LBBB (appropriate discordance) |
| ST depression | NSTEMI/UA, subendocardial ischemia, LVH with strain, digoxin effect |
| Prolonged PR | AV block (1st, 2nd, 3rd degree) |
| Prolonged QT | Hypokalemia, hypomagnesemia, drugs (quinidine, sotalol, erythromycin, haldol), congenital LQTS |
| Wide QRS | Bundle branch block, ventricular rhythm, WPW, hyperkalemia |
| Delta wave + short PR | Wolff-Parkinson-White (WPW) - accessory pathway preexcitation |
| Low voltage | Pericardial effusion, hypothyroidism, COPD |
| Electrical alternans | Cardiac tamponade |
6. Antiarrhythmic Drugs - Vaughan Williams Classification
| Class | Mechanism | Examples | Clinical Use | Key Side Effects |
|---|---|---|---|---|
| IA | Na⁺ channel block (intermediate kinetics) + K⁺ block → ↑ AP duration | Quinidine, procainamide, disopyramide | AF, VT | Prolongs QT, torsades; lupus (procainamide) |
| IB | Na⁺ channel block (fast kinetics) → ↓ AP duration | Lidocaine, mexiletine | Acute VT/VF (esp. post-MI), digitalis toxicity | CNS toxicity (lidocaine); hepatic metabolism |
| IC | Na⁺ channel block (slow kinetics) → ↓↓ conduction velocity | Flecainide, propafenone | AF/flutter with normal heart; AVRT | Proarrhythmic in structural heart disease (CAST trial) |
| II | β-blockade → ↓ automaticity, ↓ AV conduction | Metoprolol, esmolol, carvedilol | Rate control in AF, SVT, post-MI, HFrEF | Bronchospasm, bradycardia, ↓ LV function |
| III | K⁺ channel block → ↑ AP duration, ↑ refractory period | Amiodarone, sotalol, ibutilide, dofetilide | AF/flutter cardioversion; VT/VF prevention | Amiodarone: pulm toxicity, thyroid, hepatic, photosensitivity; Sotalol/dofetilide: torsades |
| IV | L-type Ca²⁺ channel block → ↓ AV node conduction | Verapamil, diltiazem | Rate control AF, AVNRT | Negative inotrope; contraindicated in VT, accessory pathway (WPW), severe LV dysfunction |
Adenosine: Activates IK-ACh in AV node → transient AV block → terminates AV-nodal-dependent SVT (AVNRT, AVRT); short half-life (~10 sec); also diagnostic (if AF/flutter, rhythm persists)
Digoxin: Inhibits Na⁺-K⁺-ATPase → ↑ intracellular Na⁺ → ↓ NCX activity → ↑ [Ca²⁺]i → ↑ contractility; also ↑ vagal tone → ↓ HR/↓ AV conduction; narrow therapeutic index; toxicity (nausea, yellow-green vision, arrhythmias); worsened by hypokalemia
7. Heart Failure (HF)
Definition and Pathophysiology
Heart failure is a clinical syndrome in which the heart cannot pump sufficient blood to meet the metabolic needs of the body, or can only do so at elevated filling pressures.
Two broad categories:
- HFrEF (EF <40%): reduced contractility; dilated cardiomyopathy pattern; systolic dysfunction
- HFpEF (EF ≥50%): impaired relaxation/filling; concentric hypertrophy; diastolic dysfunction; EF normal but SV reduced due to ↓ EDV
Compensatory Mechanisms (initially helpful, ultimately harmful)
- Frank-Starling: ↑ EDV → ↑ SV (works until excessive dilation → ↓ efficiency)
- Neurohormonal activation: RAAS ↑ → Na⁺/water retention; SNS ↑ → ↑ HR, vasoconstriction; ADH ↑ → water retention → all raise preload + afterload (vicious cycle)
- Cardiac hypertrophy: initially reduces wall stress (LaPlace), but → fibrosis, ↓ compliance, arrhythmias
- Natriuretic peptides (ANP/BNP): secreted from atria/ventricles in response to stretch → natriuresis, vasodilation, ↓ renin (counterregulatory; useful as biomarkers)
Clinical Presentation
- Left HF (elevated pulmonary venous pressure): dyspnea on exertion, orthopnea, PND (paroxysmal nocturnal dyspnea), pulmonary crackles, S3 gallop, ↑ PCWP
- Right HF (elevated systemic venous pressure): JVD, peripheral edema, hepatomegaly, ascites, ↑ RAP
- Biventricular HF: features of both; most common (LHF → ↑ pulmonary pressure → RHF)
Framingham criteria for diagnosis:
- Major: PND, JVD, crackles, cardiomegaly, S3, ↑ CVP, pulmonary edema
- Minor: bilateral ankle edema, nocturnal cough, dyspnea on exertion, hepatomegaly, tachycardia
NYHA Functional Classification
| Class | Symptoms |
|---|---|
| I | No symptoms with ordinary activity |
| II | Slight limitation; comfortable at rest, symptomatic with moderate exertion |
| III | Marked limitation; comfortable at rest, symptomatic with minimal exertion |
| IV | Symptoms at rest; unable to carry out any physical activity |
ACC/AHA Stages of HF
| Stage | Description |
|---|---|
| A | At risk (HTN, DM, CAD) - no structural disease, no symptoms |
| B | Structural disease (LVH, ↓ EF, valve disease) - asymptomatic |
| C | Structural disease + current or prior symptoms |
| D | Refractory HF despite maximal therapy; advanced/end-stage |
Treatment of HFrEF (The "Fantastic Four")
Evidence-based therapy that reduces mortality:
- ACE inhibitor/ARB (or ARNI - sacubitril/valsartan, preferred over ACEi): ↓ afterload, ↓ remodeling, ↓ neurohormonal activation; 20-40% mortality reduction
- β-blocker (carvedilol, metoprolol succinate, bisoprolol): ↓ HR, ↑ filling time, ↓ remodeling, antiarrhythmic; ~34% mortality reduction
- MRA (mineralocorticoid receptor antagonist): spironolactone, eplerenone; ↓ aldosterone effect → ↓ fibrosis, ↓ remodeling
- SGLT2 inhibitors (dapagliflozin, empagliflozin): ↓ HF hospitalizations and mortality regardless of EF; also in HFpEF (dapagliflozin)
Additional:
- Diuretics (loop diuretics - furosemide): symptom relief, ↓ congestion; do NOT reduce mortality
- ICD: EF ≤35%, NYHA II-III, >40 days post-MI - prevents sudden cardiac death
- CRT (cardiac resynchronization therapy): EF ≤35% + LBBB (QRS ≥150 ms) - improves CO by synchronizing LV contraction
- Ivabradine: HR >70, sinus rhythm on max β-blocker - reduces HF hospitalizations
Clinical Case in Point (Costanzo)
A 60-year-old woman with history of angina presents with extreme fatigue, dyspnea, orthopnea, bilateral edema, JVD, cyanosis, and EF = 0.30. This classic presentation:
- ↓ Contractility → downward shift of Frank-Starling curve → ↓ SV at same preload
- Baroreceptor activation → ↑ SNS (tachycardia, vasoconstriction, cold clammy skin)
- RAAS activation → Na⁺/water retention → worsening edema
- Treatment: digoxin (↑ contractility), diuretic + low Na diet (↓ volume overload)
8. Arrhythmias
Mechanisms of Arrhythmias
- Abnormal automaticity: ectopic pacemaker fires faster than SA node; seen in hypokalemia, ischemia, catecholamine excess
- Triggered activity: after-depolarizations
- Early after-depolarizations (EADs): during phase 2-3 (prolonged QT) → Torsades de pointes
- Delayed after-depolarizations (DADs): after phase 4 (digoxin toxicity, catecholamine excess)
- Re-entry: most common mechanism; requires two pathways with unidirectional block and different conduction velocities → circular excitation loop; substrate for AF, VT, SVT
Classification of Major Arrhythmias
Supraventricular Arrhythmias:
Atrial Fibrillation (AF):
- Most common sustained arrhythmia; prevalence increases with age (10% in >80 yr)
- Multiple disorganized re-entrant wavelets in atria; usually triggered from pulmonary veins
- ECG: irregularly irregular rhythm, absent P waves, fibrillatory baseline, narrow QRS (unless aberrant conduction)
- Risks: stroke (LA thrombus from blood stasis, especially in LAA), HF (tachycardia-induced cardiomyopathy)
- CHA₂DS₂-VASc score for stroke risk → anticoagulation with DOACs (apixaban, rivaroxaban, dabigatran) if score ≥2 (male) or ≥3 (female)
- Management: rate control (β-blockers, diltiazem/verapamil, digoxin) vs. rhythm control (cardioversion, antiarrhythmics, catheter ablation - PVI)
Atrial Flutter:
- Organized macro-re-entry circuit in right atrium (typical - counterclockwise around tricuspid annulus)
- ECG: sawtooth P waves at ~300/min; usually 2:1 block → ventricular rate ~150/min
- Same stroke risk as AF → anticoagulation strategy similar
- Often easier to convert; catheter ablation highly effective (>90% cure rate for typical flutter)
SVT (AVNRT - AV Nodal Re-entrant Tachycardia):
- Most common SVT; re-entry within AV node using slow and fast pathways
- Rate 150-250/min; narrow QRS; P waves buried in or just after QRS
- Vagal maneuvers or adenosine terminate acutely
- Long-term: β-blockers, CCBs, or catheter ablation
WPW (Wolff-Parkinson-White):
- Accessory pathway (bundle of Kent) bypasses AV node → ventricular preexcitation
- ECG: short PR (<0.12 s) + delta wave + wide QRS
- Can conduct AF very rapidly through accessory pathway → hemodynamic collapse/VF
- Contraindication: AV nodal blockers (adenosine, digoxin, CCBs) in AF with WPW → accelerate AP conduction → VF
- Treatment: procainamide acutely; catheter ablation for definitive cure
Ventricular Arrhythmias:
VT (Ventricular Tachycardia):
- ≥3 consecutive ventricular beats at ≥100/min; wide QRS (>0.12 s)
- Sustained VT (>30 sec or hemodynamically unstable): immediate cardioversion
- Monomorphic VT: usually scar-based re-entry (post-MI, cardiomyopathy)
- Polymorphic VT: ischemia, electrolyte abnormalities
VF (Ventricular Fibrillation):
- Chaotic, uncoordinated ventricular activity; no effective cardiac output → cardiac arrest
- Treatment: immediate defibrillation + CPR; amiodarone/lidocaine during resuscitation
Torsades de Pointes:
- Polymorphic VT with QRS that twists around the isoelectric line
- Occurs in setting of prolonged QT interval
- Causes: drugs (class IA, III, QT-prolonging antibiotics/antipsychotics), hypokalemia, hypomagnesemia, congenital LQTS
- Treatment: IV magnesium sulfate (first-line); overdrive pacing; correct electrolytes; remove offending drug
Heart Blocks:
| Degree | ECG | Conduct? | Treatment |
|---|---|---|---|
| 1st degree | PR >0.20 sec | All P waves conduct | None |
| 2nd degree - Mobitz I (Wenckebach) | Progressive PR lengthening → dropped QRS | AV nodal block | None if asymptomatic; usually benign |
| 2nd degree - Mobitz II | Fixed PR with sudden dropped QRS (no warning) | Infranodal (His-Purkinje) | Pacemaker (risk of complete block) |
| 3rd degree (complete AV block) | P waves and QRS completely dissociated | None | Pacemaker (emergency) |
9. Ischemic Heart Disease
Stable Angina
- Demand > supply ischemia (fixed atherosclerotic stenosis)
- Exertional chest pain, relieved by rest or nitrates in <10 min
- ECG: may show ST depression during pain; normal at rest
- Management:
- Short-acting nitrates (GTN) - symptom relief
- β-blockers (↓ HR and contractility → ↓ O₂ demand) - first-line
- Long-acting nitrates, Ca²⁺ channel blockers as add-on
- Statins, aspirin, lifestyle modification
- Revascularization: PCI or CABG for severe/refractory disease
Acute Coronary Syndrome (ACS)
Spectrum: Unstable angina → NSTEMI → STEMI
| Feature | Unstable Angina | NSTEMI | STEMI |
|---|---|---|---|
| Cause | Plaque rupture + partial occlusion | Partial or complete + microemboli | Complete occlusion |
| Troponin | Negative | Positive | Positive |
| ECG | ST depression / T inversion or normal | ST depression / T inversion | ST elevation |
| Pathology | No necrosis | Subendocardial necrosis | Transmural necrosis |
STEMI Management - Time is Muscle:
- Primary PCI (percutaneous coronary intervention) within 90 min of first medical contact (preferred)
- Thrombolysis if PCI not available within 120 min
- Aspirin + P2Y12 inhibitor (clopidogrel, ticagrelor, prasugrel) = dual antiplatelet therapy (DAPT)
- Anticoagulation: heparin (UFH or LMWH), fondaparinux, bivalirudin
- β-blockers (↓ infarct size, ↓ arrhythmias)
- ACE inhibitors (↓ remodeling)
- Statin (high-intensity)
Biomarkers in ACS:
| Biomarker | Rises | Peaks | Returns to Normal |
|---|---|---|---|
| High-sensitivity Troponin I/T | 1-3 hrs | 12-24 hrs | 7-14 days |
| CK-MB | 4-6 hrs | 18-24 hrs | 36-72 hrs |
| Myoglobin | 1-2 hrs (earliest) | 6-9 hrs | 24 hrs |
| LDH | 24-48 hrs | 3-6 days | 8-14 days |
Complications of MI:
- Arrhythmias: most common early cause of death; VF (first 24-48 hrs - reperfusion); heart block (inferior MI → RCA occlusion → AV node ischemia)
- Pump failure/Cardiogenic shock: massive LV infarct (>40% of LV mass); Killip Class IV; mortality >50%; treatment: IABP, revascularization
- Mechanical complications (day 3-7: "3-7 days"):
- Free wall rupture → hemopericardium → cardiac tamponade → death
- Papillary muscle rupture → acute severe mitral regurgitation → pulmonary edema (new systolic murmur + respiratory failure)
- VSD (interventricular septal rupture) → new systolic murmur + ↑ O₂ saturation in RV (step-up)
- LV aneurysm: persistent ST elevation, ventricular tachyarrhythmias, mural thrombus → stroke
- Pericarditis: Dressler's syndrome (autoimmune, days to weeks post-MI); fever, pleuritic chest pain, friction rub
10. Valvular Heart Disease
Overview
| Valve Lesion | Key Finding | Pathophysiology | Murmur | Treatment |
|---|---|---|---|---|
| Aortic Stenosis (AS) | Calcific (elderly), bicuspid AoV (young), rheumatic | LV pressure overload → concentric hypertrophy | Harsh crescendo-decrescendo systolic at 2nd RUSB, radiates to neck | AVR (TAVR or surgical) when symptomatic or EF ↓ |
| Aortic Regurgitation (AR) | Endocarditis, aortic root dilation (Marfan), rheumatic, bicuspid | LV volume overload → eccentric hypertrophy; wide pulse pressure | Early diastolic decrescendo at LLSB; Austin Flint murmur | AVR when symptomatic or LV dilates/EF↓ |
| Mitral Stenosis (MS) | Almost exclusively rheumatic | LA pressure overload → LA enlargement → AF + pulmonary HTN | Rumbling low-pitched mid-diastolic murmur at apex (opening snap precedes) | Diuretics; rate control; percutaneous mitral valvotomy; MVR |
| Mitral Regurgitation (MR) | MVP, papillary muscle dysfunction (MI), IE, rheumatic | LV and LA volume overload; eccentric LV hypertrophy | Pansystolic murmur at apex radiating to axilla | Surgery/MitraClip when symptomatic or LV dysfunction |
| Tricuspid Regurgitation (TR) | RV dilation (functional), IE (IV drug users) | RA + RV volume overload → right HF | Pansystolic at LLSB; ↑ with inspiration (Carvallo's sign) | Treat underlying cause; annuloplasty |
Classic AS Triad (SAD): Syncope, Angina, Dyspnea - median survival after each: 3, 5, 2 years respectively
Mitral Valve Prolapse (MVP):
- Most common valvular abnormality in developed countries (~2-3% of population)
- Myxomatous degeneration of mitral leaflets → prolapse into LA during systole
- Mid-systolic click followed by late systolic murmur
- Mostly benign; rarely causes significant MR or arrhythmias
11. Pericardial Diseases
Acute Pericarditis
- Sharp pleuritic chest pain; worse lying flat, better sitting forward
- Pericardial friction rub (pathognomonic) - scratchy, 3-component sound
- ECG: diffuse saddle-shaped ST elevation + PR depression (contrast with MI: regional ST elevation without PR depression)
- Causes: viral (most common - Coxsackie, Echo), post-MI (Dressler's), autoimmune (SLE, RA), uremic, TB
- Treatment: NSAIDs + colchicine (reduces recurrence)
Cardiac Tamponade
- Fluid accumulation in pericardial space → ↑ intrapericardial pressure → compression of cardiac chambers
- Beck's Triad: hypotension + JVD + muffled heart sounds
- Pulsus paradoxus: ↓ SBP >10 mmHg during inspiration (normal ≤10 mmHg) - due to exaggerated ventricular interdependence
- ECG: electrical alternans (QRS axis alternates beat-to-beat), low voltage, tachycardia
- Echo: right-sided chamber diastolic collapse, plethoric IVC
- Treatment: pericardiocentesis (emergency)
Constrictive Pericarditis
- Rigid, fibrotic pericardium → impairs cardiac filling in diastole
- Causes: post-TB (most common worldwide), radiation, post-viral, post-surgical
- JVD with Kussmaul sign (JVD increases on inspiration - opposite of normal)
- Pericardial knock (high-pitched S3-like sound)
- Equalization of diastolic pressures in all 4 chambers
- Treatment: pericardiectomy
12. Hypertension
Definition (ACC/AHA 2017): BP ≥130/80 mmHg
| Stage | SBP | DBP |
|---|---|---|
| Normal | <120 | <80 |
| Elevated | 120-129 | <80 |
| Stage 1 HTN | 130-139 | 80-89 |
| Stage 2 HTN | ≥140 | ≥90 |
| Hypertensive crisis | >180 | >120 |
Types:
- Primary (essential) HTN (95%): no identified cause; genetic + environmental (high Na, obesity, sedentary, alcohol)
- Secondary HTN (5%): renovascular (RAS), primary hyperaldosteronism, pheochromocytoma, obstructive sleep apnea, thyroid disease, coarctation of aorta
Target organ damage: LVH → HF; accelerated atherosclerosis → CAD, PAD; lacunar strokes; hypertensive retinopathy; hypertensive nephropathy (nephrosclerosis)
Antihypertensive Drug Choice:
| Situation | Preferred Agent(s) |
|---|---|
| Uncomplicated HTN | Thiazides (chlorthalidone), ACEi/ARB, CCB |
| HTN + HFrEF | ACEi/ARB, β-blocker, MRA, SGLT2i |
| HTN + CKD + proteinuria | ACEi or ARB |
| HTN + DM | ACEi or ARB (nephroprotective) |
| HTN + post-MI | β-blocker + ACEi/ARB |
| HTN + pregnancy | Methyldopa, labetalol, nifedipine (avoid ACEi/ARBs) |
| HTN + pheochromocytoma | α-blocker first (phenoxybenzamine), then β-blocker |
| Hypertensive emergency | IV labetalol, IV nitroprusside, IV clevidipine |
13. Key Normal Hemodynamic Values
| Parameter | Normal Value |
|---|---|
| Heart rate | 60-100 bpm |
| Stroke volume | 60-80 mL |
| Cardiac output | 4-8 L/min |
| Cardiac index | 2.2-4.0 L/min/m² |
| Ejection fraction | 55-70% |
| LV end-diastolic volume | 120-130 mL |
| LV end-systolic volume | 50-60 mL |
| Systolic blood pressure | 100-140 mmHg |
| Diastolic blood pressure | 60-90 mmHg |
| Mean arterial pressure (MAP) | 70-105 mmHg |
| LVEDP | 5-12 mmHg |
| PCWP (wedge pressure) | 6-12 mmHg |
| Pulmonary artery pressure | 25/10 mmHg (mean ~15 mmHg) |
| Systemic vascular resistance (SVR) | 800-1200 dynes·sec·cm⁻⁵ |
| Central venous pressure (CVP) | 0-8 cmH₂O |
| PR interval | 0.12-0.20 sec |
| QRS duration | <0.12 sec |
| QTc | <0.44 sec (males), <0.46 sec (females) |
Sources
- Guyton and Hall Textbook of Medical Physiology (14th ed.) - Chapters 9-13, 20-21
- Costanzo Physiology (7th ed.) - Chapter 4
- Goldman-Cecil Medicine (International Ed.) - Chapters 45-58
- Braunwald's Heart Disease (12th ed.)
- Harrison's Principles of Internal Medicine (22nd ed.) - Chapters 251-256
Now ECG
Reading File
Finding Sources
Finding Sources
Finding Sources
Finding Sources
Finding Sources
Finding Sources
Finding Sources
Reading File
Reading File
Reading File
Reading File
Reading File
Reading File
Reading File
Reading File
Loading Image
Loading Image
Reading File
Loading Image
Loading Image
Reading File
Reading File
Reading File
Reading File
Loading Image
Loading Image
Reading File
Loading Image
Reading File
Loading Image
Reading File
Loading Image
Reading File
ECG - From Basics to Clinicals
Sources: Harrison's Principles of Internal Medicine 22E, Braunwald's Heart Disease 12E, [Goldberger's Clinical Electrocardiography 10E]
1. The ECG Signal: What We're Actually Recording
The electrocardiogram records the sum of all cardiac electrical potentials at the body surface over time. Willem Einthoven (1901) developed the modern surface ECG, recognising that each cellular action potential contributes to a vector, and the algebraic sum of all simultaneous vectors produces the deflections we see.
Cellular basis of each ECG segment:
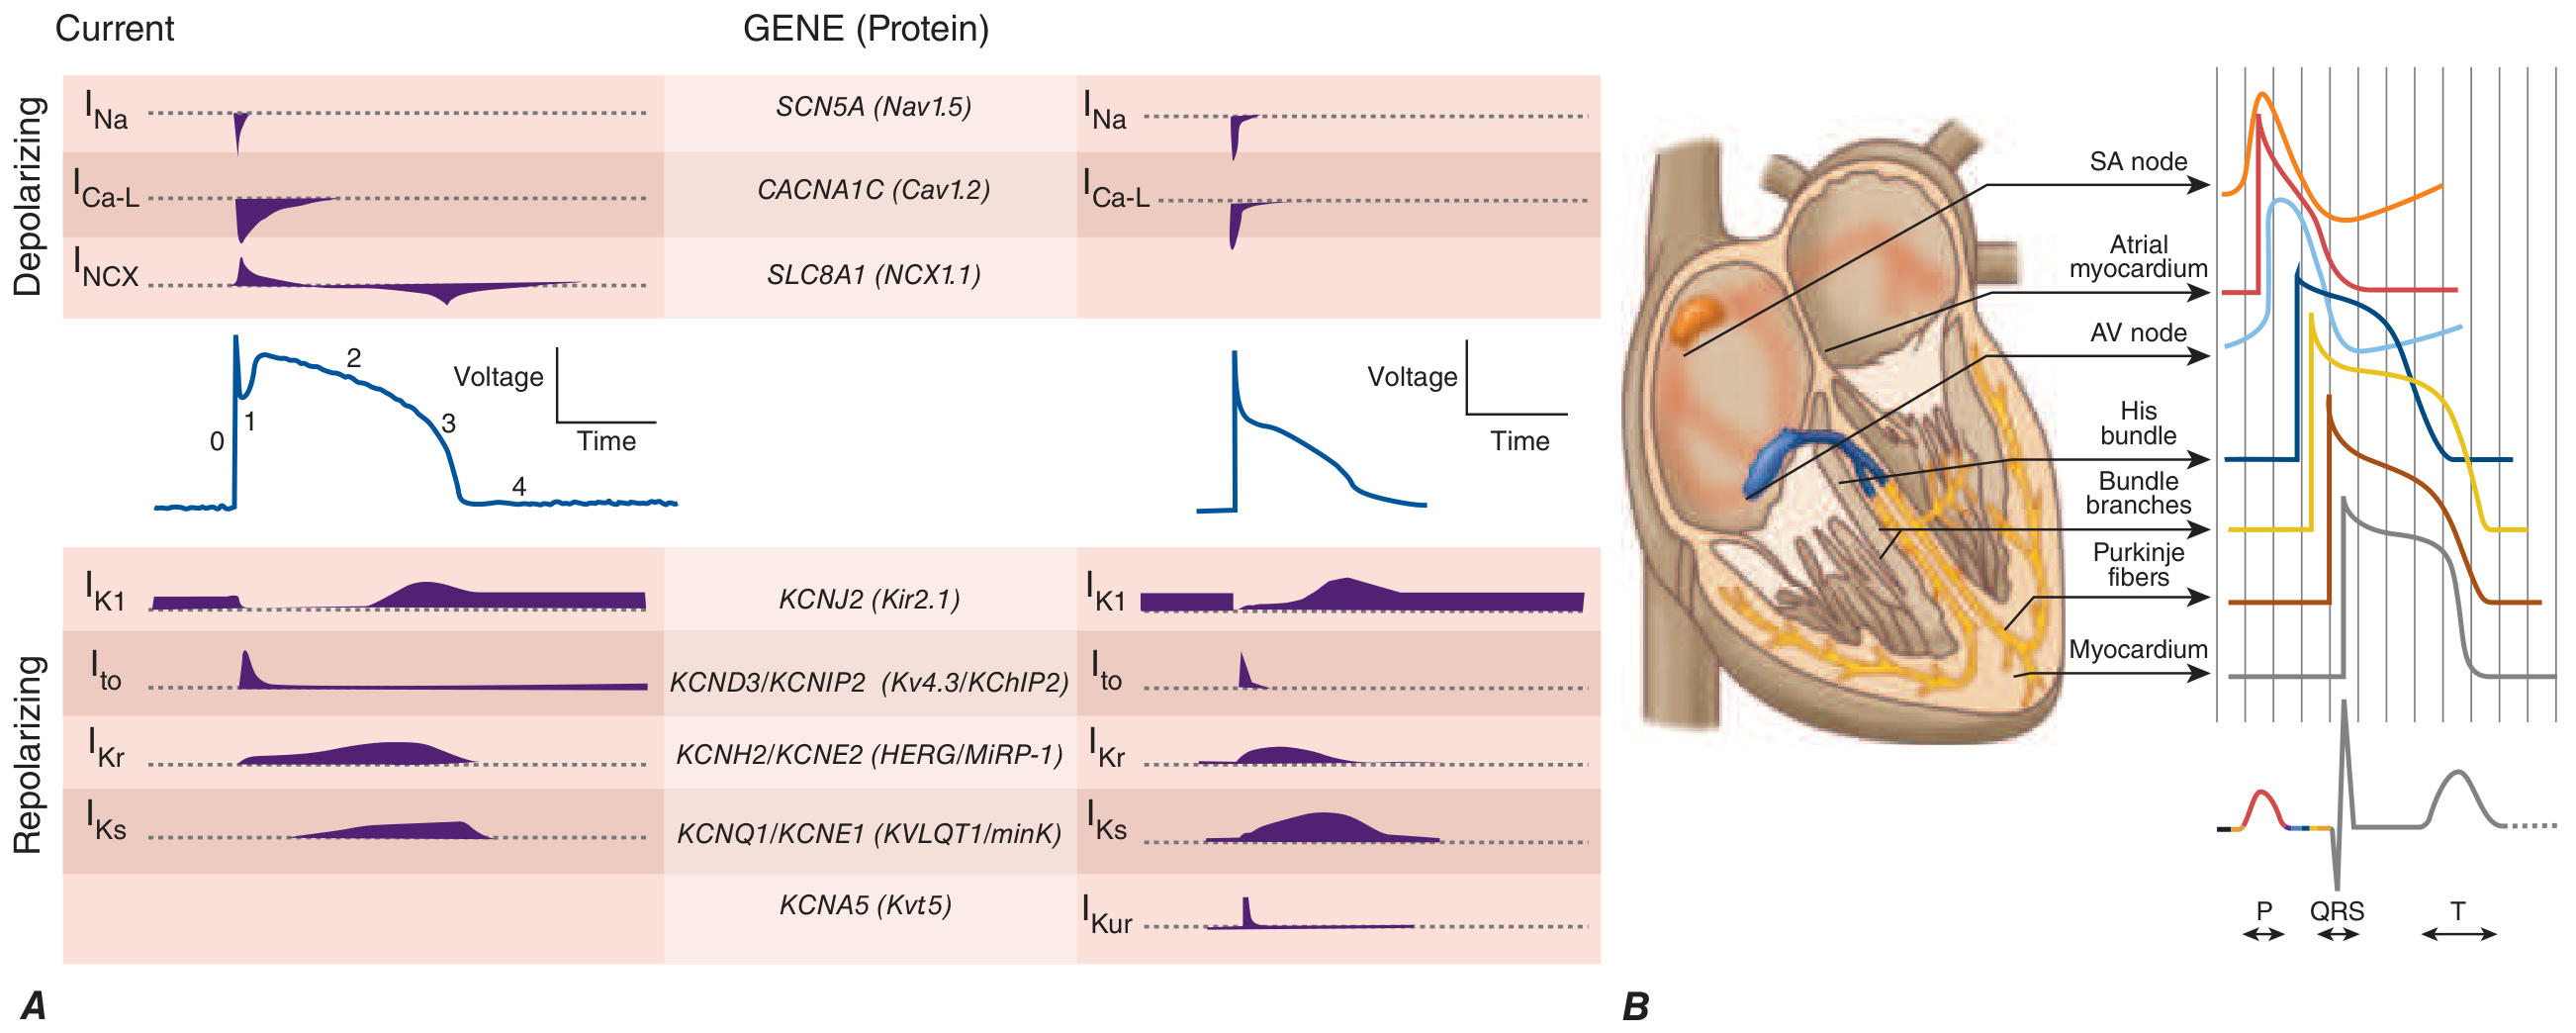
Harrison's Fig 250-1B: Each region's action potential maps to specific ECG segments. Note: AV nodal and His-Purkinje activity during the PR interval is electrically silent on the surface ECG.
| ECG Component | Ionic Basis | What It Represents |
|---|---|---|
| P wave | I_Na → atrial phase 0 | Atrial depolarization |
| PR interval | AV nodal slow Ca2+ conduction | Atrio-ventricular conduction delay |
| QRS complex | Ventricular I_Na (phase 0) | Ventricular depolarization |
| ST segment | Phase 2 plateau (I_CaL balanced by I_K) | Ventricular action potential plateau |
| T wave | Phase 3 repolarization (I_Kr, I_Ks) | Ventricular repolarization |
| U wave | Phase 4 / afterdepolarizations? | Purkinje repolarization or mid-myocardial cells |
2. ECG Paper and Calibration
The standard ECG is recorded at 25 mm/s on graph paper with:
- Horizontal (time): 1 small box = 1 mm = 40 ms; 1 large box (5 small) = 200 ms
- Vertical (voltage): Standard calibration = 10 mm = 1 mV
Heart Rate Calculation:
- HR (bpm) = 300 ÷ number of large boxes between R waves (for regular rhythms)
- Or: count R waves in a 10-second strip × 6
- Or: 1500 ÷ number of small boxes between R-R intervals
3. The 12-Lead System
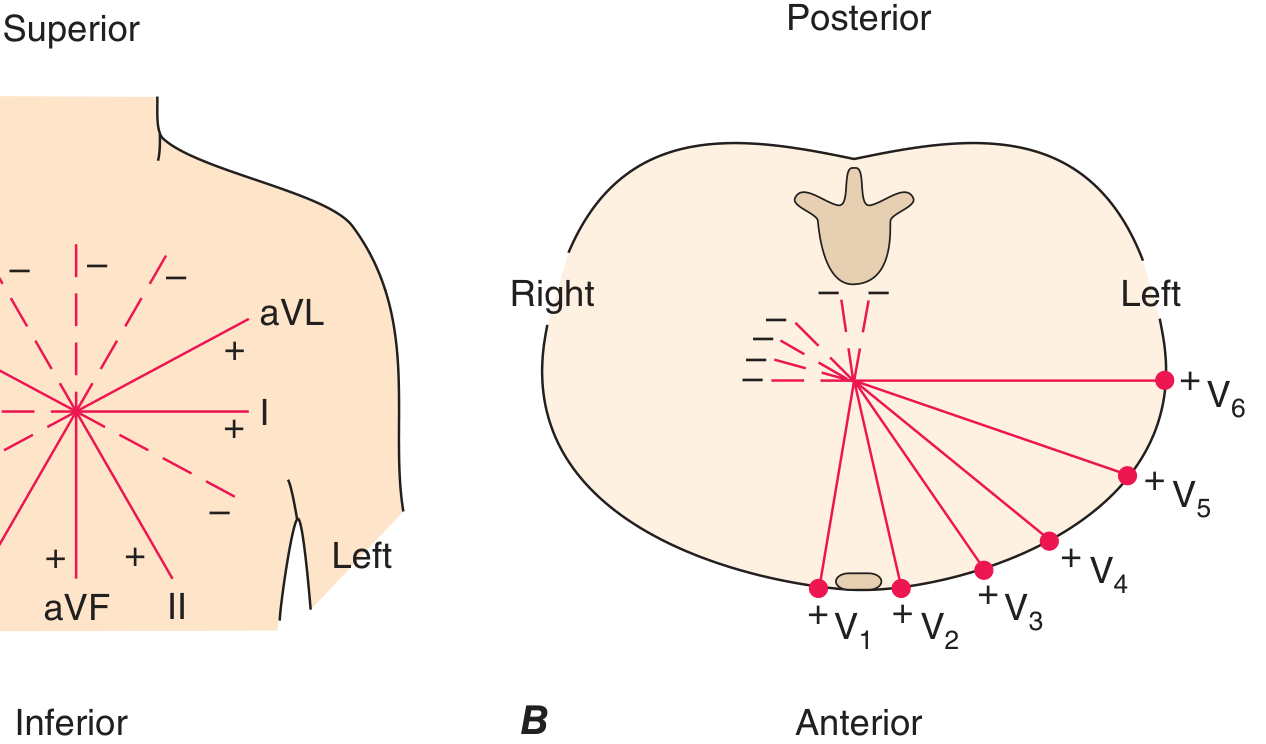
Harrison's Fig 247-3: Frontal plane (A) and horizontal plane (B) lead systems.
Limb Leads (Frontal Plane)
| Lead | Electrode | Views |
|---|---|---|
| I | Left arm (+) vs Right arm (-) | Lateral wall (0°) |
| II | Left leg (+) vs Right arm (-) | Inferior wall (+60°) |
| III | Left leg (+) vs Left arm (-) | Inferior wall (+120°) |
| aVR | Right arm (+) | Cavity / mirror of lateral (-150°) |
| aVL | Left arm (+) | High lateral (-30°) |
| aVF | Left foot (+) | Inferior wall (+90°) |
Precordial Leads (Horizontal Plane)
| Lead | Position | Views |
|---|---|---|
| V1 | 4th ICS, right sternal border | RV, septum |
| V2 | 4th ICS, left sternal border | Septum |
| V3 | Between V2 and V4 | Anterior septum |
| V4 | 5th ICS, midclavicular line | Anterior LV |
| V5 | Anterior axillary line | Lateral LV |
| V6 | Midaxillary line | Lateral LV |
Additional leads:
- Right-sided leads (V3R-V6R): Detect right ventricular MI - always get V3R/V4R in inferior STEMI
- Posterior leads (V7-V9): Detect posterior MI (ST elevation posterior = ST depression in V1-V3)
Key principle: A positive (upright) deflection in any lead means the depolarization wave is traveling toward that lead's positive electrode.
4. Normal ECG Waveforms and Intervals
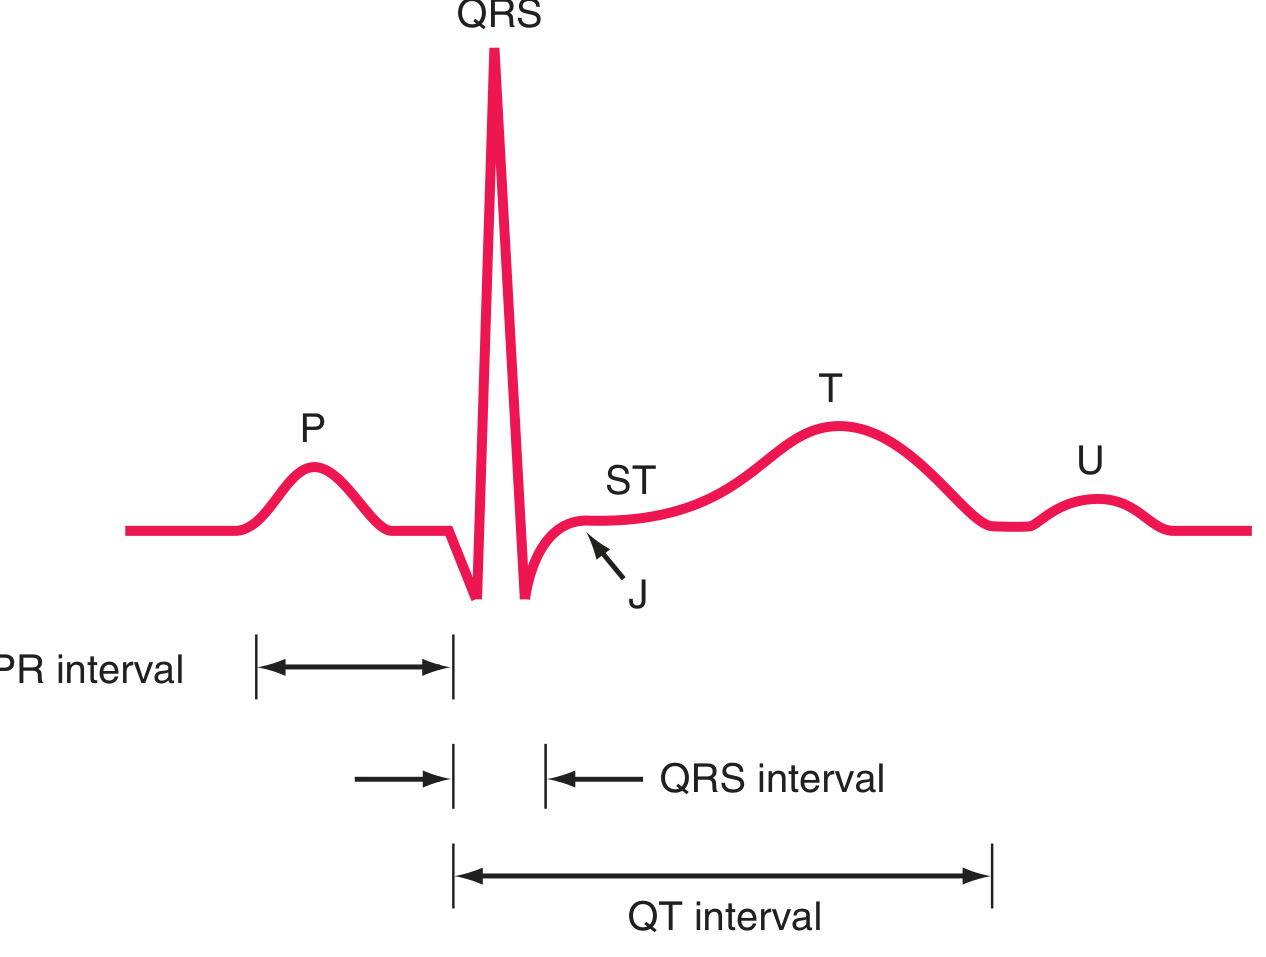
Harrison's Fig 247-2: The fundamental ECG waveforms and intervals.
Waveform Descriptions
P Wave
- Duration: < 120 ms; Amplitude: < 2.5 mm
- Normal: upright in I, II, aVF, V4-V6; inverted in aVR
- Represents atrial depolarization (right then left atrium)
- Sinus P waves: always positive in II, always negative in aVR
PR Interval
- Normal: 120-200 ms (3-5 small boxes)
- Measured from start of P to start of QRS
- Represents conduction through: atria → AV node → His bundle → bundle branches → Purkinje
QRS Complex
- Normal: ≤ 100-110 ms (≤ 2.5 small boxes)
- Naming: first negative = Q, first positive = R, negative after R = S, second positive = R'
- If entirely negative = QS complex
Q Waves
- Normal septal Q waves: < 40 ms wide, < 25% of R-wave amplitude, in I, aVL, V5, V6
- Pathologic Q waves: ≥ 40 ms wide OR ≥ 25% R amplitude → indicate prior infarction
ST Segment
- Measured from J-point (QRS-ST junction) to start of T wave
- Normal: isoelectric (< 1 mm deviation in limb leads, < 2 mm in precordial)
T Wave
- Normally concordant (same direction) with QRS
- Normally upright in I, II, V2-V6; inverted in aVR (normal)
- Normally inverted in V1 (and sometimes V2-V3 in women)
QT Interval
- Measured from start of QRS to end of T wave
- Rate-corrected (QTc): QT ÷ √RR (Bazett formula, units in seconds)
- Framingham: QTc = QT + 0.154(1000 - RR) in ms - more accurate at extremes
- Normal QTc: ≤ 450 ms (men), ≤ 460 ms (women)
U Wave
- Small, rounded, follows T wave, < 1 mm, same polarity as T
- Prominent U wave → hypokalemia, bradycardia, drugs (amiodarone, sotalol, dofetilide)
5. Normal Sinus Rhythm - Criteria
Normal sinus rhythm (NSR) requires all of the following:
- P waves present and regular
- P wave positive in lead II, negative in aVR (confirming sinus origin)
- Every P wave followed by a QRS (1:1 P:QRS ratio)
- PR interval 120-200 ms and constant
- Rate 60-100 bpm
- Regular R-R intervals (variation < 10%, or up to 12% with respiratory variation)
Normal sinus variation: sinus arrhythmia - rate increases on inspiration (vagal withdrawal), decreases on expiration - completely normal.
6. The Normal 12-Lead ECG
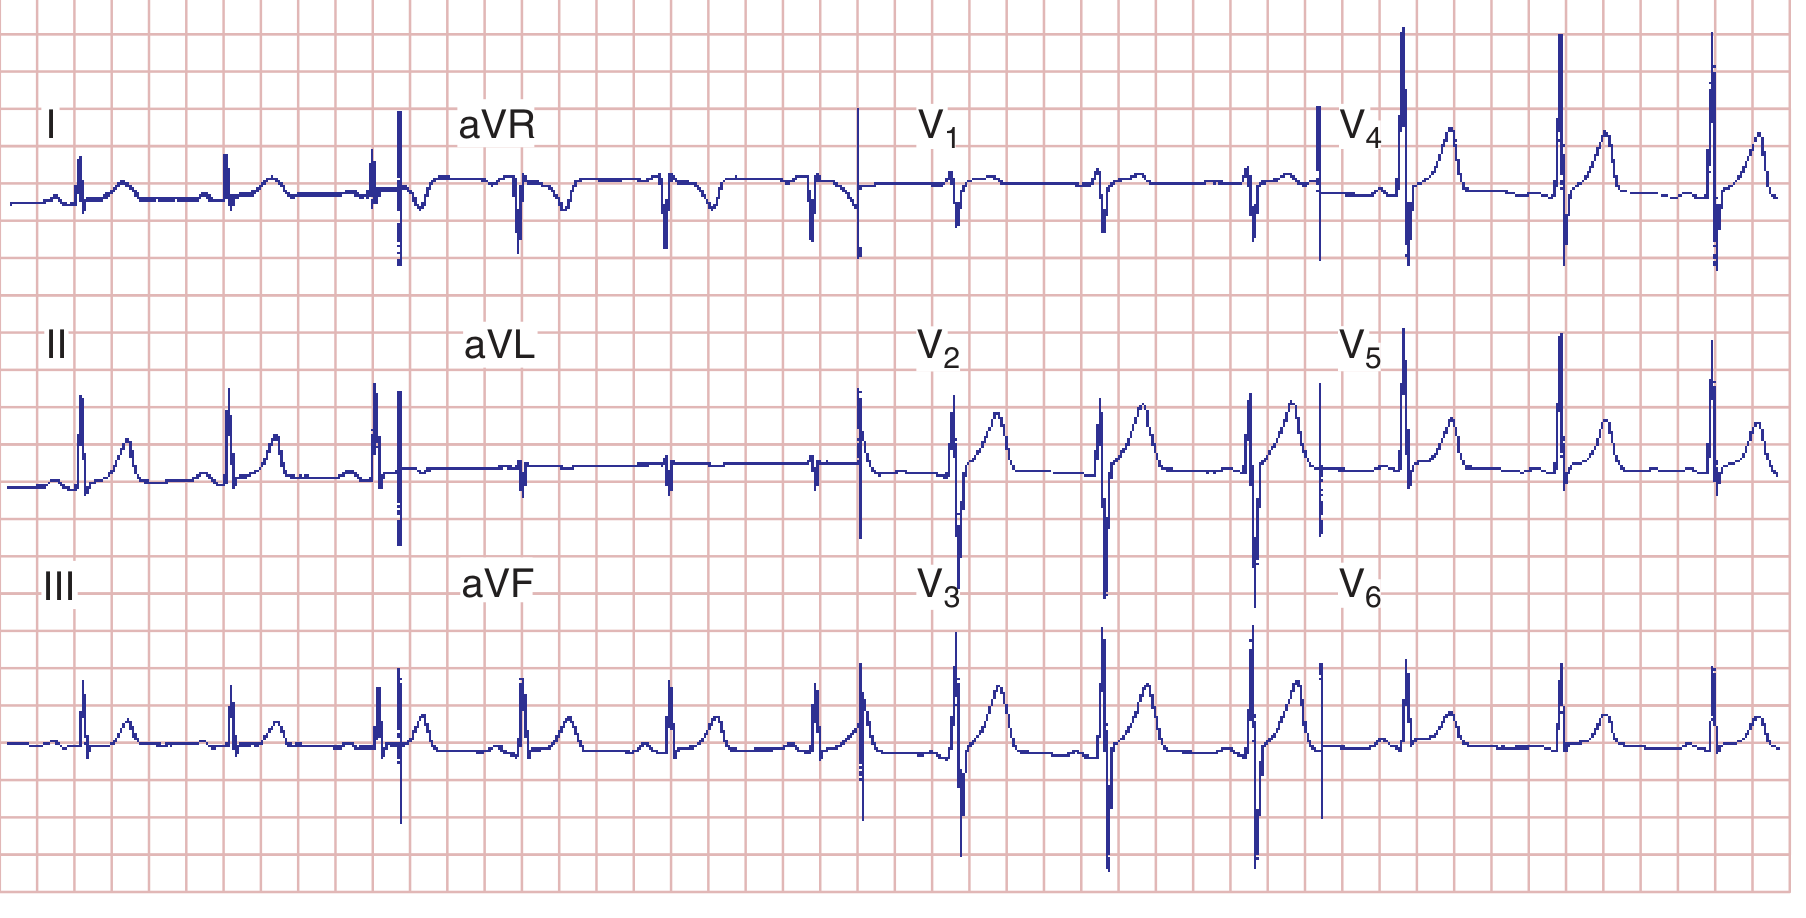
Harrison's Fig 247-7: Normal 12-lead ECG. Note normal R-wave progression in precordial leads.
Normal R-Wave Progression
As you move from V1 to V6, R waves increase and S waves decrease:
- V1: small r, deep S (rS pattern) - right precordial, septal depolarization moves away
- V2-V3: transitional - increasing R
- Transition zone (R = S): normally V3 or V4
- V5-V6: tall R, small s (Rs or R pattern) - left precordial, LV dominates
Poor R-wave progression (PRWP): R still small at V4 → suggests anterior MI, LVH, LBBB, or poor lead placement.
7. Cardiac Axis
Hexaxial Reference System
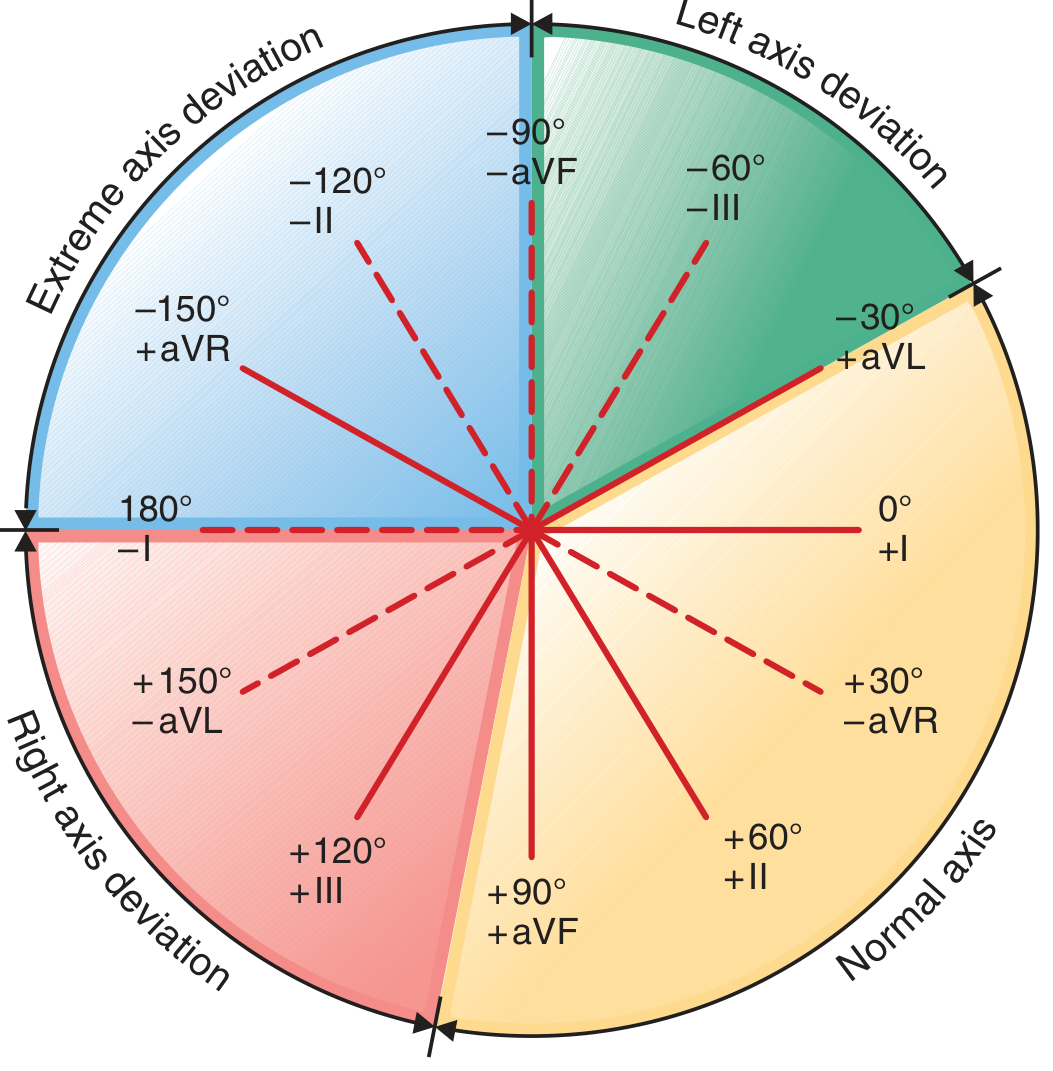
Harrison's Fig 247-4: The hexaxial system and axis zones.
Quick Axis Determination
| Axis | Lead I | Lead aVF | Range |
|---|---|---|---|
| Normal | Positive | Positive | -30° to +90° |
| Left Axis Deviation (LAD) | Positive | Negative | -30° to -90° |
| Right Axis Deviation (RAD) | Negative | Positive | +90° to +180° |
| Extreme/Northwest | Negative | Negative | -90° to ±180° |
Precise axis: Find the limb lead where QRS is most isoelectric (equiphasic) → the true axis is perpendicular to that lead.
Causes of Axis Deviation
| Left Axis Deviation | Right Axis Deviation |
|---|---|
| Left anterior fascicular block (most common) | Right ventricular hypertrophy (RVH) |
| Inferior MI | Left posterior fascicular block |
| LVH (sometimes) | WPW (right-sided pathway) |
| LBBB | PE / acute cor pulmonale |
| WPW (left-sided pathway) | Dextrocardia |
| Obesity, pregnancy | Normal children / thin young adults |
8. Normal Ventricular Depolarization - The Two Vectors
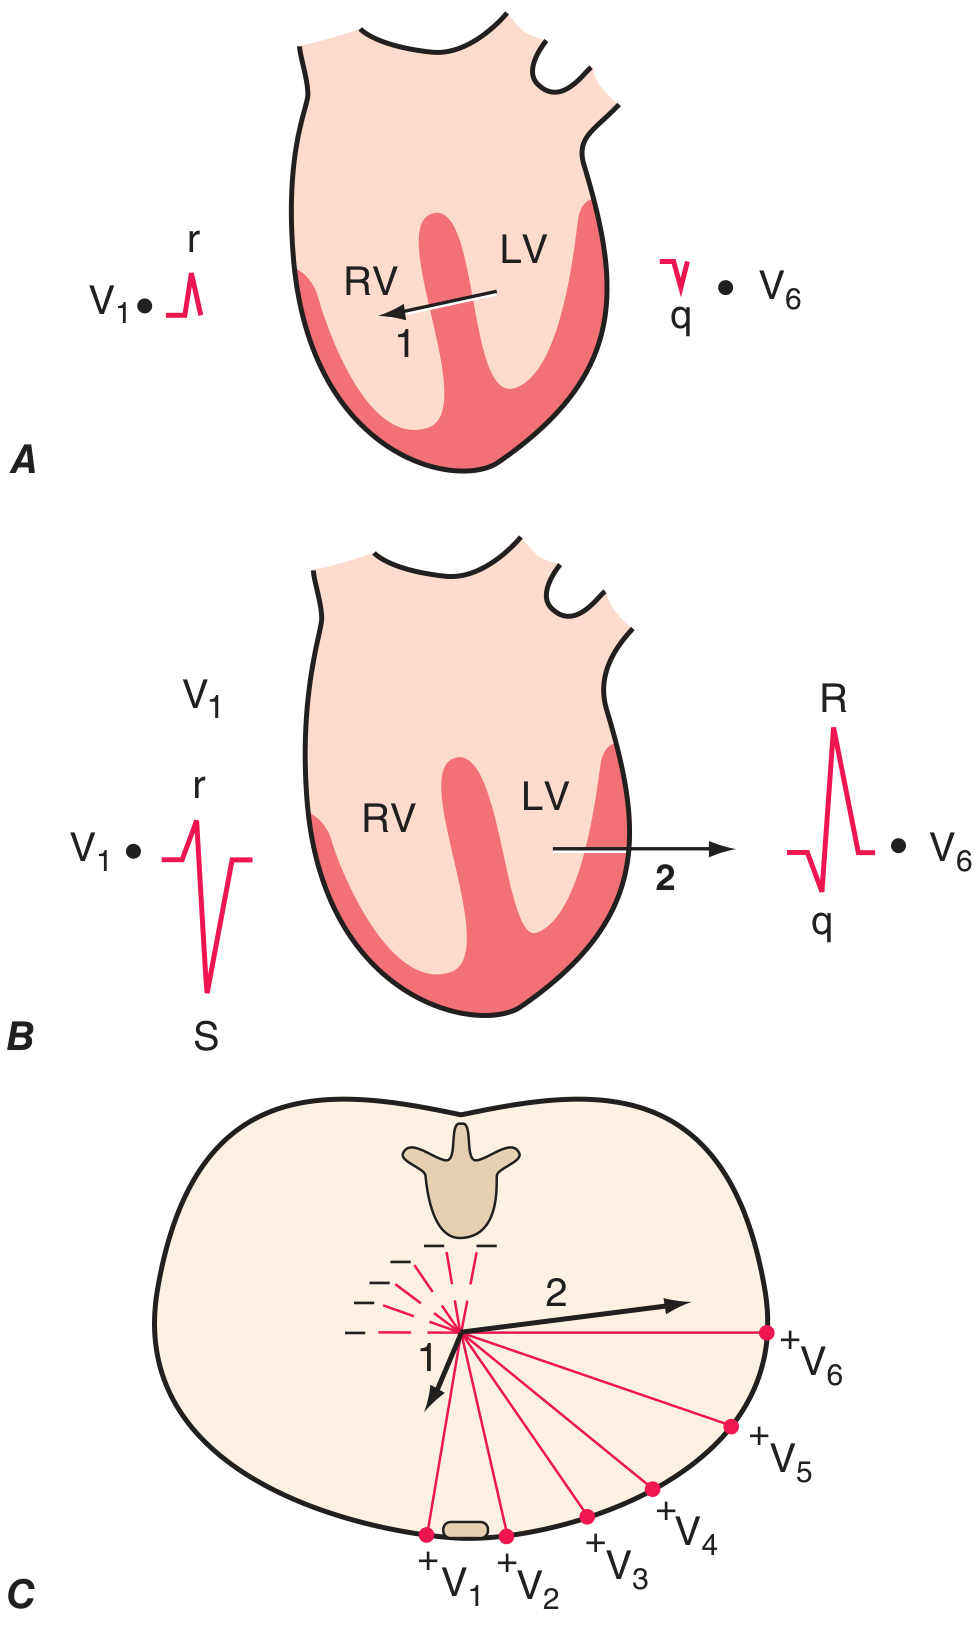
Harrison's Fig 247-6: Ventricular depolarization as two sequential vectors.
Phase 1 (Septal activation): Left bundle branch activates the septum from left → right (vector points right-anteriorly) → produces small r in V1 and small septal q in V6.
Phase 2 (Free wall activation): Simultaneous LV + RV depolarization - LV mass dominates → vector points leftward and posteriorly → produces deep S in V1 and tall R in V6.
9. Cardiac Hypertrophy Patterns
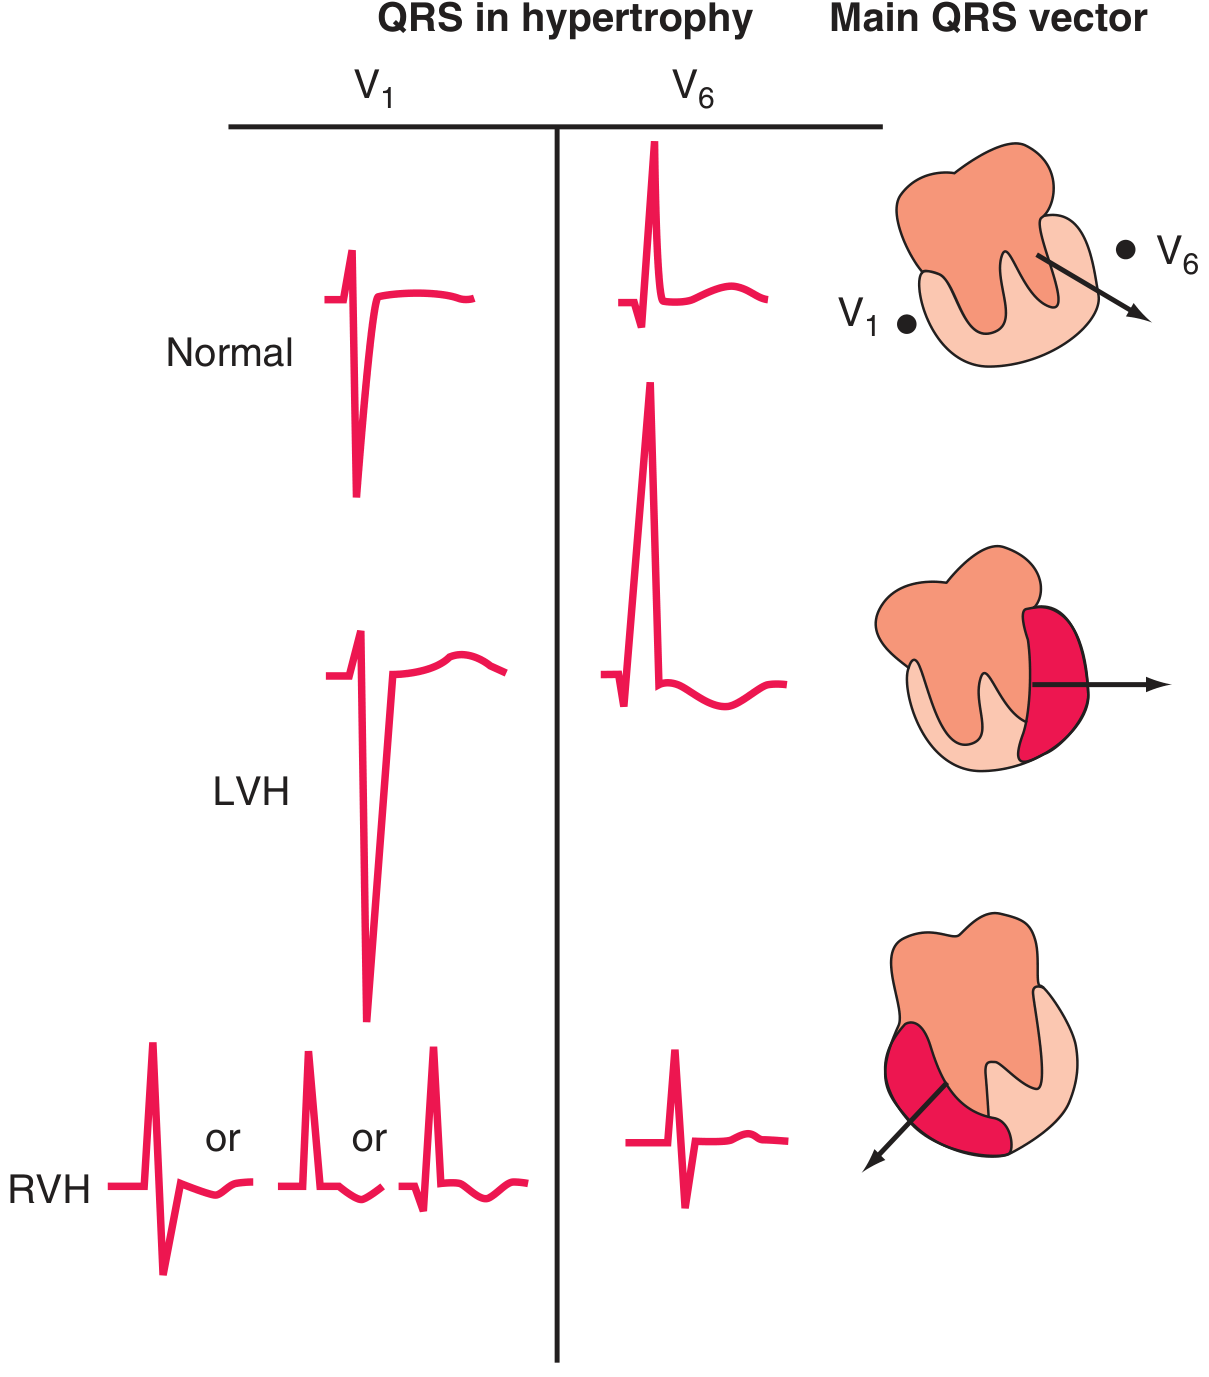
Harrison's Fig 247-9: QRS-T patterns in ventricular hypertrophy.
Left Ventricular Hypertrophy (LVH)
Voltage criteria (at least one required):
- Sokolow-Lyon: SV1 + RV5 (or V6) ≥ 35 mm
- Cornell: RaVL + SV3 > 28 mm (men) or > 20 mm (women)
- RaVL > 20 mm (women) or > 28 mm (men) alone
Repolarization criteria (the "strain pattern"):
- ST depression + T-wave inversion (asymmetric) in leads with prominent R waves (I, aVL, V5-V6)
- Indicates pressure or volume overload, worsens prognosis
Associated findings:
- Left atrial abnormality (broad, notched P in II; biphasic P in V1)
- LAD (left axis deviation, sometimes)
Causes: Hypertension (most common), aortic stenosis, hypertrophic cardiomyopathy
Right Ventricular Hypertrophy (RVH)
Criteria:
- R ≥ S in V1 (dominant R wave in right precordial leads) - the key finding
- Right axis deviation (> +90°) - usually present
- rSR' pattern in V1 (similar to RBBB but QRS < 120 ms with incomplete RBBB)
- ST depression and T-wave inversions in V1-V3 ("RV strain")
- Prominent S waves in V5-V6 (qRS or RS pattern)
- qR pattern in V1 suggests severe RVH
Causes: Pulmonary hypertension, pulmonary stenosis, cor pulmonale, ASD (with volume overload → RBBB pattern)
Important: Acute cor pulmonale (PE, ARDS) may cause:
- S1Q3T3 pattern - S wave in I, Q wave in III, T-wave inversion in III (not specific, but classic)
- Sinus tachycardia, right bundle branch block, RV strain
Atrial Abnormalities
| Finding | Right Atrial | Left Atrial |
|---|---|---|
| P-wave amplitude | > 2.5 mm, peaked ("P-pulmonale") | Normal or slightly tall |
| P-wave duration | Normal | > 120 ms, notched ("P-mitrale") |
| P in V1 | Tall, peaked early positive | Biphasic: positive then prominent negative terminal deflection (>1 mm wide, >1 mm deep) |
| Classic cause | Pulmonary hypertension, tricuspid stenosis | Mitral stenosis, LA enlargement |
10. Bundle Branch Blocks
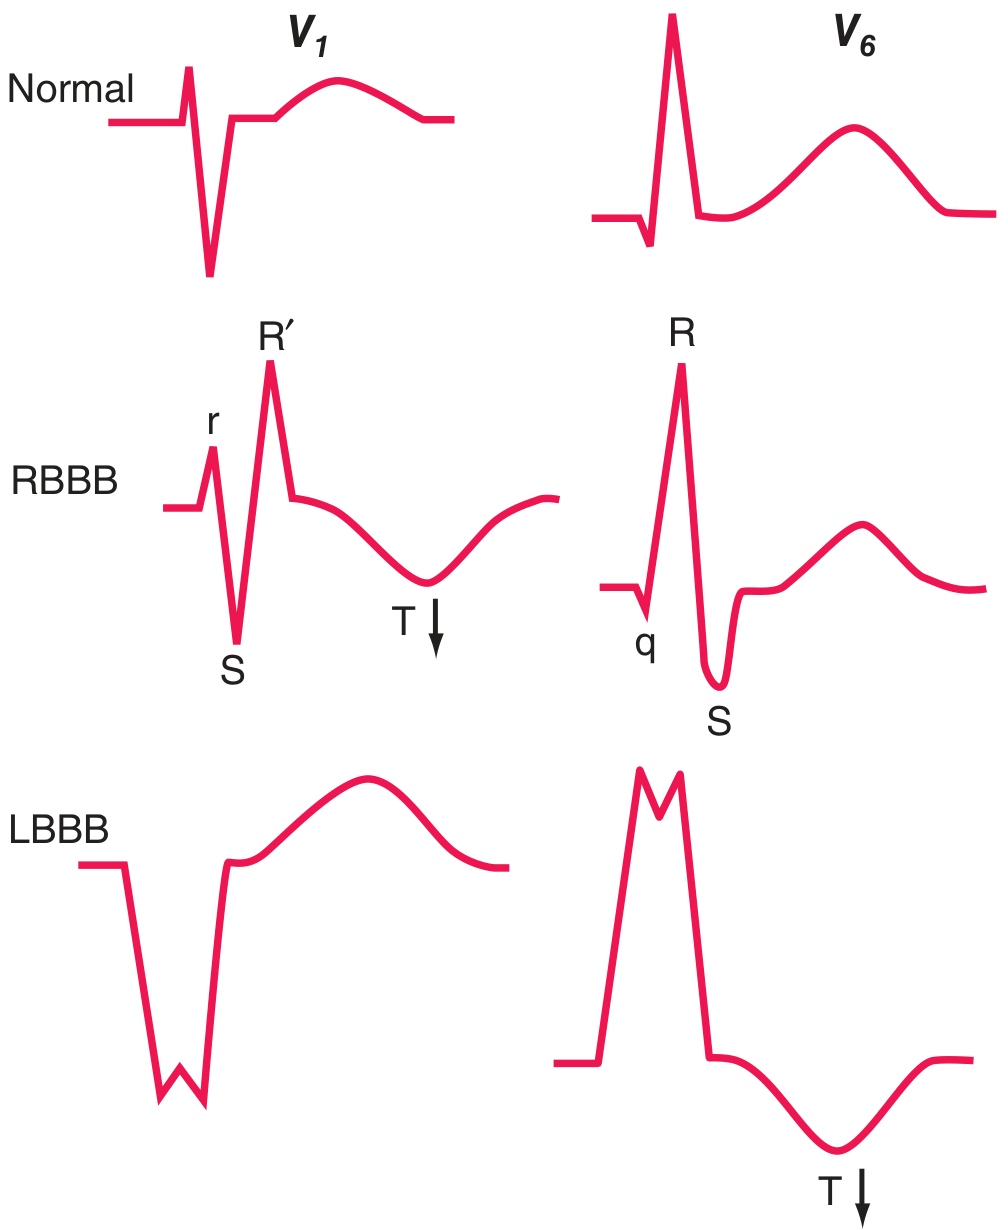
Harrison's Fig 247-10: RBBB and LBBB patterns compared to normal.
Right Bundle Branch Block (RBBB)
Criteria:
- QRS ≥ 120 ms (complete); 110-120 ms (incomplete)
- rSR' ("rabbit ears") in V1 or V2 - the hallmark
- Wide, slurred S waves in I, aVL, V5-V6
- Secondary T-wave inversion in V1-V2 (opposite to terminal R')
Mechanism: RV is activated late, via slow cell-to-cell spread from LV → delayed right ventricular depolarization creates a second rightward vector (R' in V1, wide S in left leads).
Causes: Normal variant (most common in adults without structural heart disease), ASD, RV pressure overload, PE, ischemia, cardiomyopathy, post-cardiac surgery.
RBBB does NOT mask MI or LVH - you can still diagnose anterior and inferior MI patterns in RBBB.
Left Bundle Branch Block (LBBB)
Criteria:
- QRS ≥ 120 ms (complete)
- Broad, notched R wave in I, aVL, V5-V6 (no q waves in these leads)
- QS or rS complex in V1 - the hallmark right precordial pattern
- Discordant ST-T: T waves opposite to dominant QRS deflection (ST elevation in V1-V2, ST depression in V5-V6)
Mechanism: LV activates late via cell-to-cell spread from RV → reversal of normal septal activation (no septal q in left leads), entire LV activation delayed.
Clinical significance of LBBB:
- Often indicates underlying heart disease: CAD (most common), hypertensive heart disease, aortic valve disease, cardiomyopathy
- New LBBB in chest pain = STEMI-equivalent (Sgarbossa criteria below)
- Masks LVH and inferior MI on ECG
- Indication for CRT if QRS ≥ 130-150 ms + HFrEF + NYHA II-IV
Sgarbossa Criteria for MI in LBBB
When a patient with LBBB has a suspected MI, standard criteria don't apply. The Sgarbossa criteria use concordance (abnormal in LBBB, where ST should be discordant):
| Criterion | Points | Specificity |
|---|---|---|
| ST elevation ≥ 1 mm concordant with QRS (same direction) | 5 | ~98% |
| ST depression ≥ 1 mm in V1, V2, V3 (concordant with QS) | 3 | ~96% |
| ST elevation ≥ 5 mm discordant with QRS (opposite direction) | 2 | ~80% |
Score ≥ 3 = highly suggestive of MI. Modified Sgarbossa: ST/S ratio ≥ 0.25 replaces the 5-mm rule (better sensitivity).
Fascicular Blocks (Hemiblocks)
The left bundle has two fascicles: anterior (supplies anterosuperior LV) and posterior (supplies posteroinferior LV).
| Left Anterior Fascicular Block (LAFB) | Left Posterior Fascicular Block (LPFB) | |
|---|---|---|
| QRS duration | Normal (< 120 ms) | Normal |
| Axis | Left axis deviation (< -45°) | Right axis deviation (> +110°) |
| Lead pattern | qR in I, aVL; rS in II, III, aVF | rS in I, aVL; qR in II, III, aVF |
| Prevalence | Common - most common cause of marked LAD | Rare in isolation |
| Exclusions needed | None specific | Must exclude RVH, PE, lateral MI |
Bifascicular block: RBBB + LAFB (most common combination). Or RBBB + LPFB.
Trifascicular block: Bifascicular block + first-degree AV block → indicates widespread conduction disease, pacemaker often indicated.
11. Ischemia and Infarction Patterns
Mechanism of ST Changes
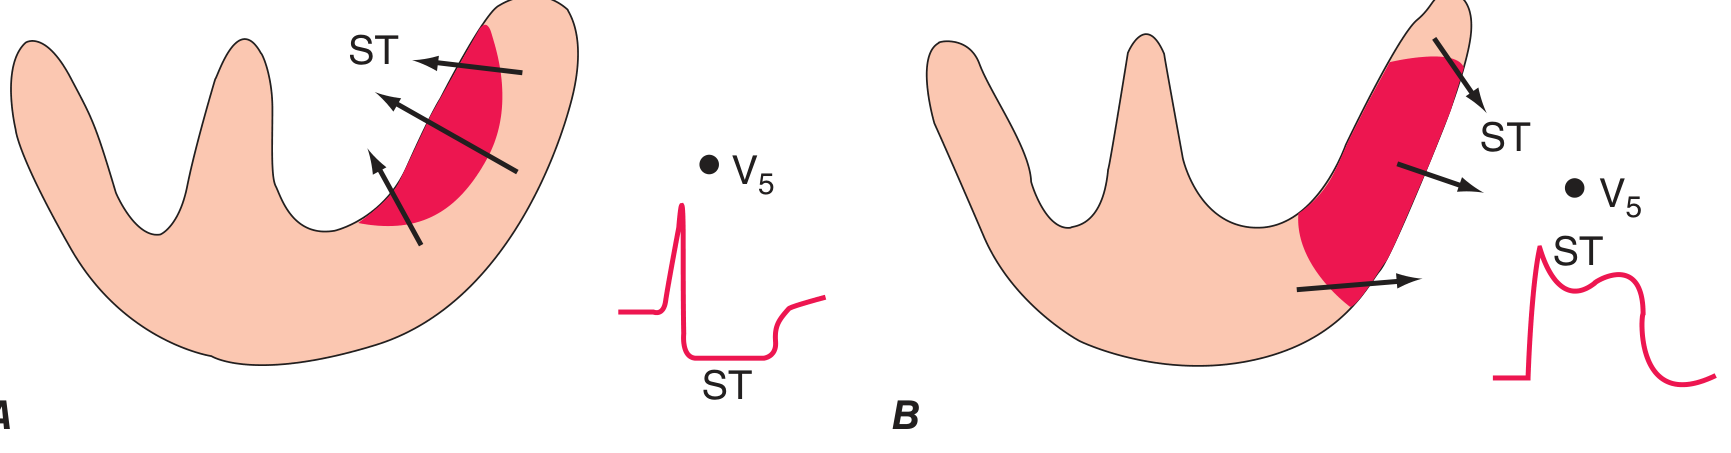
Harrison's Fig 247-11: Currents of injury explain ST deviation direction.
Transmural (epicardial) ischemia: ST vector toward epicardium → ST elevation in overlying leads.
Subendocardial ischemia: ST vector toward cavity → ST depression in overlying leads (elevation in aVR).
The Evolutionary ECG Changes of STEMI
The ECG evolves through characteristic stages after acute transmural MI:
Minutes: "Hyperacute" tall, peaked T waves (earliest - often missed)
↓
Hours: ST elevation (tombstone shape) with tall T
↓
Hours-days: ST elevation + Q waves develop + T-wave inversion begins
↓
Days-weeks: Q waves persist, ST resolves, deep T-wave inversions
↓
Months-years: Q waves remain (permanent scar marker), T waves may normalize
Persistent ST elevation > 2-3 weeks after MI suggests ventricular aneurysm.
Localizing the Infarct Territory
| ECG Territory | Leads with Changes | Coronary Artery | Wall |
|---|---|---|---|
| Anterior (large) | V1-V4 | LAD (proximal) | Anterior + septal |
| Anteroseptal | V1-V3 | LAD (diagonal) | Septum |
| Anterolateral | V1-V6, I, aVL | LAD or LCx | Anterior + lateral |
| Lateral (high) | I, aVL | LCx or diagonal | High lateral |
| Lateral (low) | V5-V6 | LCx | Lateral |
| Inferior | II, III, aVF | RCA (80%) or LCx (20%) | Inferior |
| Right ventricular | V3R, V4R | RCA | RV (proximal RCA) |
| Posterior | Reciprocal: ST depression V1-V3 | LCx or RCA | Posterior (= ST elevation in V7-V9) |
Key clinical tip: In inferior STEMI (II/III/aVF), always check:
- V3R/V4R for RV involvement (ST elevation > 0.5 mm → RV infarct → avoid nitrates and diuretics)
- V1-V3 for ST depression (posterior involvement → add posterior leads)
- ST elevation in III > II suggests RCA; ST elevation in II ≥ III + ST depression in V1-V3 suggests LCx (circumflex)
Q-Wave Patterns
Pathologic Q waves (≥ 40 ms wide OR ≥ 25% of R-wave amplitude in ≥ 2 contiguous leads) indicate myocardial necrosis. However:
- Transmural MI can occur without Q waves ("non-Q-wave MI")
- Subendocardial MI can develop Q waves
- Preferred terms: "Q-wave MI" vs "non-Q-wave MI" rather than transmural vs subendocardial
Pseudoinfarction patterns (Q waves without MI):
- LBBB (QS in V1-V2)
- WPW (delta wave may mimic Q)
- HCM (septal hypertrophy → deep narrow Q in I, aVL, V5-V6)
- RVH (QR pattern in V1)
- COPD (QS in V1-V3)
Wellens Syndrome
Deep, symmetric T-wave inversions in V2-V3 (sometimes V1-V4) in a patient with chest pain → critical LAD stenosis (proximal or mid) threatening anterior wall.
Two types:
- Type A: Biphasic T waves (positive-negative) in V2-V3
- Type B: Deep symmetric T inversions in V2-V3 (more common)
Critical: These patients often have resolution of pain and may appear stable, but are at high risk for anterior STEMI. Do NOT stress test. Requires urgent angiography.
De Winter Pattern
Instead of ST elevation, shows upsloping ST depression ≥ 1 mm at J-point with tall, symmetric T waves in V1-V6 + occasional ST elevation in aVR. Represents LAD proximal occlusion - treat as STEMI-equivalent.
12. QT Prolongation and Torsades de Pointes
QTc Normal Values
| QTc | Interpretation |
|---|---|
| < 440 ms | Normal (men) |
| < 460 ms | Normal (women) |
| 440-500 ms | Borderline / monitor |
| > 500 ms | High risk for torsades de pointes |
Causes of QT Prolongation
Electrolytes (hypomagnesemia, hypokalemia, hypocalcemia) - the 3 H's
Drugs (extensive list - key ones):
- Class IA antiarrhythmics: quinidine, procainamide, disopyramide
- Class III antiarrhythmics: amiodarone (usually modest), sotalol, dofetilide, ibutilide
- Antibiotics: azithromycin, fluoroquinolones, erythromycin
- Antifungals: fluconazole
- Antipsychotics: haloperidol, quetiapine, ziprasidone
- Antidepressants: TCA, SSRIs (citalopram)
- Antiemetics: ondansetron, metoclopramide
Congenital Long QT Syndromes (LQTS):
- LQT1 (KCNQ1/IKs): broad T wave, events with exercise (swimming) - β-blocker therapy
- LQT2 (KCNH2/IKr = HERG): notched T wave, events with sudden noise - avoid QT-prolonging drugs
- LQT3 (SCN5A/INa): late-onset long isoelectric ST, events at rest/sleep - mexiletine, ICD
Torsades de Pointes ("twisting of the points"):
- Polymorphic VT with QRS complexes that twist around the isoelectric line
- Associated with QTc > 500 ms
- Typically self-limiting but can degenerate to VF
- Treatment: IV magnesium sulfate (2 g IV bolus) → cardiac pacing to increase rate (shorten QT) → avoid QT-prolonging drugs → correct electrolytes
Short QT Syndrome
QTc < 330-340 ms → associated with VF/SCD risk. Rare genetic channelopathies (KCNH2 gain-of-function, etc.).
13. Electrolyte Effects on the ECG
Hyperkalemia - Progressive Sequence
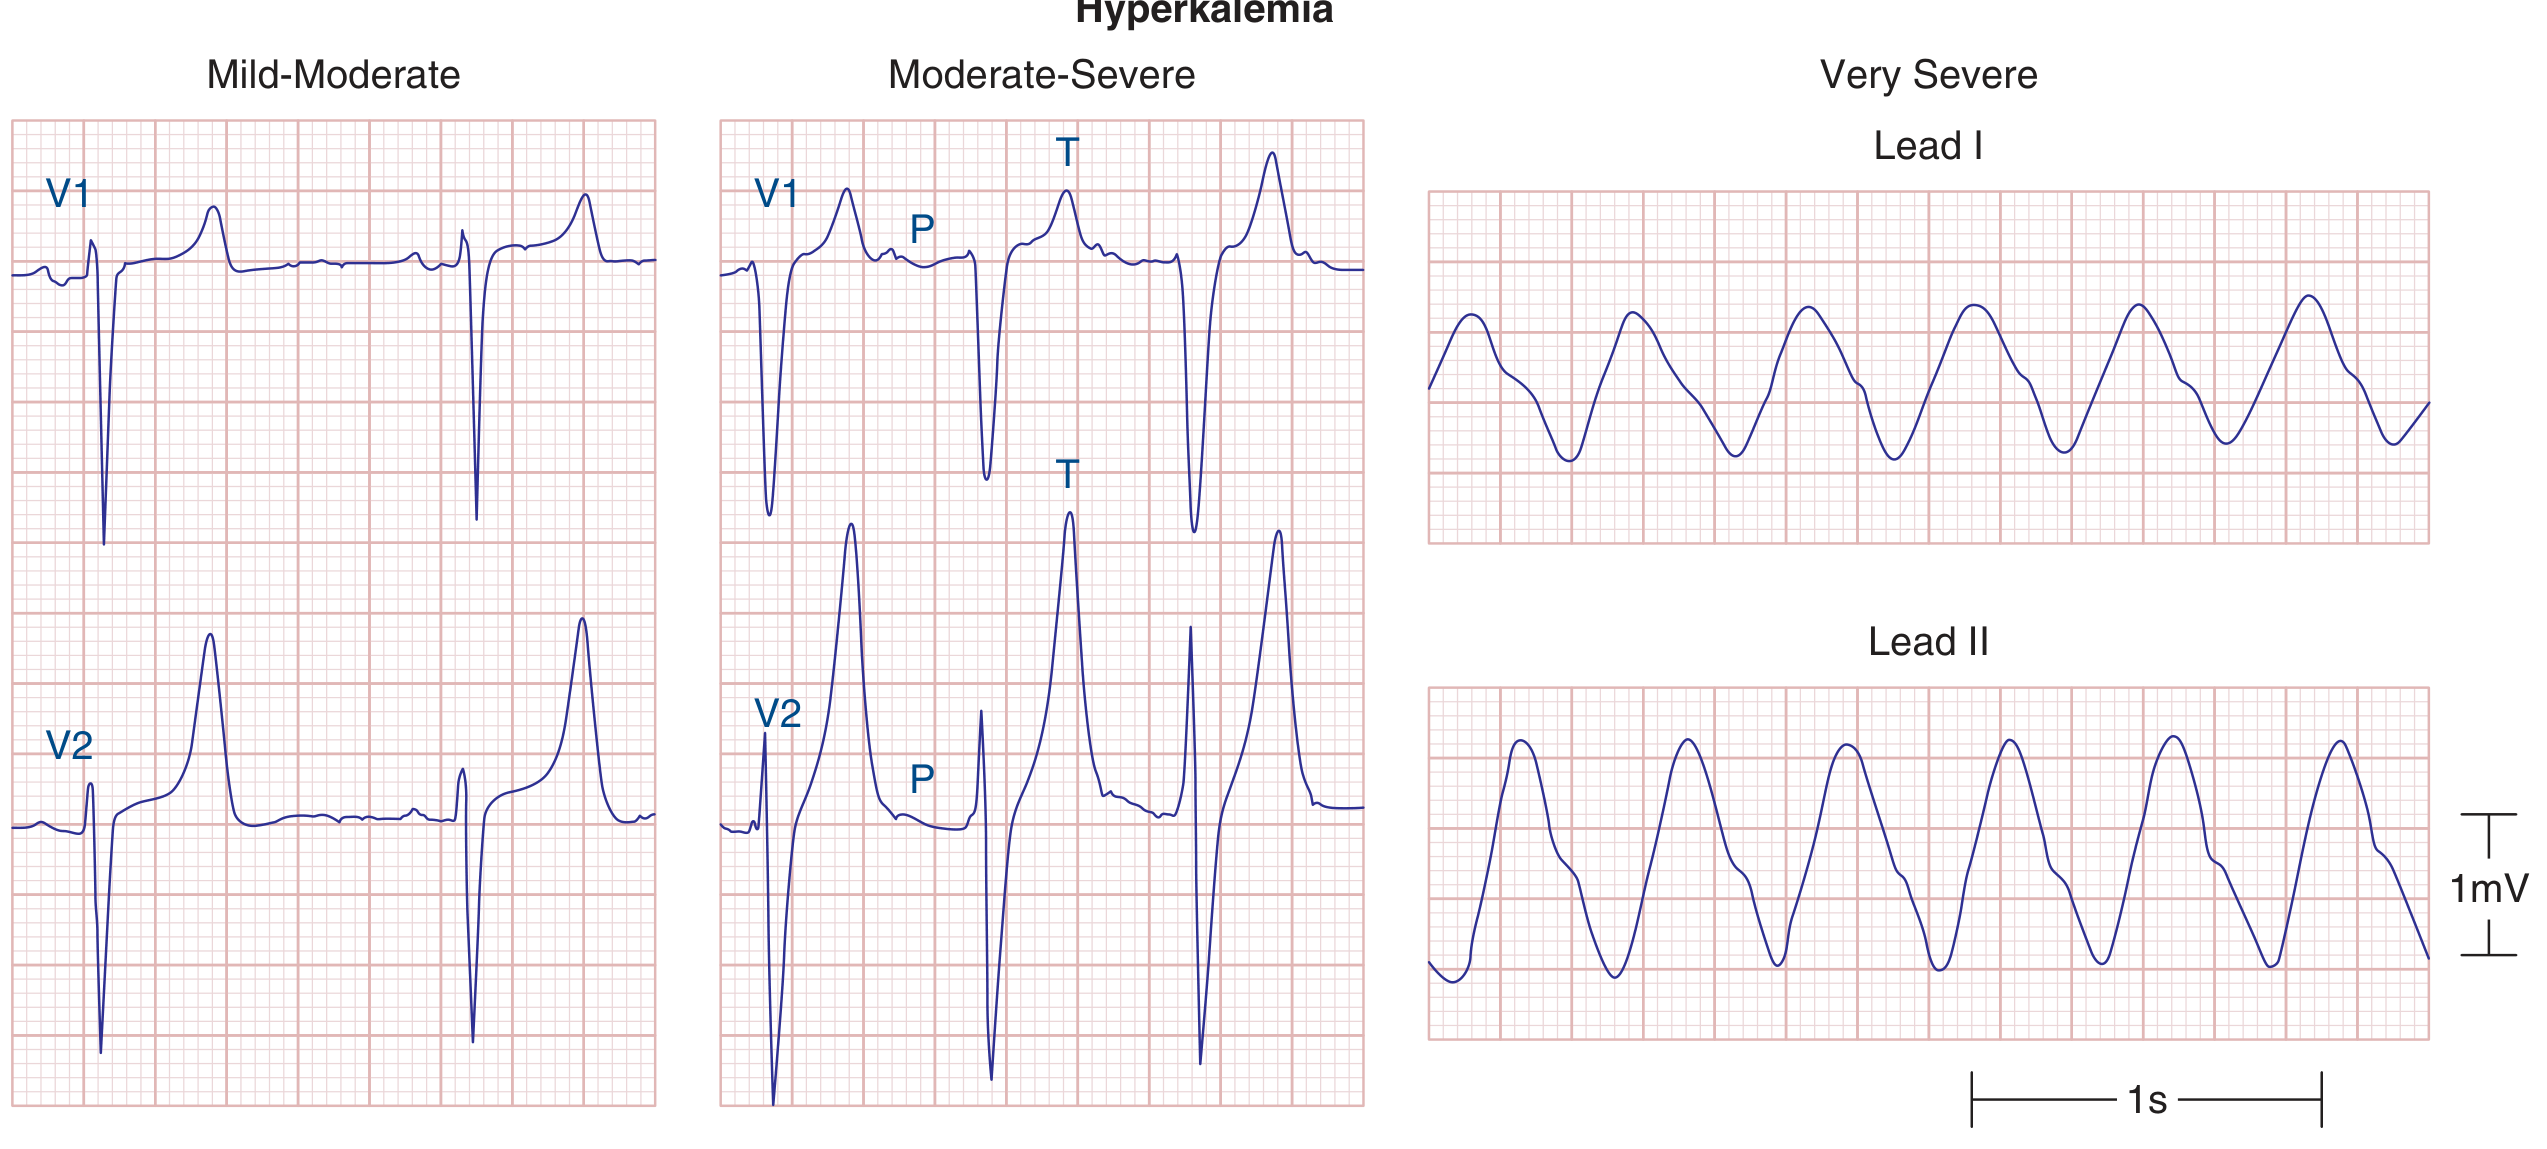
Harrison's Fig 247-14: Progressive ECG changes with hyperkalemia.
| K+ Level (mEq/L) | ECG Findings |
|---|---|
| 5.5-6.5 | Peaked, narrow, tall T waves ("tenting") - first sign |
| 6.5-7.5 | PR prolongation, P wave flattening, QRS widening |
| 7.5-9.0 | P waves disappear, very wide QRS, severe conduction block |
| > 9.0 | Sine-wave pattern → ventricular fibrillation → asystole |
Treatment of hyperkalemic ECG changes:
- Calcium gluconate (membrane stabilization, immediate) - does NOT lower K+
- Insulin + glucose (shift K+ intracellularly - 15-30 min onset)
- Sodium bicarbonate (alkalosis shifts K+ in)
- Kayexalate / patiromer / sodium zirconium cyclosilicate (eliminate K+)
- Dialysis (severe/refractory)
Hypokalemia
- Flattened T waves + prominent U waves (T-U fusion giving appearance of "prolonged QT")
- True QT may not be as prolonged as it appears if U wave is merged with T
- ST depression
- Increases arrhythmia risk; potentiates digoxin toxicity
Hypocalcemia
- Prolonged QT interval (specifically prolongs the ST segment / phase 2)
- Mild T-wave changes
Hypercalcemia
- Short QT interval (shortens phase 2)
- Osborn (J) waves may occasionally be seen
- Can cause bradycardia and AV block at very high levels
Hypothermia (< 35°C)
- Osborn (J) waves: Positive deflection at the J-point (QRS-ST junction), most prominent in inferior and lateral leads - pathognomonic of hypothermia
- Bradycardia, prolonged PR, QRS, and QT
- Tremor artifact (muscle shivering)
14. AV Conduction Abnormalities (Heart Blocks)
First-Degree AV Block
- PR interval > 200 ms (> 1 large box)
- Every P followed by QRS (1:1 conduction, just slow)
- Usually benign; can be due to vagal tone, digoxin, beta-blockers, calcium channel blockers, AV node disease
Second-Degree AV Block
Mobitz Type I (Wenckebach):
- Progressive PR prolongation until a P wave is not conducted (dropped QRS)
- Then cycle resets
- The PR after the dropped beat is the shortest; the PR before the dropped beat is the longest
- Usually at the AV node level (responds to atropine)
- Often reversible (inferior MI, vagal excess, drugs)
- Usually benign - rarely needs pacing unless symptomatic
Mobitz Type II:
- Constant PR interval with sudden, unexpected dropped QRS (no warning PR lengthening)
- Located below the AV node (His-Purkinje system)
- High risk of progression to complete (3rd-degree) heart block
- Usually requires pacing even if asymptomatic
2:1 AV Block:
- Every other P is conducted - cannot determine Mobitz type by PR criterion alone
- Look at QRS width: narrow QRS = likely Wenckebach (nodal); wide QRS = likely Mobitz II (infranodal)
- Also look at response to exercise/atropine: if conduction improves → nodal; if worsens → infranodal
High-grade (advanced) AV block:
- 2 or more consecutive non-conducted P waves
- Essentially impending complete block → pacing
Third-Degree (Complete) AV Block
- Complete AV dissociation - no relationship between P waves and QRS complexes
- P-P interval regular; R-R interval regular; but completely independent
- Escape rhythm: Junctional (narrow QRS, 40-60 bpm, usually stable) or ventricular (wide QRS, 20-40 bpm, unstable)
- Emergency pacing indicated
- Causes: inferior MI (often reversible - junctional escape, responds to atropine), anterior MI (usually permanent - wide QRS escape), Lyme disease, digoxin toxicity, surgical complication, idiopathic calcific degeneration
AV Dissociation vs Complete Heart Block
These are NOT the same:
- AV dissociation: two independent pacemakers (ventricular rate ≥ atrial rate) - does NOT require pacing
- Complete heart block: atrial rate > ventricular rate, with no conduction - usually requires pacing
15. Pre-excitation: WPW Syndrome
Mechanism: Accessory pathway (Bundle of Kent) bypasses AV node → ventricle pre-excited before normal conduction arrives.
Classic ECG triad:
- Short PR interval (< 120 ms) - no AV nodal delay
- Delta wave - slurred upstroke to QRS (fusion of pre-excited and normally conducted activation)
- Wide QRS (> 120 ms, delta wave contribution)
Pseudo-infarction patterns: Delta waves can mimic Q waves → WPW is a major cause of false-positive "inferior MI" or "posterior MI" patterns.
Dangerous in atrial fibrillation: AF with WPW can conduct at rates 200-300 bpm down the accessory pathway → VF risk. ECG: irregularly irregular, wide QRS, extreme rates, varying morphology. NEVER give AV nodal blockers (adenosine, digoxin, verapamil, diltiazem) → can precipitate VF. Treatment: procainamide IV or electrical cardioversion.
Risk stratification: Loss of delta waves with exercise (intermittent pre-excitation) = low risk. Electrophysiology study evaluates effective refractory period of the accessory pathway. Catheter ablation is curative (> 95% success).
16. ST-T Wave Abnormalities: Differential
ST Elevation - Differential Diagnosis
| Cause | Characteristics |
|---|---|
| STEMI | Convex ("tombstone") ST elevation, leads matching a coronary territory, reciprocal changes |
| Early repolarization | Concave ("smiley face") ST elevation in V2-V5, notch at J-point, common in young males, benign |
| Pericarditis | Concave ST elevation in multiple leads (not a coronary territory) + PR depression; no reciprocal ST depression (except aVR) |
| LBBB | Discordant ST elevation in V1-V2 (normal in LBBB) |
| LV aneurysm | Persistent ST elevation (weeks after MI), dyskinetic wall on echo |
| Brugada pattern | Coved ST elevation in V1-V2 (right precordial), RBBB morphology; associated with VF |
| Takotsubo | ST elevation mimicking LAD territory; anterior wall ballooning; reversible |
| Hypercalcemia | Shortened QT, very rarely J-point elevation |
| Hyperkalemia | ST elevation + peaked T ("pseudo-STEMI" in early hyperK) |
ST Depression - Differential
| Cause | Characteristics |
|---|---|
| Subendocardial ischemia | Horizontal or downsloping ≥ 1 mm |
| NSTEMI | Same as ischemia, with troponin rise |
| Digoxin effect | "Scoop" shape (concave down/smiley face depression) |
| LVH strain | Asymmetric ST depression in V5-V6, I, aVL |
| RBBB | Secondary ST-T changes in right precordial leads |
| Hypokalemia | ST depression + prominent U waves |
T-Wave Inversion - Differential
Normal inverted T waves in V1 (and often V2-V3 in women).
Pathologic T-wave inversions:
- Ischemia/evolving MI: V1-V4 (anterior) or II/III/aVF (inferior)
- Wellens pattern: Deep symmetric V2-V3 = proximal LAD disease
- RVH strain: V1-V3 with right axis deviation
- RBBB: Secondary T-wave inversions in V1-V2 (normal and expected)
- LBBB: Secondary T-wave inversions in I, V5-V6 (opposite to QRS, normal in LBBB)
- PE (acute cor pulmonale): T inversions V1-V4 + S1Q3T3
- CNS events (subarachnoid hemorrhage): "CVA T waves" - deep, wide, diffuse inversions, long QT
- Hypertrophic cardiomyopathy: Deep T-wave inversions (can be very dramatic, especially in apical HCM)
- Takotsubo: Deep T inversions post-event in precordial leads
- Cardiac memory: T inversions after resolution of LBBB or ventricular pacing
17. The Brugada Pattern/Syndrome
Type 1 (diagnostic): Coved ST elevation ≥ 2 mm in ≥ 1 right precordial lead (V1-V2) placed in standard or high intercostal position, with T-wave inversion. The ST is concave-up ("coved" or "saddleback-to-coved" with progression).
Type 2 and 3: "Saddleback" patterns - not diagnostic alone but warrant provocative testing with ajmaline or flecainide (sodium channel blocker).
Mechanism: SCN5A loss-of-function mutation → reduced I_Na → accentuated RV epicardial action potential notch → transmural dispersion of repolarization → VF.
Clinical: Presents with syncope or sudden cardiac death, often at rest/during febrile illness; male predominance. ICD is the only proven treatment for high-risk patients.
18. Key ECG Intervals - Normal Values Summary
| Interval | Normal Range | Clinical Significance |
|---|---|---|
| RR | 600-1000 ms (HR 60-100) | Heart rate |
| PR | 120-200 ms | AV conduction |
| PR > 200 ms | 1st-degree AVB | AV nodal disease/drugs |
| PR < 120 ms | Pre-excitation (WPW) or LGL | Accessory pathway |
| QRS | ≤ 100-110 ms | Ventricular conduction |
| QRS 110-120 ms | Incomplete BBB or IVCD | |
| QRS ≥ 120 ms | Complete BBB | |
| QTc (men) | < 450 ms | Repolarization |
| QTc (women) | < 460 ms | Repolarization |
| QTc > 500 ms | High torsades risk | Emergency management |
19. Systematic Approach to ECG Interpretation
Use this 10-step approach every time:
- Rate: Calculate atrial and ventricular rates (may differ in heart block)
- Rhythm: Regular or irregular? If irregular: regularly irregular (Wenckebach, bigeminy) or irregularly irregular (AF)?
- P waves: Present? Morphology normal? Every P followed by QRS?
- PR interval: 120-200 ms? Constant? Progressive? Missing?
- QRS duration: Normal (< 110 ms) or wide (≥ 120 ms)?
- Axis: I and aVF positive = normal; LAD or RAD?
- Hypertrophy: LVH voltage criteria? Atrial abnormalities?
- QRST morphology: Q waves (location, size)? ST elevation/depression? T-wave changes?
- QT interval: Calculate QTc; > 500 ms = danger zone
- Clinical correlation: Integrate with the patient's presentation
20. Drug Effects on the ECG
| Drug | ECG Effect |
|---|---|
| Digoxin | "Salvador Dali moustache" - downsloping ST depression (digitalis effect); shortens QT; at toxic levels: PVCs, VT, PAT with block, bradycardia, AV block |
| Amiodarone | Sinus bradycardia, prolonged PR, widened QRS, QTc prolongation (usually modest, < 50 ms), T-wave changes |
| Beta-blockers | Sinus bradycardia, prolonged PR |
| Calcium channel blockers (non-DHP) | Sinus bradycardia, prolonged PR |
| Tricyclic antidepressants | QTc prolongation, wide QRS (Na channel block), right axis shift, Brugada-like |
| Class IC agents (flecainide/propafenone) | Wide QRS ("use-dependent" Na channel block); can produce Brugada pattern; NEVER in structural heart disease |
| Sotalol/dofetilide | QTc prolongation (IKr block) → torsades risk |
| Lithium | T-wave inversions, sinus node dysfunction |
| Chloroquine/hydroxychloroquine | QTc prolongation; wide QRS at high doses |
Key Values Quick-Reference
| Parameter | Normal Value |
|---|---|
| PR interval | 120-200 ms |
| QRS duration | < 110 ms (complete BBB ≥ 120 ms) |
| QTc (men/women) | < 450 / < 460 ms |
| P-wave duration | < 120 ms |
| P-wave amplitude | < 2.5 mm |
| Normal axis | -30° to +90° |
| R-wave transition zone | V3-V4 |
| LVH (Sokolow-Lyon) | SV1 + RV5 ≥ 35 mm |
| Pathologic Q wave | ≥ 40 ms OR ≥ 25% of R amplitude |
| STEMI threshold (precordial) | ST elevation ≥ 2 mm (V1-V3) or ≥ 1 mm (other leads) |
| STEMI threshold (contiguous leads) | ≥ 2 contiguous leads |
Sources: Harrison's Principles of Internal Medicine 22E (2025) Chapter 247 - Electrocardiography by Goldberger; Braunwald's Heart Disease 12E Chapter 61 & 250; Goldberger's Clinical Electrocardiography: A Simplified Approach, 10th ed.
Now ecg
The comprehensive ECG reference was just delivered in full detail in the previous response. Here's a summary of everything that was covered:
What Was Covered in the ECG Response
Basics & Electrophysiology
- ECG signal origin - cellular action potential mapping to P-QRS-T (with Harrison's diagram showing ionic currents per region)
- ECG paper calibration (25 mm/s, 10 mm/mV)
- Heart rate calculation methods
The 12-Lead System
- All 6 limb leads and 6 precordial leads (positions, angles, what each "sees")
- Additional leads: right-sided (V3R/V4R for RV infarct), posterior (V7-V9)
Normal Waveforms and Intervals (with Harrison's waveform diagram)
- P wave, PR interval, QRS, ST segment, T wave, U wave, QT/QTc
- Normal values table; Bazett and Framingham QTc formulas
Normal Sinus Rhythm - 6 diagnostic criteria
Cardiac Axis (with hexaxial wheel diagram)
- Quick 4-quadrant method using leads I and aVF
- Causes of LAD and RAD
Ventricular Depolarization (with 2-vector diagram)
- Normal R-wave progression; transition zone V3-V4
Hypertrophy Patterns (with hypertrophy diagram)
- LVH: Sokolow-Lyon, Cornell voltage criteria; strain pattern
- RVH: dominant R in V1, RAD, RV strain
- Atrial abnormalities: P-pulmonale, P-mitrale
Bundle Branch Blocks (with RBBB/LBBB diagram)
- RBBB: rSR' in V1, wide S in I/V6
- LBBB: QS in V1, broad R in V6; Sgarbossa criteria for MI in LBBB
- LAFB and LPFB (fascicular blocks)
- Bifascicular and trifascicular block
Ischemia and Infarction
- Mechanism of ST changes (current of injury diagram)
- STEMI evolutionary sequence (hyperacute T → ST elevation → Q waves → T inversions)
- Full coronary territory localization table (anterior, inferior, lateral, posterior, RV)
- Wellens syndrome, De Winter pattern
- Pseudo-infarction patterns
QT Prolongation and Torsades
- Congenital LQTS (LQT1/2/3 - genes, T-wave morphology, triggers, treatment)
- Acquired QT prolongation drugs
- Torsades management: MgSO4, pacing, drug avoidance
Electrolyte Effects (with hyperkalemia progression diagram)
- Hyperkalemia progressive sequence + treatment
- Hypokalemia, hypocalcemia, hypercalcemia, hypothermia (Osborn J waves)
Heart Blocks
- 1st degree, Mobitz I (Wenckebach), Mobitz II, 2:1 block, 3rd degree (complete)
- AV dissociation vs complete heart block distinction
Pre-excitation / WPW
- Short PR + delta wave + wide QRS triad
- Danger of AF with WPW; never give AV nodal blockers; procainamide or cardioversion
ST-T Differential Diagnosis
- ST elevation: STEMI vs pericarditis vs early repolarization vs Brugada vs LV aneurysm vs Takotsubo
- ST depression: ischemia, digoxin, LVH strain, RBBB
- T-wave inversion: Wellens, RVH, PE (S1Q3T3), CVA T-waves, HCM, cardiac memory
Brugada Syndrome - coved vs saddleback, SCN5A, VF risk, ICD
Drug Effects Table - digoxin, amiodarone, beta-blockers, TCAs, flecainide, sotalol
10-Step Systematic Approach to reading any ECG
Normal Values Quick-Reference Table
Scroll up to find the full content with all 9 embedded diagrams from Harrison's 22E and Braunwald's Heart Disease. Let me know if you want any section expanded further or a new topic.
This is a shared conversation. Sign in to Orris to start your own chat.