
Does dka occur in type 1 diabetes
"diabetic ketoacidosis" AND "type 1 diabetes"
diabetic ketoacidosis pathophysiology diagram type 1 diabetes
![This pathophysiology diagram illustrates the systemic pathways linking Type 1 and Type 2 diabetes to secondary complications. On the left, it identifies three primary drivers: altered biochemical pathways (Polyol, Advanced Glycation End-products [AGEs], and the Renin-Angiotensin System [RAS]), inflammatory mediators (cytokines, chemokines, and IL-1̠), and oxidative stress via Reactive Oxygen Species (ROS/NADPH oxidase). These factors converge centrally, leading to metabolic and systemic derangements including hyperglycaemia, dyslipidaemia, hypertension, and insulin resistance, represented visually by a glucometer and vascular cross-section. The diagram culminates on the right with two major clinical endpoints: pancreatic islet inflammation, depicted by a cellular illustration of an islet, and diabetic retinopathy, shown via an anatomical sagittal cross-section of the human eye exhibiting microvascular abnormalities. This educational schematic is designed for an intermediate medical audience to conceptualize the unified inflammatory and metabolic mechanisms underlying diabetic microvascular and organ damage.](https://cdn.orris.care/cdss_images/pmc_clinical_VQA_3dc22389d3bcc4b3450d5a24f7f6452368d3d61e09be8ae5d5f82eabe54c10f0.jpg)
This pathophysiology diagram illustrates the systemic pathways linking Type 1 and Type 2 diabetes to secondary complications. On the left, it identifies three primary drivers: altered biochemical pathways (Polyol, Advanced Glycation End-products [AGEs], and the Renin-Angiotensin System [RAS]), inflammatory mediators (cytokines, chemokines, and IL-1̠), and oxidative stress via Reactive Oxygen Species (ROS/NADPH oxidase). These factors converge centrally, leading to metabolic and systemic derangements including hyperglycaemia, dyslipidaemia, hypertension, and insulin resistance, represented visually by a glucometer and vascular cross-section. The diagram culminates on the right with two major clinical endpoints: pancreatic islet inflammation, depicted by a cellular illustration of an islet, and diabetic retinopathy, shown via an anatomical sagittal cross-section of the human eye exhibiting microvascular abnormalities. This educational schematic is designed for an intermediate medical audience to conceptualize the unified inflammatory and metabolic mechanisms underlying diabetic microvascular and organ damage.
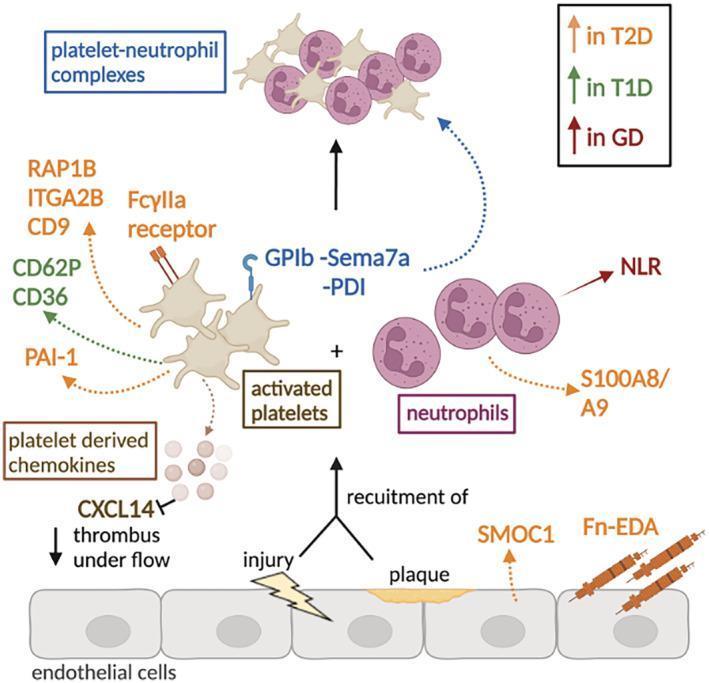
This pathophysiology diagram illustrates the cellular and molecular mechanisms of thromboinflammation associated with different types of diabetes mellitus. The diagram depicts the vascular environment following endothelial injury or atherosclerotic plaque rupture, which triggers the recruitment of platelets and neutrophils. Key pathways are color-coded by clinical context: orange for Type 2 Diabetes (T2D), green for Type 1 Diabetes (T1D), and dark red for Gestational Diabetes (GD). In T2D, there is an upregulation of Fn-EDA, SMOC1, RAP1B, ITGA2B, CD9, FcγIIa, and neutrophil S100A8/A9. In T1D, activation markers CD62P and CD36 are increased on platelets. GD is associated with an elevated neutrophil:lymphocyte ratio (NLR). The central educational focus is the formation of 'platelet-neutrophil complexes' mediated by interactions such as GPIb, Sema7a, and PDI. The diagram also shows platelet-derived chemokines, specifically noting that CXCL14 inhibition leads to decreased thrombus formation under flow. This visualization serves as a map for potential therapeutic targets to reduce thrombotic risk in diabetic patients.
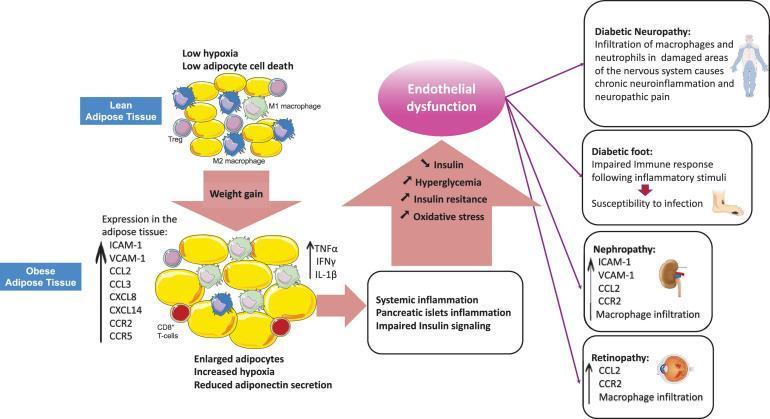
A pathophysiology diagram illustrating the progression from obesity-induced adipose tissue inflammation to Type 2 Diabetes Mellitus (T2DM) and its vascular complications. The visual compares 'Lean Adipose Tissue'—characterized by small adipocytes, low hypoxia, and anti-inflammatory M2 macrophages and Regulatory T-cells (Tregs)—with 'Obese Adipose Tissue' following weight gain. The obese state shows hypertrophied (enlarged) adipocytes, increased hypoxia, and a shift toward a pro-inflammatory environment featuring M1 macrophages, CD8+ T-cells, and elevated expression of cytokines (TNFα, IFNγ, IL-1β), chemokines (CCL2, CXCL8), and adhesion molecules (ICAM-1, VCAM-1). A central pathway illustrates how this local inflammation leads to systemic inflammation, pancreatic islet dysfunction, and impaired insulin signaling. This results in a cascade of hyperglycemia, oxidative stress, and insulin resistance, culminating in endothelial dysfunction. The right side of the diagram maps these physiological changes to specific clinical complications: Diabetic Neuropathy (macrophage/neutrophil infiltration), Diabetic Foot (impaired immune response), Nephropathy (macrophage infiltration and increased CCR2/CCL2), and Retinopathy. The illustration serves as an educational tool for understanding the immunometabolic drivers of chronic diabetic vascular damage.
Diabetic Ketoacidosis (DKA) in Type 1 Diabetes
The Short Answer
Why DKA Occurs in T1DM: Pathophysiology
- Cells cannot take up glucose - they behave as if in starvation
- Counter-regulatory hormones surge (glucagon, cortisol, catecholamines, growth hormone)
- Adipose tissue lipase is activated - free fatty acids (FFAs) flood the circulation
- The liver converts FFAs to ketone bodies - beta-hydroxybutyrate, acetoacetate, and acetone accumulate
- Hyperglycemia develops - liver converts amino acids and glycerol to glucose, which cannot be used peripherally
- Osmotic diuresis - glucose spills into urine, dragging water, sodium, potassium, magnesium, phosphorus with it
- Severe dehydration + metabolic acidosis ensues
Epidemiology in T1DM
- 13-80% of individuals with T1DM present with DKA at the time of initial diagnosis (varies widely by country and access to healthcare)
- DKA at diagnosis is more common in children under age 5 and in those with limited access to medical care
- It is the most common life-threatening acute complication of T1DM
- DKA can also recur in known T1DM patients who miss insulin doses, develop an intercurrent illness, or use insulin pumps (which are particularly susceptible to tubing failure)
Common Triggers of DKA in T1DM
| Category | Examples |
|---|---|
| Missed/inadequate insulin | Non-adherence, pump failure, dosing errors |
| Infections | Most common precipitant (urinary, respiratory) |
| New-onset T1DM | First presentation |
| Acute illness/stress | Pancreatitis, MI, stroke, burns |
| Drugs | Corticosteroids, SGLT2 inhibitors (euglycemic DKA), sympathomimetics |
| Emotional stress | Can precipitate even with ongoing insulin therapy |
Does DKA Occur in Type 2 Diabetes?
Symptoms of DKA
- Nausea, vomiting, abdominal pain
- Kussmaul breathing (deep, slow respirations to blow off CO2)
- Fruity/acetone breath odor
- Altered mental status, possible coma
- Dehydration signs (dry mucous membranes, tachycardia, hypotension)
- Elevated blood and urine ketones and glucose
- pH < 7.3, bicarbonate < 15 mmol/L
Treatment Principles
- Aggressive IV fluid resuscitation (normal saline initially)
- Insulin infusion - regular insulin ~0.1 U/kg/h IV
- Electrolyte replacement - especially potassium (critical - acidosis falsely elevates serum K+, but total body K+ is depleted)
- Close monitoring of glucose, pH, electrolytes, and mental status
- Treating the underlying precipitant