
myocardial infarction?
myocardial infarction pathology ECG diagram
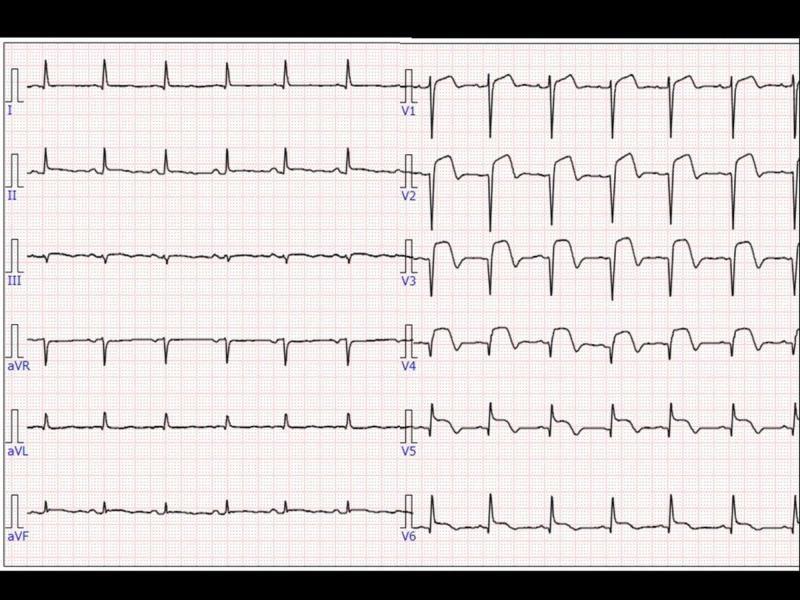
This diagnostic image is a 12-lead electrocardiogram (ECG) demonstrating significant findings of an acute myocardial infarction. The tracing is organized into standard limb leads (I, II, III, aVR, aVL, aVF) and precordial leads (V1-V6). The most prominent pathology is marked ST-segment elevation with a convex (tombstone) morphology visible across the precordial leads, specifically V1 through V6. These hyperacute T waves and significant ST elevations are most pronounced in leads V2-V4, suggesting an acute anteroseptal or extensive anterior wall myocardial infarction. The QRS complexes are narrow, and while P waves are visible, baseline drift is noted in the inferior limb leads (II, III, aVF). The ECG provides a classic clinical example of ST-elevation myocardial infarction (STEMI) pathology, serving as a critical educational tool for identifying life-threatening cardiac ischemia and interpreting precordial lead abnormalities in an emergency medicine or cardiology context.
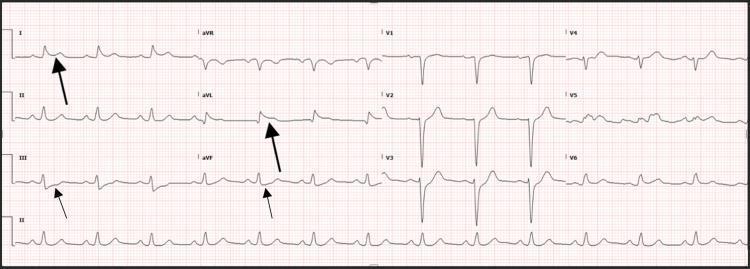
This diagnostic image is a 12-lead electrocardiogram (ECG) displayed on standard grid paper, illustrating findings characteristic of high lateral ST-segment elevation myocardial infarction (STEMI). The primary visual pathology includes significant ST-segment elevation (STE) in the high lateral leads, specifically lead I and lead aVL, marked by large black arrows. This is accompanied by prominent reciprocal ST-segment depression (STD) in the inferior leads, III and aVF, highlighted by small black arrows. The QRS complexes appear relatively narrow without evidence of pathological Q waves at this stage. The ECG serves as an educational tool for identifying early ischemic changes and reciprocal patterns in the setting of acute coronary syndrome (ACS). It is highly relevant for medical training in cardiology, emergency medicine, and critical care, demonstrating the visual cues used to diagnose arterial occlusion (such as the left anterior descending or diagonal branches) in a post-cardiac arrest clinical context.
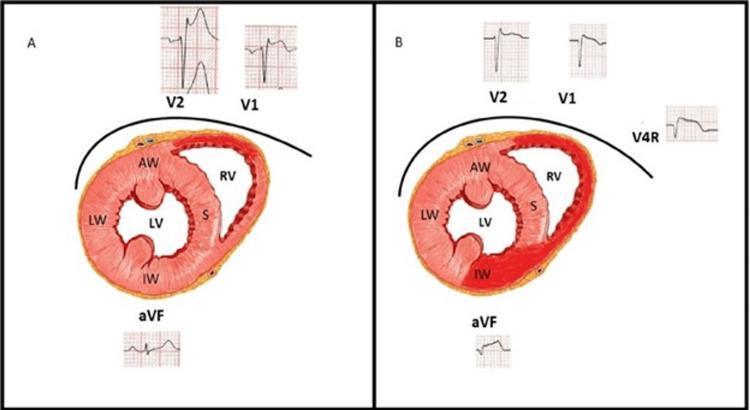
Educational comparison diagram illustrating the progression of myocardial ischemia and associated electrocardiographic (ECG) changes over time (30 vs. 90 minutes). Panel A shows a cross-sectional anatomical diagram of the heart with normal perfusion, labeled with structures including the Anterior Wall (AW), Lateral Wall (LW), Septum (S), Inferior Wall (IW), and Right Ventricle (RV). Corresponding ECG tracings for leads V1, V2, and aVF show baseline morphologies. Panel B demonstrates the progression of a transmural injury, visually indicated by dark red shading in the Inferior Wall (IW) and Right Ventricle (RV). This pathological change is correlated with dynamic ECG findings: leads V1 and V2 show a reduction in ST-elevation amplitude compared to Panel A, while lead aVF now exhibits new ST-segment elevation. Additionally, Panel B includes a right-sided lead V4R showing ST-elevation, diagnostic of right ventricular involvement. The diagram serves to teach the 'wandering' nature of ST-elevation during evolving myocardial infarction, specifically highlighting the shift from early anterior injury vectors to inferior and right ventricular manifestations.
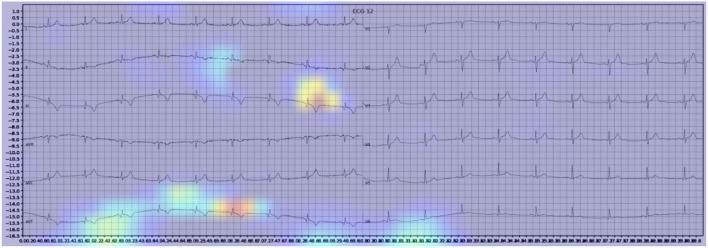
This diagnostic image displays a 12-lead electrocardiogram (ECG) showing signs of myocardial infarction (MI), overlaid with a Gradient-weighted Class Activation Mapping (Grad-CAM) heatmap. The underlying ECG traces are plotted on a standard grid, with vertical fluctuations representing cardiac electrical activity across multiple leads. Superimposed on these traces is a spectral heatmap ranging from blue (low importance) to red (high importance). The heatmap's highest intensity regions (red and yellow focal points) are localized over clinically significant ECG morphology changes, specifically the ST segments and T waves. This visualization illustrates the segments of the waveform that the machine learning model prioritized to identify the pathology. In this clinical scenario, the highlighted areas correspond to ST-segment elevation and T-wave abnormalities characteristic of acute myocardial ischemia or infarction. This comparison is used in medical education to validate artificial intelligence diagnostic reasoning against established human diagnostic criteria for cardiovascular emergencies.
"myocardial infarction"[MeSH Terms] AND "management"[MeSH Terms]
Myocardial Infarction (MI)
Definition
Epidemiology
- ~10% of MIs occur before age 40; ~45% before age 65
- Men have higher risk, but the gap narrows with age
- Post-menopausal women lose estrogenic protection; IHD is the leading cause of death in older women
- The major underlying cause is atherosclerosis of coronary arteries
Pathogenesis
Coronary Artery Occlusion Sequence
- An atheromatous plaque is eroded or ruptured by endothelial injury, intraplaque hemorrhage, or mechanical forces - exposing subendothelial collagen and necrotic plaque contents
- Platelets adhere, aggregate, and activate - releasing thromboxane A2, ADP, and serotonin, driving further aggregation and vasospasm
- Coagulation is activated via tissue factor exposure, enlarging the thrombus
- The thrombus completely occludes the lumen within minutes
Myocardial Response to Ischemia
| Time | Event |
|---|---|
| Seconds | Aerobic metabolism ceases; ATP drops; lactic acid accumulates |
| Minutes | Loss of contractility (reversible) |
| 20-40 min | Irreversible coagulative necrosis of myocytes |
-
Cardiac muscle needs ~1.3 mL O2/100g/min to survive; the normal resting LV receives ~8 mL/100g/min. Even 15-30% of normal flow can prevent death - but in the central infarct zone with near-zero collateral flow, cell death is inevitable. - Guyton & Hall Textbook of Medical Physiology
-
Subendocardial injury occurs first because the subendocardium is furthest from epicardial vessels and subjected to the highest intramural pressures during systole. The wavefront of necrosis progresses outward with prolonged ischemia.
Types of Infarction
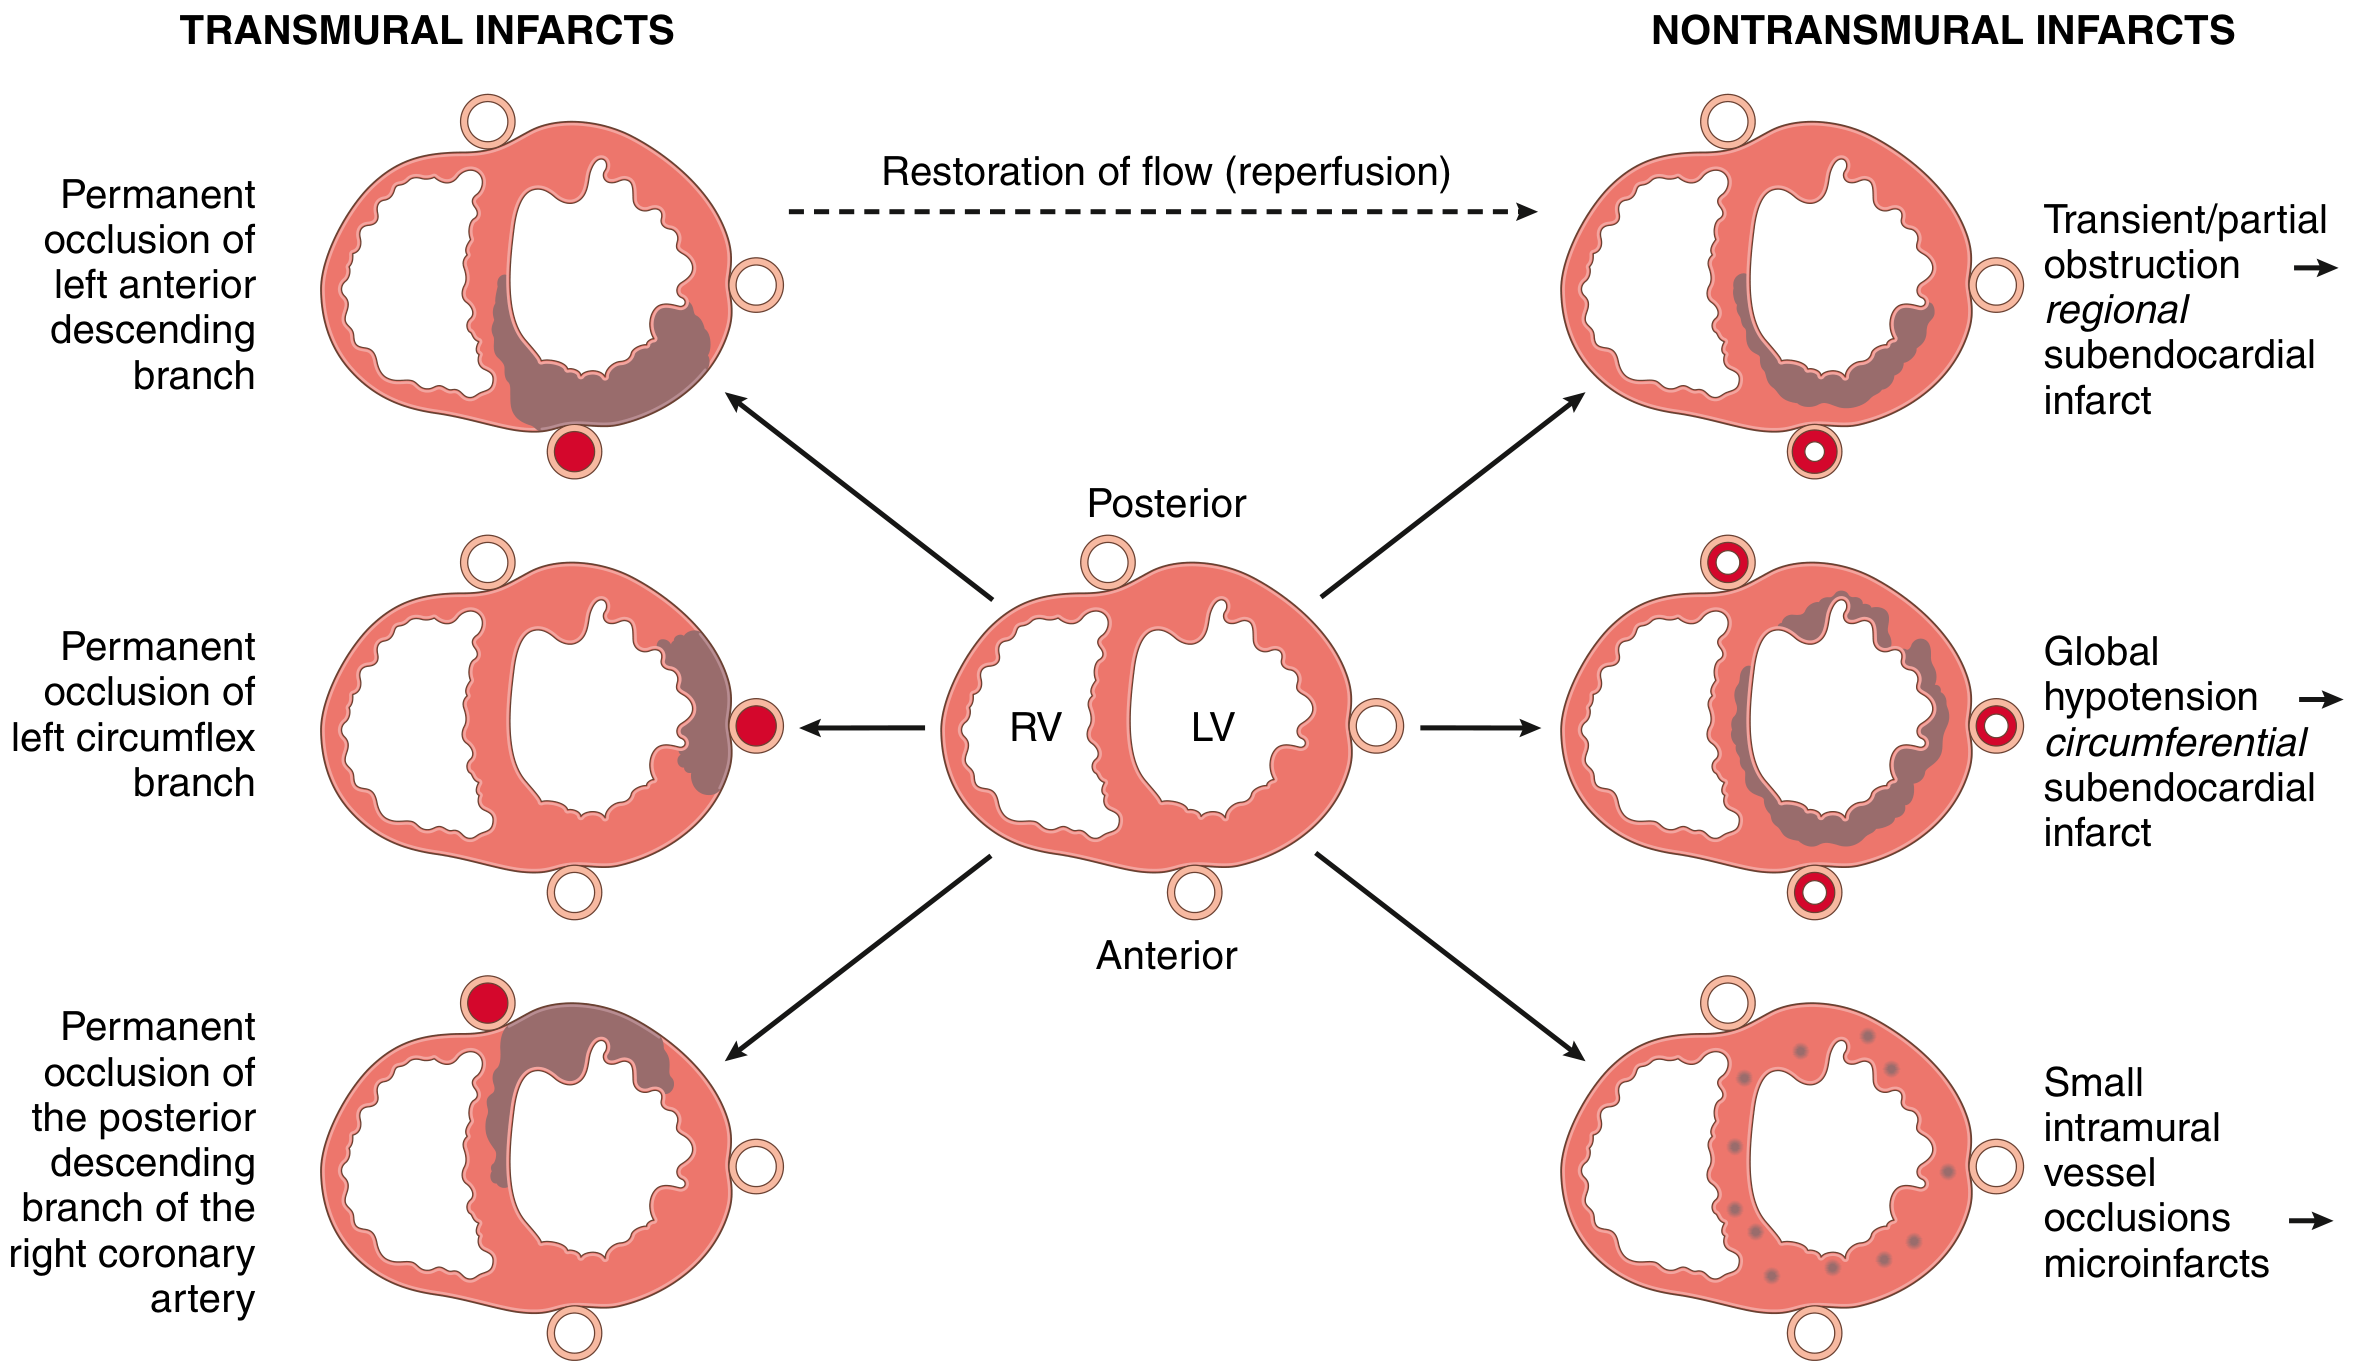
| Type | Cause | Description |
|---|---|---|
| Transmural | Complete epicardial vessel occlusion | Full-thickness LV wall; corresponds to STEMI on ECG |
| Subendocardial | Partial/transient occlusion or global hypoperfusion | Inner 1/3 of myocardium; corresponds to NSTEMI |
| Microscopic | Small vessel disease, vasculitis, emboli | No ECG changes; seen in vasculitis, cocaine use, pheochromocytoma |
- Nearly all transmural MIs affect at least part of the LV and/or interventricular septum
- 15-30% of posterior/posteroseptal MIs extend into the right ventricle
- Isolated RV infarcts are rare (1-3%)
Morphology - Timeline of Changes
| Time Frame | Gross Features | Microscopic Findings |
|---|---|---|
| 0-30 min | None | None (EM: myofibril relaxation, glycogen loss, mitochondrial swelling) |
| 30 min - 4 hr | None | Usually none; waviness of fibers at border |
| 4-12 hr | Occasionally dark mottling | Coagulation necrosis begins; edema; hemorrhage |
| 12-24 hr | Dark mottling | Coagulation necrosis; pyknotic nuclei; hypereosinophilic myocytes; contraction band necrosis; early neutrophilic infiltrate |
| 1-3 days | Mottling with yellow-tan center | Coagulation necrosis; loss of nuclei/striations; heavy neutrophil infiltrate |
| 3-7 days | Hyperemic border; yellow-tan softening | Dying neutrophils; macrophage phagocytosis at border |
| 7-10 days | Maximally yellow-tan and soft | Well-developed phagocytosis; early granulation tissue at margins |
| 10-14 days | Red-gray depressed infarct borders | Established granulation tissue with new blood vessels |
| 2-8 weeks | Gray-white scar, firm | Fibrosis progressing inward |
| >2 months | Firm, pale gray scar | Dense collagenous scar; complete healing |
Memory tip: Neutrophils (days 1-3) → Macrophages (days 3-10) → Granulation tissue (days 7-14) → Scar (weeks to months)
ECG Changes
| Defect in Infarcted Cells | Current Flow | ECG Change |
|---|---|---|
| Rapid repolarization (accelerated K+ channel opening) | Out of infarct | ST elevation |
| Decreased resting membrane potential (K+ loss) | Into infarct | TQ depression (recorded as ST elevation) |
| Delayed depolarization | Out of infarct | ST elevation |
- Acute STEMI: ST elevation in leads overlying the infarct; reciprocal ST depression on the opposite side
- After days-weeks: ST normalizes; dead tissue becomes electrically silent → Q waves develop; R-wave progression failure
- Non-Q-wave infarcts (NSTEMI): tend to be less severe but carry a high risk of reinfarction
ECG localization of STEMI:
| Territory | Leads with ST Elevation | Artery |
|---|---|---|
| Anterior/anteroseptal | V1-V4 | LAD |
| Lateral | I, aVL, V5-V6 | LCX |
| High lateral | I, aVL | Diagonal/LCX |
| Inferior | II, III, aVF | RCA (or LCX) |
| Posterior | Reciprocal changes V1-V2 | RCA/LCX |
Clinical Features
- Classic presentation: severe crushing substernal chest pain/pressure, radiating to neck, jaw, epigastrium, or left arm; lasting minutes to hours; NOT relieved by nitroglycerin or rest
- Associated symptoms: rapid/weak pulse, diaphoresis, nausea (especially posterior MIs), dyspnea (from impaired contractility and mitral valve dysfunction)
- Silent MIs (~25%): especially in diabetics (autonomic neuropathy blunts pain perception) and elderly
Cardiac Biomarkers
| Marker | Rises | Peaks | Returns to Normal | Notes |
|---|---|---|---|---|
| Myoglobin | 1-3 hr | 6-9 hr | 24 hr | Earliest, least specific |
| CK-MB | 2-4 hr | 24-48 hr | ~72 hr | Useful for re-infarction |
| Troponin I/T | 2-4 hr | 48 hr | 7-10 days | Most sensitive & specific; gold standard |
Causes of Death
- Decreased cardiac output (cardiogenic shock) - worsened by "systolic stretch" where ischemic segments paradoxically bulge outward during systole
- Pulmonary edema - from damming of blood in pulmonary vasculature (LV failure)
- Ventricular fibrillation - accounts for 80-90% of deaths in ischemic heart disease
- Cardiac rupture - rare but catastrophic; peak risk at 3-7 days (maximal softening)
Complications
| Complication | Timing | Mechanism |
|---|---|---|
| Arrhythmias | Immediate/early | Electrical irritability of ischemic myocardium |
| Cardiogenic shock | Early | Loss of >40% LV myocardium |
| Acute mitral regurgitation | Days | Papillary muscle dysfunction or rupture |
| Free wall rupture | 3-7 days | Maximal softening of necrotic tissue |
| Ventricular septal defect | 3-7 days | Septal rupture |
| Pericarditis (Dressler syndrome) | Days to weeks | Inflammatory reaction to necrotic tissue; autoimmune |
| Ventricular aneurysm | Weeks-months | Fibrous replacement of myocardium; paradoxical wall motion |
| Mural thrombus | Days-weeks | Stasis over akinetic wall segment; risk of stroke |
| Heart failure | Long-term | Loss of contractile myocardium; remodeling |
Management Principles (STEMI vs NSTEMI)
- Requires urgent reperfusion: primary percutaneous coronary intervention (PCI) is preferred within 90 minutes of first medical contact
- If PCI unavailable within 120 min: fibrinolytic therapy (e.g., alteplase, tenecteplase)
- Antiplatelet therapy: aspirin + P2Y12 inhibitor (e.g., ticagrelor or clopidogrel)
- Anticoagulation: heparin (unfractionated or LMWH)
- Risk stratify (TIMI or GRACE score)
- Antiplatelet + anticoagulation
- Early invasive strategy (angiography within 24-72 hr) for high-risk patients
- Often managed more conservatively than STEMI
- Aspirin (lifelong)
- P2Y12 inhibitor (12 months dual antiplatelet)
- Beta-blocker (reduces infarct size, antiarrhythmic)
- ACE inhibitor / ARB (especially with LV dysfunction; reduces remodeling)
- Statin (LDL reduction; plaque stabilization)
- Cardiac rehabilitation
Reperfusion Injury
- Calcium overload: influx through damaged plasma membranes → uncontrolled myofibril contraction → cell death
- Free radicals (O2−, H2O2, peroxynitrite): generated within minutes of reperfusion; damage membrane proteins and phospholipids
- "No-reflow" phenomenon: leukocyte aggregation occludes microvasculature; mediated by phospholipase A2 activation
- Contraction band necrosis: hypercontracted sarcomeres from Ca2+ influx; hallmark of reperfused infarct on histology
- Stunned myocardium: non-contractile but viable myocardium that recovers over days