
Give me content for ecg
Asking for Preferences
What kind of ECG content are you looking for? · Who is this for?
ECG interpretation is a core medical student skill. Let me pull detailed, textbook-level content on waves, intervals, and axis for you.
Searching sources...
Reading File
Finding Sources
Finding Sources
Finding Sources
Reading File
Finding Sources
Finding Sources
Excellent - I have two excellent sources: Goldman-Cecil Medicine and Harrison's. Let me read both comprehensively.
Reading File
Reading File
Good content. Let me read the continuation from both sources for axis and more interval detail.
Reading File
Reading File
Reading File
Reading File
I now have comprehensive content from Harrison's and Goldman-Cecil. Let me fetch the key ECG diagram images to include visually.
Loading Image
Loading Image
I have all the content I need. Now let me compose the full, well-structured answer.
ECG Interpretation for Medical Students
Sources: Harrison's Principles of Internal Medicine 22E; Goldman-Cecil Medicine; Braunwald's Heart Disease
1. The ECG Paper and Basic Setup
The standard ECG runs at 25 mm/s. On the graph paper:
- Each small box = 1 mm = 40 ms (0.04 s)
- Each large box (5 small boxes) = 5 mm = 200 ms (0.20 s)
- Vertically: 1 mV = 10 mm at standard calibration
Heart rate calculation:
- Divide 300 by the number of large boxes between R-R intervals (e.g., 3 large boxes = 300/3 = 100 bpm)
- Or: divide 1500 by the number of small boxes between consecutive R waves
2. The ECG Waveforms
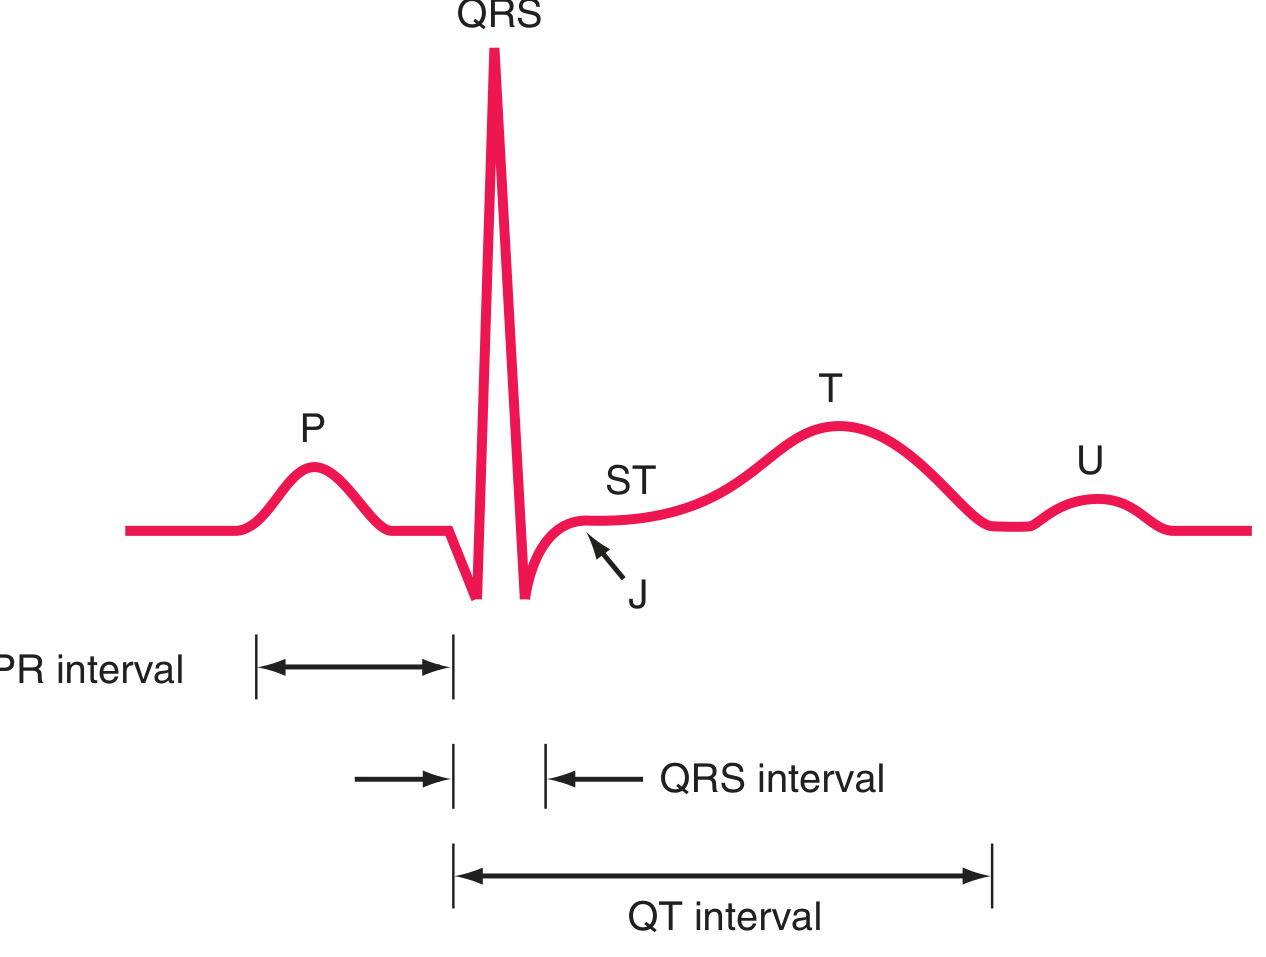
Figure: Basic ECG waveforms and intervals. (Harrison's Principles of Internal Medicine 22E)
P Wave
- Represents atrial depolarization
- Normal: upright in leads I and II, inverted in aVR
- The sinus node fires in the high right atrium; the depolarization vector moves downward-left, toward lead II (positive) and away from aVR (negative)
- In lead V1, the P wave may be biphasic - the initial positive component reflects right atrial depolarization; the terminal negative component reflects left atrial depolarization
- Normal P wave duration: <120 ms; amplitude <2.5 mm in lead II
PR Interval
- Measured from the onset of the P wave to the onset of the QRS complex
- Represents conduction through the atrial muscle, AV node, and His-Purkinje system - the AV node contributes most of the physiologic delay
- Normal: 120-200 ms (3-5 small boxes)
- PR >200 ms = first-degree AV block
- PR <120 ms = pre-excitation (e.g., WPW) or junctional rhythm
QRS Complex
- Represents ventricular depolarization
- Much larger in amplitude than P wave due to the greater ventricular muscle mass
- Terminology: the first negative deflection = Q wave; first positive deflection = R wave; negative deflection after the R wave = S wave
- Normal duration: 80-120 ms (2-3 small boxes)
- QRS >120 ms = bundle branch block or ventricular conduction delay
Normal Q waves can appear in leads I, aVL, V5, V6 (septal q waves - small, <40 ms, <25% of R wave height). A Q wave is pathological (suggesting prior infarction) when it is >40 ms wide or >25% of R wave depth in its lead.
Precordial R wave progression: The R wave increases from V1 (usually rS pattern) to V5-V6 (usually qR or qRs). The transition zone (where R = S) normally falls between V3-V4. Poor R wave progression (transition at V5 or beyond) suggests anterior MI or LVH.
J Point and ST Segment
- The J point is the junction between the end of the QRS complex and the beginning of the ST segment
- The ST segment corresponds to the plateau (phase 2) of the action potential, when the membrane is depolarized but not yet repolarizing
- Normally isoelectric (neither elevated nor depressed)
- ST elevation suggests acute injury/infarction or pericarditis
- ST depression suggests ischemia or digoxin effect
T Wave
- Represents ventricular repolarization (phase 3 of action potential)
- Normally upright in leads I, II, V3-V6; inverted in aVR; variable in V1, III, aVL
- T waves are concordant with the QRS complex (same direction as the major QRS deflection) in most leads
- Normally asymmetric: gradual upstroke, rapid downstroke
U Wave
- A small deflection following the T wave
- Most prominent in V2-V3
- Often represents repolarization of the Purkinje system or mid-myocardial (M) cells
- Prominent U waves are seen in hypokalemia and with bradycardia
- Difficulty measuring QT: do not include the U wave in the QT measurement
QT Interval
- Measured from the start of the QRS complex to the end of the T wave
- Represents total ventricular depolarization + repolarization time
- Varies with heart rate - must be corrected using Bazett's formula:
QTc = QT / √RR (all values in seconds)
- Normal QTc: ≤450 ms in men, ≤460 ms in women
- Prolonged QTc (>500 ms is high risk): predisposes to torsades de pointes VT - caused by drugs (amiodarone, quinidine, macrolides, antipsychotics), hypocalcemia, hypokalemia, hypomagnesemia, congenital long QT syndromes
- Short QTc (<320-340 ms): rare short QT syndrome; also seen in hypercalcemia, digoxin effect
3. The 12 ECG Leads
The 12 leads are divided into two groups:
Frontal Plane Leads (Limb Leads) - 6 leads
These look at the heart in the vertical plane:
| Lead | Orientation | Normal P/QRS |
|---|---|---|
| I | 0° (left arm +) | Positive |
| II | +60° | Positive (most upright P wave) |
| III | +120° | Positive or biphasic |
| aVR | -150° | Negative (away from cardiac vector) |
| aVL | -30° | Positive or small |
| aVF | +90° | Positive |
- Lead II is best for rhythm analysis (most upright P wave)
- aVR is always negative in sinus rhythm; aVR positivity suggests dextrocardia or lead reversal
Horizontal Plane Leads (Precordial/Chest Leads) - 6 leads
| Lead | Position |
|---|---|
| V1 | 4th intercostal space, right sternal border |
| V2 | 4th intercostal space, left sternal border |
| V3 | Between V2 and V4 |
| V4 | 5th intercostal space, midclavicular line |
| V5 | Anterior axillary line (same horizontal level as V4) |
| V6 | Midaxillary line (same horizontal level as V4-V5) |
Right-sided leads (V3R-V6R) can be added when right ventricular infarction is suspected.
4. The Cardiac Axis
The mean QRS axis represents the net direction of ventricular depolarization in the frontal plane.
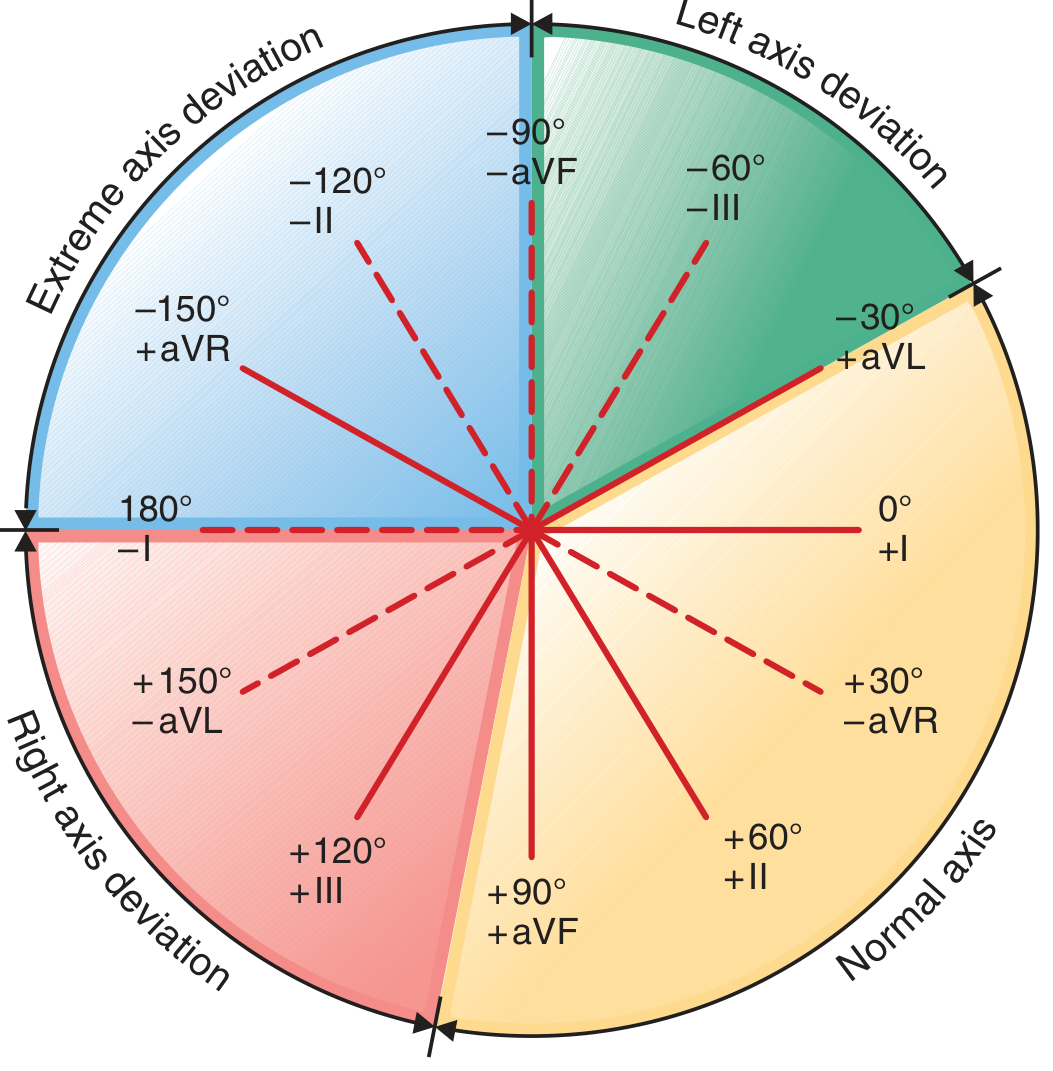
Figure: Hexaxial diagram for mean QRS axis determination. (Harrison's Principles of Internal Medicine 22E)
Normal Axis: -30° to +90°
The most useful quick method:
| Lead I | Lead aVF | Axis |
|---|---|---|
| Positive | Positive | Normal (0° to +90°) |
| Positive | Negative | Left axis deviation (-30° to -90°) |
| Negative | Positive | Right axis deviation (+90° to +180°) |
| Negative | Negative | Extreme (northwest) axis deviation (-90° to ±180°) |
Precise method: Find the lead in which the QRS complex is most isoelectric (equiphasic) - the axis is perpendicular to this lead. Then determine whether the axis is toward the positive or negative pole of that perpendicular lead.
Causes of Axis Deviation
Left axis deviation (LAD, more negative than -30°):
- Left anterior fascicular block (most common)
- Inferior MI
- LVH
- LBBB
- Wolff-Parkinson-White (right-sided pathway)
Right axis deviation (RAD, more positive than +90°):
- Right ventricular hypertrophy
- Left posterior fascicular block (diagnosis of exclusion)
- Lateral MI
- RBBB with LPFB (bifascicular block)
- Normal in children and tall thin adults
- Dextrocardia
Extreme axis deviation:
- Ventricular tachycardia
- Severe RVH
- Hyperkalemia
5. Conduction Intervals - Quick Reference Table
| Interval | Normal Range | What it measures |
|---|---|---|
| PR | 120-200 ms | AV node conduction |
| QRS | 80-120 ms | Ventricular depolarization |
| QT | Rate-dependent | Total ventricular electrical activity |
| QTc (Bazett) | ≤450 ms (men), ≤460 ms (women) | Rate-corrected repolarization |
| RR | 600-1000 ms (60-100 bpm) | Inter-beat interval |
6. A Systematic Approach to ECG Interpretation
For every ECG, work through these steps in order:
- Rate - Calculate bpm (300 ÷ large boxes between R waves)
- Rhythm - Regular or irregular? P waves present? Each P followed by QRS?
- Axis - Look at leads I and aVF
- Intervals - PR, QRS, QT/QTc
- P wave morphology - Shape, duration, axis (biphasic in V1?)
- QRS morphology - Amplitude, R wave progression, Q waves, bundle branch block?
- ST segment - Elevation or depression? Which leads?
- T wave morphology - Upright, inverted, peaked, flat?
- U wave - Present? Prominent?
- Overall interpretation - Combine all findings
7. Key Correlations: ECG Waves and Action Potentials
| ECG feature | Action potential phase | Ion current |
|---|---|---|
| QRS onset | Phase 0 (rapid depolarization) | Na+ influx |
| ST segment | Phase 2 (plateau) | Ca2+ influx balances K+ efflux |
| T wave | Phase 3 (rapid repolarization) | K+ efflux |
| QTc prolonged | Phase 2/3 prolonged | Blocked K+ channels (e.g., amiodarone, drugs) |
| QTc shortened | Phase 2/3 shortened | Hypercalcemia, digoxin |
Drugs/conditions that decrease the slope of phase 0 (by impairing Na+ influx, e.g., hyperkalemia, flecainide) widen the QRS. Drugs/conditions that prolong phase 2 or 3 (e.g., amiodarone, hypocalcemia) prolong the QT interval.
Sources: Harrison's Principles of Internal Medicine, 22nd ed., Ch. 247; Goldman-Cecil Medicine, Ch. 42; Braunwald's Heart Disease, 12th ed.
This is a shared conversation. Sign in to Orris to start your own chat.