🩺 ABG Analysis in the Emergency Ward
A Comprehensive Lecture — Professor of Emergency Medicine
"Good morning, students. Welcome to the Emergency Ward. ABG interpretation is one of the most powerful tools you have at 3 AM when your patient is deteriorating. Master this, and you will save lives. Let us begin."
📌 What Is an ABG?
An Arterial Blood Gas (ABG) is a blood test drawn from an artery (most commonly the radial artery) that simultaneously measures:
| Parameter | Normal Range | What It Tells You |
|---|
| pH | 7.35 – 7.45 | Acid-base balance |
| PaCO₂ | 35 – 45 mmHg | Ventilation (respiratory) |
| PaO₂ | 80 – 100 mmHg | Oxygenation |
| HCO₃⁻ | 22 – 26 mEq/L | Metabolic component |
| SaO₂ | 95 – 100% | Hemoglobin oxygen saturation |
| Base Excess (BE) | −2 to +2 mEq/L | Metabolic reserve |
🩸 Step 1: How to Collect an ABG
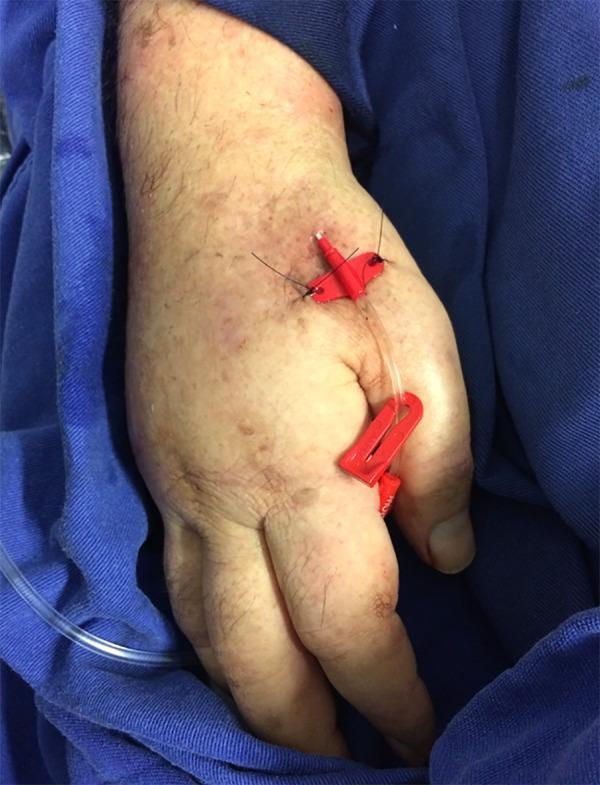
Radial Artery — The Standard Site
A 20-G arterial catheter secured in the radial artery — standard for continuous ABG and blood pressure monitoring in the ED/ICU.
Before puncture, always:
- Perform the Allen test (confirm ulnar collateral circulation)
- Hyperextend the wrist ~60° over a rolled towel
- Palpate the radial pulse, insert needle at 45°, aspirate ~1–2 mL bright red pulsatile blood
- Remove air bubbles, cap immediately — transport on ice, analyze within 15 minutes
💡 Professor's Tip: Bright red, pulsatile blood = arterial. Dark venous blood filling the syringe passively = you're in a vein. Start again.
🧭 The 5-Step Systematic Approach to ABG Interpretation
"Students, you MUST follow a systematic approach every single time. Never jump to conclusions."
STEP 1 — Look at the pH: Is the Patient Acidemic or Alkalemic?
| pH | Interpretation |
|---|
| < 7.35 | Acidosis |
| 7.35 – 7.45 | Normal |
| > 7.45 | Alkalosis |
pH < 7.2 = Life-threatening emergency. Act NOW.
STEP 2 — Identify the Primary Disorder (PaCO₂ vs HCO₃⁻)
| Primary Disorder | pH | PaCO₂ | HCO₃⁻ |
|---|
| Respiratory Acidosis | ↓ | ↑ | ↑ (compensatory) |
| Respiratory Alkalosis | ↑ | ↓ | ↓ (compensatory) |
| Metabolic Acidosis | ↓ | ↓ (compensatory) | ↓ |
| Metabolic Alkalosis | ↑ | ↑ (compensatory) | ↑ |
The rule: If PaCO₂ moves in the SAME direction as pH → it is metabolic. If PaCO₂ moves in the OPPOSITE direction → it is respiratory.
STEP 3 — Is There Appropriate Compensation?
The body never over-compensates. Calculate expected compensation:
| Primary Disorder | Expected Compensation Formula |
|---|
| Metabolic Acidosis | Expected PaCO₂ = 1.5 × HCO₃⁻ + 8 ± 2 (Winter's formula) |
| Metabolic Alkalosis | Expected PaCO₂ = 0.7 × HCO₃⁻ + 21 ± 2 |
| Acute Resp. Acidosis | HCO₃⁻ rises 1 mEq/L per 10 mmHg ↑ PaCO₂ |
| Chronic Resp. Acidosis | HCO₃⁻ rises 3.5 mEq/L per 10 mmHg ↑ PaCO₂ |
| Acute Resp. Alkalosis | HCO₃⁻ falls 2 mEq/L per 10 mmHg ↓ PaCO₂ |
| Chronic Resp. Alkalosis | HCO₃⁻ falls 5 mEq/L per 10 mmHg ↓ PaCO₂ |
💡 If PaCO₂ ≠ expected → mixed disorder is present!
STEP 4 — Calculate the Anion Gap (if Metabolic Acidosis)
$$\text{Anion Gap} = \text{Na}^+ - (\text{Cl}^- + \text{HCO}_3^-)$$
Normal AG = 8–12 mEq/L
| High AG (>12) | Normal AG (hyperchloremic) |
|---|
| Lactic acidosis | Diarrhea (GI HCO₃⁻ loss) |
| Diabetic ketoacidosis (DKA) | RTA (renal tubular acidosis) |
| Uremia (renal failure) | Saline infusion |
| Methanol / Ethylene glycol | Addison's disease |
| Salicylate toxicity | Fistulas (pancreatic/biliary) |
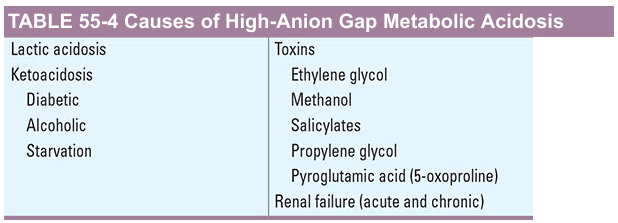
Causes of High-Anion Gap Metabolic Acidosis (Harrison's):
💡 Mnemonic — MUDPILES: Methanol, Uremia, DKA, Propylene glycol, Isoniazid/Iron, Lactic acidosis, Ethylene glycol, Salicylates
STEP 5 — Assess Oxygenation
| PaO₂ (mmHg) | Interpretation |
|---|
| 80–100 | Normal |
| 60–79 | Mild hypoxemia |
| 40–59 | Moderate hypoxemia |
| < 40 | Severe hypoxemia — critical |
Calculate A-a gradient (alveolar-arterial oxygen difference):
$$\text{PAO}_2 = [\text{FiO}2 \times (\text{P}{atm} - 47)] - \frac{\text{PaCO}_2}{0.8}$$
$$\text{A-a gradient} = \text{PAO}_2 - \text{PaO}_2$$
Normal A-a gradient = Age/4 + 4 (on room air)
| A-a Gradient | Implication |
|---|
| Normal | Hypoventilation, altitude |
| Elevated | V/Q mismatch (PE, pneumonia), shunt, diffusion defect |
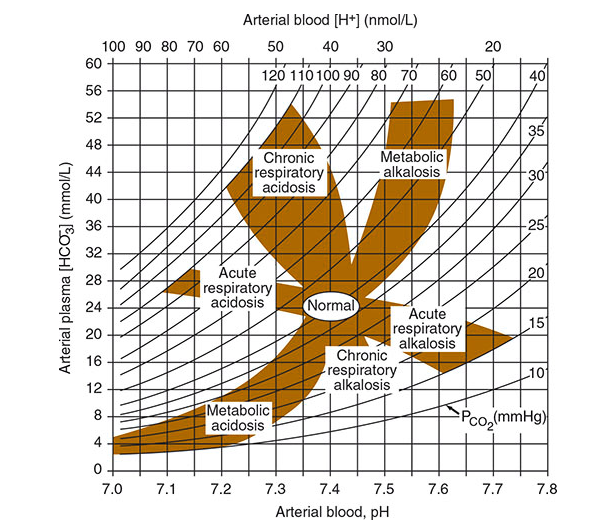
📊 The Acid-Base Nomogram
This famous nomogram from Harrison's lets you plot any ABG and immediately identify the disorder:
Plot pH (x-axis) against HCO₃⁻ (y-axis). The shaded zones represent each primary disorder and its expected compensation. Points falling BETWEEN zones suggest a mixed disorder.
🔬 The 4 Primary Acid-Base Disorders — In Depth
1. 🔴 Metabolic Acidosis
pH ↓ | HCO₃⁻ ↓ | PaCO₂ ↓ (compensatory)
Causes in the ED:
- High AG: DKA, lactic acidosis (sepsis, shock), uremia, toxic ingestions
- Normal AG: Severe diarrhea, RTA, saline excess
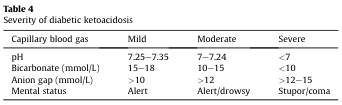
Clinical Signs: Kussmaul breathing (deep, rapid), confusion, hypotension
Emergency Examples:
DKA Severity Classification (capillary blood gas):
"When you see pH < 7.0 with AG > 15 — that patient needs ICU immediately. Do not wait."
2. 🔵 Respiratory Acidosis
pH ↓ | PaCO₂ ↑ | HCO₃⁻ ↑ (compensatory)
| Acute (hours) | Chronic (days–weeks) |
|---|
| HCO₃⁻ rises 1 per 10 mmHg ↑ CO₂ | HCO₃⁻ rises 3.5 per 10 mmHg ↑ CO₂ |
Causes in the ED:
- Opiate overdose / sedative poisoning → respiratory depression
- Acute severe asthma / COPD exacerbation
- Neuromuscular failure (Guillain-Barré, myasthenia crisis)
- Tension pneumothorax
- Laryngospasm, foreign body
Clinical Signs: Confusion, CO₂ narcosis, asterixis (flap), cyanosis, bradypnea
"PaCO₂ > 60 with pH < 7.25 → consider intubation or BiPAP. The patient is tiring out."
3. 🟡 Metabolic Alkalosis
pH ↑ | HCO₃⁻ ↑ | PaCO₂ ↑ (compensatory)
Causes in the ED:
- Vomiting / NG suction (loss of HCl)
- Diuretic use (thiazides, loop diuretics — Cl⁻ and K⁺ loss)
- Antacid excess / NaHCO₃ therapy
- Hyperaldosteronism (Conn's syndrome)
Chloride-responsive (urine Cl⁻ < 20): Vomiting, diuretics — treat with saline + KCl
Chloride-resistant (urine Cl⁻ > 20): Hyperaldosteronism — needs separate management
Clinical Signs: Muscle cramps, tetany (hypocalcemia worsened by alkalosis), cardiac arrhythmias, hypokalemia
4. 🟢 Respiratory Alkalosis
pH ↑ | PaCO₂ ↓ | HCO₃⁻ ↓ (compensatory)
Causes in the ED:
- Hypoxemia driving hyperventilation (PE, pneumonia, early sepsis)
- Anxiety / panic attack
- Liver failure (hyperammonemia stimulates breathing)
- Salicylate toxicity (early phase)
- Pregnancy
- Mechanical over-ventilation
Clinical Signs: Perioral/fingertip tingling, carpopedal spasm, dizziness, palpitations
"Respiratory alkalosis in a non-anxious patient = screen for PE, sepsis, and liver failure. Always."
🆘 Common Emergency ABG Scenarios
| Clinical Scenario | pH | PaCO₂ | HCO₃⁻ | PaO₂ | Diagnosis |
|---|
| DKA patient, deep breathing | 7.12 | 18 | 6 | 95 | Metabolic acidosis (HAGMA) |
| COPD exacerbation | 7.28 | 72 | 30 | 52 | Respiratory acidosis (acute-on-chronic) |
| Drug overdose (opiates) | 7.20 | 80 | 24 | 45 | Acute respiratory acidosis |
| Anxiety hyperventilation | 7.56 | 22 | 20 | 98 | Respiratory alkalosis |
| Severe vomiting | 7.52 | 48 | 38 | 90 | Metabolic alkalosis |
| Septic shock (early) | 7.48 | 28 | 18 | 75 | Mixed: resp. alkalosis + met. acidosis |
| Pulmonary embolism | 7.50 | 28 | 22 | 55 | Resp. alkalosis + hypoxemia |
| Salicylate OD | 7.52 | 18 | 14 | 90 | Mixed resp. alkalosis + metabolic acidosis |
⚡ Mixed Acid-Base Disorders
When compensation is more or less than expected, suspect a mixed disorder:
Example: Cardiac arrest patient
- pH 7.00 | PaCO₂ 60 | HCO₃⁻ 12
- Respiratory acidosis (↑PaCO₂) + Metabolic acidosis (↓HCO₃⁻) simultaneously
- → Double acidosis — most dangerous ABG pattern
Common mixed disorders in ED:
| Combination | Clinical Setting |
|---|
| Resp. alkalosis + Met. acidosis | Sepsis, salicylate OD, liver failure |
| Resp. acidosis + Met. alkalosis | COPD + vomiting/diuretics |
| Met. acidosis + Met. alkalosis | DKA + vomiting |
| Double acidosis (Resp + Met) | Cardiac arrest, severe septic shock |
🫁 Assessing Oxygenation — Beyond PaO₂
PaO₂/FiO₂ Ratio (P/F Ratio)
$$\text{P/F Ratio} = \frac{\text{PaO}_2}{\text{FiO}_2}$$
| P/F Ratio | ARDS Classification |
|---|
| > 400 | Normal |
| 200–300 | Mild ARDS |
| 100–200 | Moderate ARDS |
| < 100 | Severe ARDS |
A P/F ratio < 300 in a mechanically ventilated patient = acute lung injury. A P/F < 100 = severe ARDS, consider prone positioning.
The 6 Mechanisms of Hypoxemia
| Mechanism | A-a Gradient | Example |
|---|
| V/Q mismatch | Elevated | Pneumonia, PE, COPD |
| Shunt | Elevated | ARDS, pulmonary AVM, hepatopulmonary syndrome |
| Diffusion impairment | Elevated | Interstitial lung disease |
| Hypoventilation | Normal | Opiate OD, neuromuscular disease |
| Low FiO₂ | Normal | High altitude |
| Diffusion-perfusion impairment | Elevated | Hepatopulmonary syndrome |
(Source: Goldman-Cecil Medicine)
🧠 Professor's Mnemonics — Never Forget
ROME (Primary Disorders)
Respiratory Opposite (pH and PaCO₂ move opposite)
Metabolic Equal (pH and HCO₃⁻ move same direction)
MUDPILES (High AG Metabolic Acidosis)
Methanol | Uremia | DKA | Propylene glycol | Isoniazid/Iron | Lactic acidosis | Ethylene glycol | Salicylates
CLEVER PD (Normal AG Metabolic Acidosis)
Carbonic anhydrase inhibitors | Loss of HCO₃⁻ (diarrhea) | Expansion (saline) | Vertical (ureterosigmoidostomy) | Endocrine (hyperaldosteronism) | Renal tubular acidosis | Pancreatic fistula | Drugs (cholestyramine)
🗒️ Quick Reference — ABG Normal Values
pH:       7.35 – 7.45
PaCO₂:    35  – 45   mmHg
PaO₂:     80  – 100  mmHg
HCO₃⁻:   22  – 26   mEq/L
SaO₂:     95  – 100  %
BE:       −2  to +2  mEq/L
Anion Gap: 8  – 12   mEq/L
A-a gradient: < (Age/4 + 4) mmHg on room air
🏥 5-Step ABG Cheat Sheet for the Emergency Ward
1. pH → Acidosis (<7.35) or Alkalosis (>7.45)?
2. PaCO₂ / HCO₃⁻ → Respiratory or Metabolic primary?
3. Is compensation appropriate? (Use Winter's / rules)
4. If metabolic acidosis → Calculate Anion Gap → MUDPILES?
5. Oxygenation → PaO₂, A-a gradient, P/F ratio → Mechanism?
"Remember, students — the ABG doesn't give you the diagnosis. It gives you the physiology. Your job is to marry that physiology to the clinical picture. A pH of 7.10 in a DKA patient and a pH of 7.10 in a COPD patient require completely different treatments. The numbers mean nothing without the bedside."
— Your Professor, Emergency Medicine
Sources: Tintinalli's Emergency Medicine, Goldman-Cecil Medicine (26th ed.), Harrison's Principles of Internal Medicine (21st ed.), Fishman's Pulmonary Diseases and Disorders