
Coagulation cascade , methods of peri operative coagulation monitoring. Thromboelastographyand rotem . Blood products,
coagulation cascade intrinsic extrinsic pathway diagram
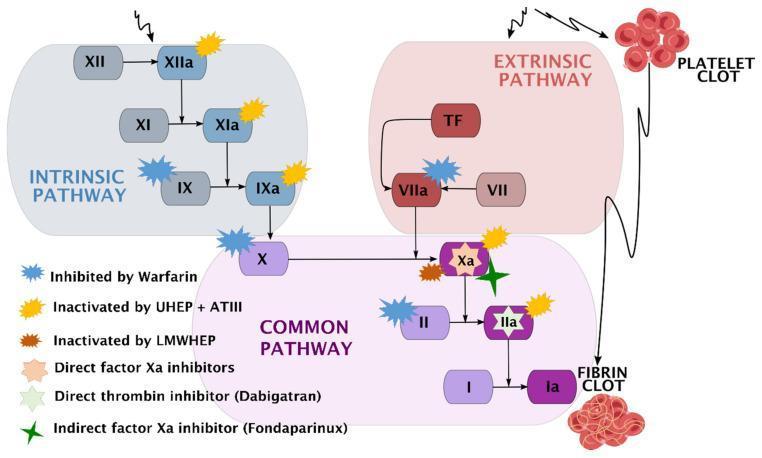
A comprehensive pathophysiology diagram illustrating the human coagulation cascade and the specific pharmacodynamic sites of action for various anticoagulants. The diagram is divided into three functional zones: the Intrinsic Pathway (blue), starting with Factor XII; the Extrinsic Pathway (red), initiated by Tissue Factor (TF) and Factor VII; and the Common Pathway (purple), where the pathways converge at Factor X. The cascade terminates in the conversion of Fibrinogen (I) to Fibrin (Ia), forming a fibrin clot. A secondary visual element depicts a platelet clot associated with the extrinsic pathway. Key clinical pharmacotherapeutic targets are marked with color-coded symbols: Warfarin inhibits Factors IX, VII, X, and II; Unfractionated Heparin (UHEP) + Antithrombin III (ATIII) inactivates Factors XIIa, XIa, IXa, Xa, and IIa; Low-Molecular-Weight Heparin (LMWHEP) and Fondaparinux target Factor Xa; Direct Factor Xa inhibitors act on Factor Xa; and Dabigatran acts as a direct thrombin inhibitor (Factor IIa). This schematic is designed for medical education regarding hemostasis and thromboprophylaxis.
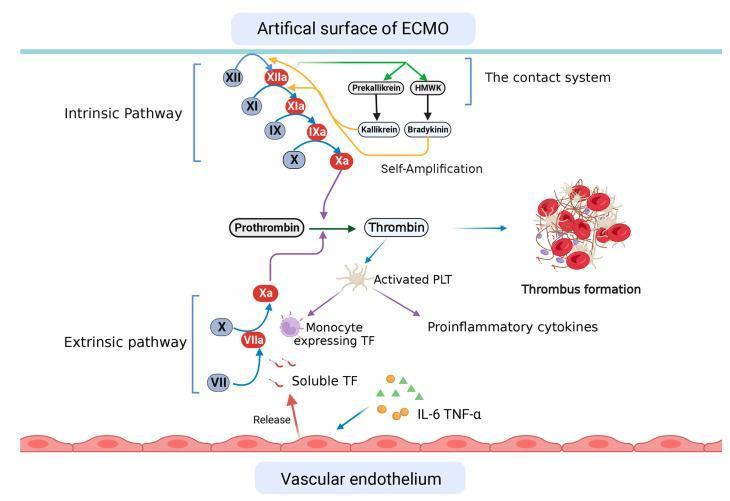
This pathophysiology diagram illustrates the dual activation of the coagulation cascade in patients undergoing Extracorporeal Membrane Oxygenation (ECMO). The diagram identifies two primary initiation mechanisms: contact with the artificial surface of the ECMO system and interactions with the vascular endothelium. The intrinsic pathway is triggered by the artificial surface, involving the contact system where Factor XII is activated to XIIa. This initiates a cascade (XIIa to XIa, XIa to IXa, and IXa to Xa) and a self-amplification loop involving Prekallikrein to Kallikrein and HMWK to Bradykinin. Concurrently, the extrinsic pathway is activated by soluble Tissue Factor (TF) released from the vascular endothelium and TF expressed on monocytes, leading to Factor VIIa activating Factor X to Xa. Both pathways converge at the common pathway, where Factor Xa converts Prothrombin to Thrombin. Thrombin subsequently leads to platelet activation (PLT), thrombus formation, and the release of proinflammatory cytokines, specifically IL-6 and TNF-α. The graphic serves as a clinical education tool for understanding the thrombotic and inflammatory risks associated with extracorporeal life support.
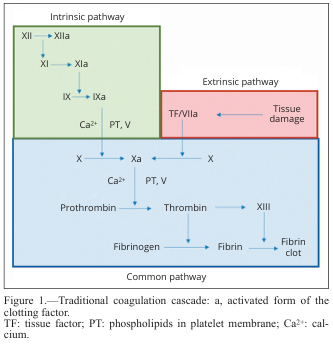
Summary : This diagram illustrates the traditional coagulation cascade, detailing the sequence of events and factors involved in blood clotting via the intrinsic, extrinsic, and common pathways. flowchart: # Pathways : • Intrinsic pathway (green box): Initiated by factor XII, proceeds through XI, IX, and VIII, with activation steps indicated by "a" (e.g., XIIa, XIa, IXa). • Extrinsic pathway (red box): Initiated by tissue damage, which activates tissue factor (TF) and factor VIIa. • Common pathway (blue box): Both intrinsic and extrinsic pathways converge at factor X, leading to the activation of prothrombin to thrombin, which then converts fibrinogen to fibrin, forming a fibrin clot. # Nodes : • XII → XIIa (Intrinsic) • XI → XIa (Intrinsic) • IX → IXa (Intrinsic) • Ca²⁺, PT, V (Intrinsic, Common) • TF/VIIa (Extrinsic) • Tissue damage (Extrinsic) • X → Xa (Common) • Prothrombin → Thrombin (Common) • Fibrinogen → Fibrin (Common) • XIII (Common) • Fibrin clot (Common) # Connectors : • Arrows indicate the direction of activation or conversion between factors. • Intrinsic and extrinsic pathways both feed into the activation of factor X in the common pathway. • Ca²⁺ and PT, V are required cofactors at specific steps. # Layout : • Three main colored sections: green (intrinsic, top left), red (extrinsic, top right), blue (common, bottom). • Flow proceeds from top (initiation) to bottom (clot formation). • Arrows show sequential activation and convergence of pathways. # Analysis : • The diagram clearly separates the intrinsic and extrinsic initiation mechanisms, both converging on the common pathway at factor X. • The cascade is highly sequential, with each activated factor catalyzing the next step. • Calcium ions (Ca²⁺) and phospholipids (PT) are essential cofactors at multiple steps. • The final outcome is the formation of a stable fibrin clot, highlighting the coordinated nature of the coagulation process.
thromboelastography TEG ROTEM trace parameters diagram
This physiological trace diagram displays multiple respiratory and gas exchange parameters recorded over approximately two minutes and forty seconds during an experimental study on inspiratory resistance. The figure is organized into six vertically stacked panels: inspiratory pressure (cmH2O), respiratory bellows (arbitrary units), carbon dioxide (%), oxygen (%), breathing rate (BPM), and breathing depth (au). Five vertical gray bars indicate periods where an external inspiratory resistance of 55 cmH2O was applied. During these resistance periods, the 'Inspiratory Pressure' trace shows significant negative deflections, reaching approximately -15 cmH2O, reflecting increased inspiratory effort. The 'Carbon Dioxide' trace reveals rhythmic oscillations corresponding to the respiratory cycle; asterisks (*) are placed above the peaks immediately following each gray period to highlight an increase in end-tidal carbon dioxide (PETCO2). The 'Oxygen' trace shows inverse oscillations to CO2. The bottom panels utilize step-graphs to track dynamic changes in breathing frequency and volume (depth). This visualization demonstrates the acute physiological and compensatory responses of the respiratory system to sudden, external mechanical loads.
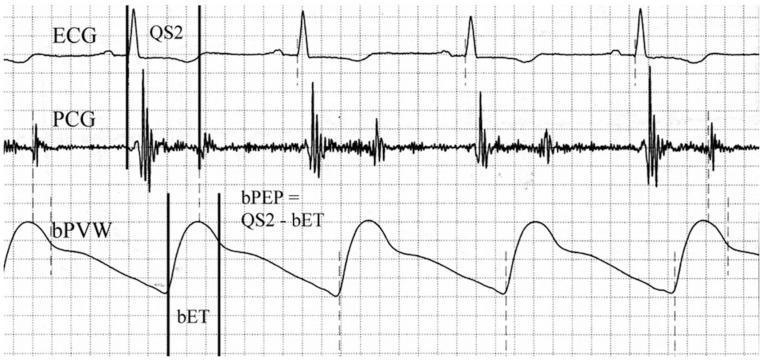
This physiological waveform diagram displays a simultaneous recording of three cardiac parameters used for assessing cardiovascular hemodynamics. The top trace is an Electrocardiogram (ECG) showing standard QRS complexes representing ventricular depolarization. The middle trace is a Phonocardiogram (PCG) capturing acoustic vibrations of heart sounds, specifically the S1 and S2 sounds. The bottom trace is a Brachial Pulse Volume Waveform (bPVW) illustrating the peripheral arterial pressure pulse. Vertical markers indicate temporal relationships between these signals to calculate systolic time intervals. The 'QS2' interval is marked from the onset of the QRS complex on the ECG to the aortic component of the second heart sound on the PCG, representing the total electromechanical systolic interval. The 'bET' (Brachial Ejection Time) is delineated on the bPVW from the waveform foot to the dicrotic notch. An annotated formula shows the calculation of the Brachial Pre-ejection Period (bPEP) as the difference between QS2 and bET (bPEP = QS2 - bET). This diagram is an educational tool for understanding the non-invasive assessment of cardiac systolic function and arterial stiffness.
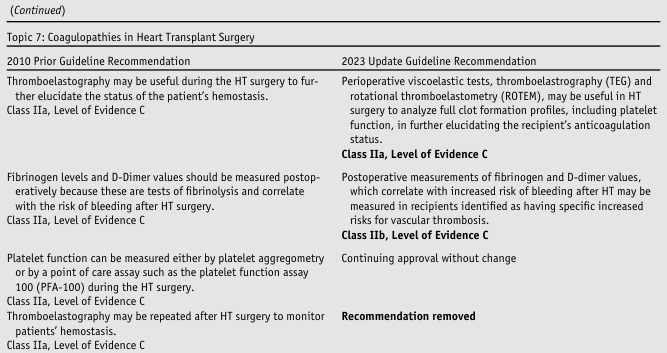
<table> <tr> <th></th> <th>2010 Prior Guideline Recommendation</th> <th>2023 Update Guideline Recommendation</th> </tr> <tr> <td>Thromboelastography may be useful during the HT surgery to further elucidate the status of the patient’s hemostasis.<br>Class IIa, Level of Evidence C</td> <td>Perioperative viscoelastic tests, thromboelastography (TEG) and rotational thromboelastometry (ROTEM), may be useful in HT surgery to analyze full clot formation profiles, including platelet function, in further elucidating the recipient’s anticoagulation status.<br><b>Class IIa, Level of Evidence C</b></td> </tr> <tr> <td>Fibrinogen levels and D-Dimer values should be measured postoperatively because these are tests of fibrinolysis and correlate with the risk of bleeding after HT surgery.<br>Class IIa, Level of Evidence C</td> <td>Postoperative measurements of fibrinogen and D-dimer values, which correlate with increased risk of bleeding after HT may be measured in recipients identified as having specific increased risks for vascular thrombosis.<br><b>Class IIb, Level of Evidence C</b></td> </tr> <tr> <td>Platelet function can be measured either by platelet aggregometry or by a point of care assay such as the platelet function assay 100 (PFA-100) during the HT surgery.<br>Class IIa, Level of Evidence C</td> <td>Continuing approval without change</td> </tr> <tr> <td>Thromboelastography may be repeated after HT surgery to monitor patients’ hemostasis.<br>Class IIa, Level of Evidence C</td> <td><b>Recommendation removed</b></td> </tr> </table>
blood products components transfusion packed red blood cells platelets FFP cryoprecipitate
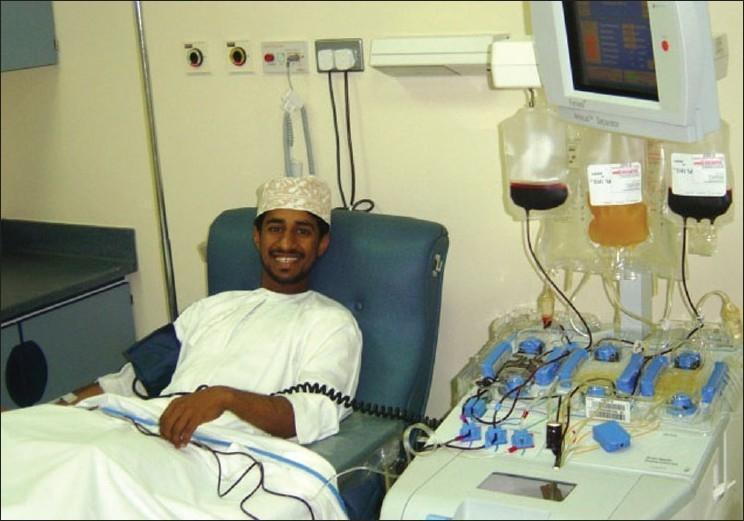
A clinical photograph depicting an apheresis procedure, specifically plateletapheresis, in a hospital or blood bank setting. A male donor is seated in a specialized blue reclining donor chair, connected to an automated blood cell separator (apheresis machine). The setup illustrates the extracorporeal circuit: blood is drawn through an intravenous line in the donor's arm, processed via a series of peristaltic pumps and a centrifugal separation chamber, and then returned. The machine features a monitoring screen and hangs several collection and infusion bags, containing red blood cells and amber-colored plasma or platelets, indicating the separation of blood components. A blood pressure cuff is visible on the donor's arm for monitoring hemodynamic stability during the procedure. This visual demonstrates the clinical application of medical technology in transfusion medicine for the collection of high-purity blood components like single-donor platelets.
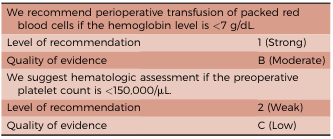
<table> <tr> <td colspan="2">We recommend perioperative transfusion of packed red blood cells if the hemoglobin level is <7 g/dL.</td> </tr> <tr> <td>Level of recommendation</td> <td>1 (Strong)</td> </tr> <tr> <td>Quality of evidence</td> <td>B (Moderate)</td> </tr> <tr> <td colspan="2">We suggest hematologic assessment if the preoperative platelet count is <150,000/μL.</td> </tr> <tr> <td>Level of recommendation</td> <td>2 (Weak)</td> </tr> <tr> <td>Quality of evidence</td> <td>C (Low)</td> </tr> </table>
Coagulation Cascade, Perioperative Coagulation Monitoring, TEG/ROTEM, and Blood Products
1. The Coagulation Cascade
Coagulation cascade - in vitro vs. in vivo
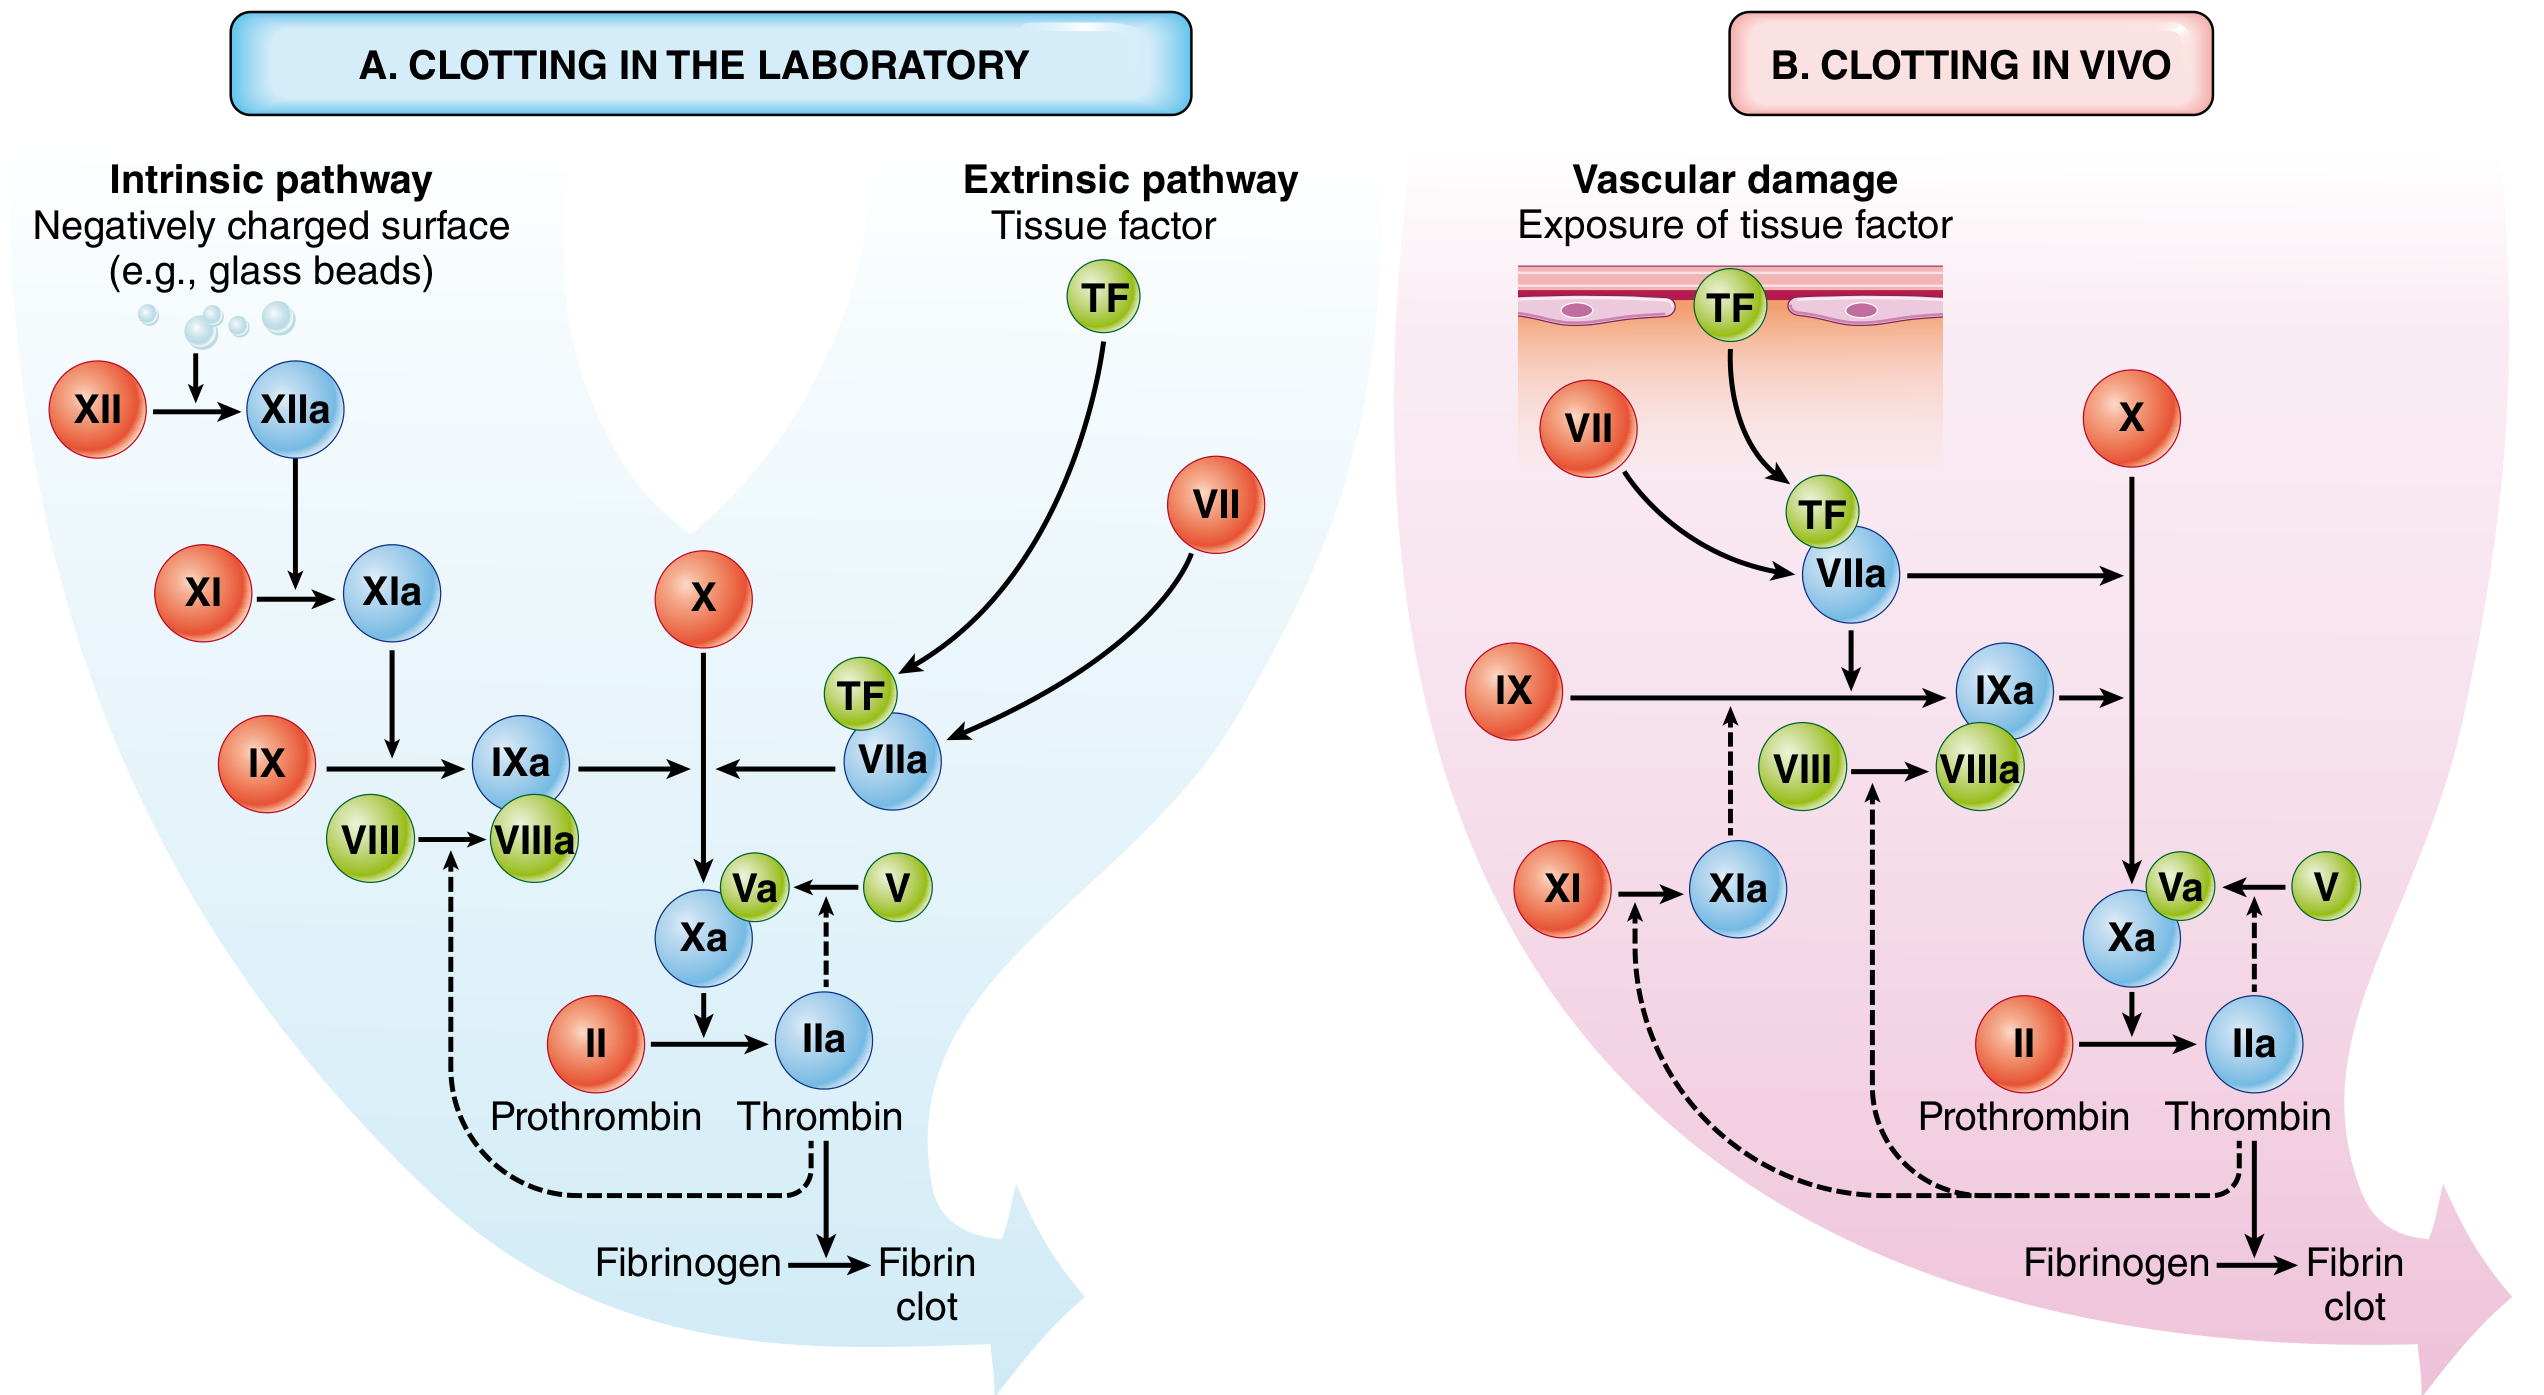
A. Intrinsic Pathway (Contact Activation)
- Initiated by contact with a negatively charged surface (collagen, glass)
- Factor XII (Hageman factor) → XIIa → XIa → IXa
- IXa forms the intrinsic tenase complex with cofactor VIIIa on phospholipid, activating X → Xa
- Assessed by aPTT (activated partial thromboplastin time)
- Factors involved: XII, XI, IX, VIII, X, V, II, fibrinogen
B. Extrinsic Pathway (Tissue Factor Pathway)
- Tissue factor (TF) is the principal in vivo trigger - constitutively expressed on cells outside the vascular lumen, exposed after injury
- TF + Factor VIIa → activates both Factor X (directly) and Factor IX (cross-activating the intrinsic pathway)
- Assessed by PT/INR (prothrombin time / international normalized ratio)
- Factors involved: VII, X, V, II, fibrinogen
C. Common Pathway
- Xa + Va (prothrombinase complex) → Prothrombin (II) → Thrombin (IIa)
- Thrombin is the central effector:
- Cleaves fibrinogen → fibrin monomers (polymerize into insoluble fibril)
- Activates Factor XIII → cross-links fibrin (stabilizes clot)
- Activates platelets via PAR-1 receptors
- Amplifies cascade by activating Factors V, VIII, XI (feedback loops)
- Proinflammatory: activates endothelium, leukocytes
- Anticoagulant: on normal endothelium, thrombin activates protein C (via thrombomodulin) → inactivates Va and VIIIa, limits clot spread
D. In Vivo Model (Cell-Based Coagulation)
E. Anticoagulant Mechanisms (Natural Regulators)
| Regulator | Mechanism |
|---|---|
| Antithrombin III | Inhibits thrombin, Xa, IXa, XIa (heparin enhances 1000x) |
| Protein C + Protein S | Thrombomodulin-activated; cleaves Va and VIIIa |
| TFPI (Tissue Factor Pathway Inhibitor) | Inhibits TF/VIIa/Xa complex |
| Plasmin (fibrinolysis) | Dissolves fibrin clot; activated by tPA from endothelium |
2. Perioperative Coagulation Monitoring
Pillar 1 - Clinical History
Pillar 2 - Standard Laboratory Tests
| Test | Pathway Assessed | Normal Range | Clinical Use |
|---|---|---|---|
| PT / INR | Extrinsic (Factors VII, X, V, II, fibrinogen) | PT 11-14 s; INR ~1.0 | Warfarin monitoring, liver disease, DIC |
| aPTT | Intrinsic (XII, XI, IX, VIII, X, V, II, fibrinogen) | 25-35 s | Heparin monitoring, haemophilia screening |
| Platelet count | Primary haemostasis | 150,000-400,000/μL | Thrombocytopenia screening |
| Fibrinogen | Final common step | 2-4 g/L | DIC, hypofibrinogenemia |
| Thrombin time | Fibrinogen → fibrin conversion | Heparin effect, dysfibrinogenemia | |
| Factor XIII | Clot cross-linking | Rare but important | |
| D-dimer | Fibrinolysis/DIC marker | DIC, DVT/PE |
Pillar 3 - Platelet Function Tests
- PFA-100 / PFA-200: Shear-stress-based test, sensitive to aspirin and von Willebrand disease; largely replaced bleeding time
- Light Transmission Aggregometry (LTA): Gold standard for platelet function disorders
- VerifyNow: Point-of-care test for antiplatelet drug monitoring (aspirin, P2Y12 inhibitors)
- Bleeding time: Antiquated; eliminated from most hospitals due to high variability and poor predictive value
Pillar 4 - Viscoelastic Monitoring (TEG/ROTEM)
3. Thromboelastography (TEG) and ROTEM
Concept
Mechanical Principle
| Device | Mechanism |
|---|---|
| TEG (Haemonetics) | Rotating cup + stationary pin; cup oscillates, clot formation transfers torque to pin |
| ROTEM (Instrumentation Laboratory) | Rotating pin + fixed cup; pin oscillates, clot formation dampens motion |
TEG/ROTEM Parameters Compared
| Parameter | TEG | ROTEM | Meaning | Prolonged by |
|---|---|---|---|---|
| Clot initiation time | R (Reaction time) | CT (Clotting Time) | Time to first fibrin formation | Anticoagulants, factor deficiency |
| Clot formation rate | K time | CFT (Clot Formation Time) | Time from initiation to 20mm amplitude | Thrombocytopenia, hypofibrinogenemia |
| Clot kinetics | α angle | α angle | Speed of clot strengthening | Low fibrinogen, factor deficiency |
| Clot strength | MA (Maximum Amplitude) | MCF (Maximum Clot Firmness) | Maximal clot mechanical strength; reflects platelet-fibrin interaction | Thrombocytopenia, fibrinogen deficiency |
| Fibrinolysis | LY30 (% lysis at 30 min) | LI30 (Lysis Index at 30 min) | Degree of clot breakdown | Hyperfibrinolysis (DIC, liver failure, trauma) |
ROTEM-Specific Assays
| Assay | Activator | What it Measures |
|---|---|---|
| EXTEM | Tissue factor | Extrinsic pathway + platelets + fibrinogen |
| INTEM | Contact activator | Intrinsic pathway; sensitive to heparin |
| FIBTEM | TF + cytochalasin D (platelet inhibitor) | Fibrinogen contribution to clot strength only |
| HEPTEM | INTEM + heparinase | Detects heparin effect (compare with INTEM) |
| APTEM | EXTEM + aprotinin (antifibrinolytic) | Confirms hyperfibrinolysis when EXTEM lysis present |
Clinical Applications of TEG/ROTEM
- Trauma-induced coagulopathy (TIC): TEG/ROTEM are better validated than PT/INR for trauma; viscoelastic monitoring detects hyperfibrinolysis which standard tests miss. Can distinguish coagulopathic from surgical bleeding rapidly.
- Cardiac surgery: Guides blood product use post-bypass; reduces unnecessary FFP/platelet transfusions; several single-centre studies show reduction in transfusion requirements and ICU days.
- Liver transplantation: Detects hyperfibrinolysis post-reperfusion; guides targeted therapy with fibrinogen concentrate, PCC, antifibrinolytics.
- Major obstetric haemorrhage: Early detection of fibrinogen depletion.
- Massive transfusion protocols: Enables goal-directed resuscitation rather than empirical fixed-ratio products.
4. Blood Products
A. Red Blood Cells (pRBCs)
- Volume: ~300 mL per unit
- Storage: 1-6°C; up to 42 days with additive solution (AS-1, AS-3, AS-5)
- Contains: RBCs + additive solution; minimal plasma and platelets
- Transfusion trigger: Hb <7 g/dL (restrictive threshold; strong recommendation, moderate evidence). Hb <8 g/dL in cardiac surgery or symptomatic anaemia.
- Effect: Each unit raises Hb ~1 g/dL, haematocrit ~3%
- Risks: TRALI, TACO, alloimmunization, febrile/allergic reactions, infection
B. Platelets
- Whole-blood derived: 50 mL/bag; pool 4-6 bags for adult dose
- Apheresis (single-donor): 300 mL; equivalent to 4-6 pooled units
- Storage: 20-24°C with agitation for 5 days (highest infection risk of all components due to room-temperature storage)
- Transfusion trigger:
- Bleeding patient: <50,000/μL (surgery), <100,000/μL (neurosurgery)
- Prophylactic: <10,000/μL
- Effect: Each apheresis unit raises count ~30,000-60,000/μL
C. Fresh Frozen Plasma (FFP)
- Volume: ~250 mL
- Storage: Frozen at <-18°C for 1 year; <-65°C for 7 years. Must be frozen within 6 hours of collection to be labeled FFP.
- Contains: All clotting factors (I, II, V, VII, VIII, IX, X, XI), fibrinogen, natural anticoagulants (protein C, S, AT)
- Dose: 10-15 mL/kg (typically 2-4 units)
- Indications: Multiple factor deficiencies, warfarin reversal (urgent), DIC, massive transfusion, TTP (therapeutic plasma exchange)
- Limitation: Low factor concentration; large volumes needed; risk of TACO, TRALI
D. Cryoprecipitate
- Preparation: Produced from barely-thawed FFP; precipitate collected by centrifugation and refrozen
- Volume: ~15 mL per bag; adult dose = 4-6 bags (one pool)
- Contents (concentrated):
- Fibrinogen (Factor I) - highest concentration (~250 mg/bag)
- Factor VIII
- von Willebrand factor (vWF)
- Factor XIII
- Fibronectin
- Indications: Hypofibrinogenemia (<1.5 g/L), haemophilia A (if factor VIII concentrate unavailable), von Willebrand disease, Factor XIII deficiency, DIC with low fibrinogen
- Storage: <-18°C for 1 year
E. Fibrinogen Concentrate
- Purified lyophilized fibrinogen; reconstituted immediately before use
- Advantage: No ABO compatibility required, small volume, precise dosing, viral-inactivated
- Used increasingly over cryoprecipitate in major haemorrhage
F. Prothrombin Complex Concentrate (PCC)
- 3-factor PCC: Factors II, IX, X
- 4-factor PCC: Factors II, VII, IX, X + Proteins C and S
- Indications: Emergency reversal of warfarin, vitamin K deficiency, major haemorrhage
- Advantage over FFP: Small volume, rapid administration, no thawing delay
G. Blood Component Storage Summary
| Component | Temperature | Duration |
|---|---|---|
| pRBCs | 1-6°C | 21-42 days |
| Frozen RBCs | <-65°C | 10 years |
| Platelets (WB-derived or apheresis) | 20-24°C with agitation | 5 days |
| FFP | <-18°C | 1 year |
| Cryoprecipitate | <-18°C | 1 year |
H. Risks of Transfusion
| Complication | Mechanism |
|---|---|
| TRALI (Transfusion-Related Acute Lung Injury) | Antibody-mediated neutrophil activation in pulmonary capillaries; most common cause of transfusion-related death |
| TACO (Transfusion-Associated Circulatory Overload) | Volume overload; especially risk in elderly/cardiac patients |
| Febrile non-haemolytic | Cytokines from stored leukocytes |
| Acute haemolytic | ABO incompatibility (clerical error); most dangerous |
| Delayed haemolytic | Alloantibody formation |
| Transfusion-associated GVHD | Viable T lymphocytes in immunocompromised host |
| Allergic/anaphylactic | Anti-IgA in IgA-deficient patients |
I. Patient Blood Management (PBM)
- Preoperative anaemia optimization: Iron supplementation, ESA if iron-deficient; target Hb before elective surgery
- Autologous transfusion: Pre-operative autologous donation, intraoperative cell salvage (contraindicated in malignancy, infection)
- Restrictive transfusion thresholds: Hb <7 g/dL for most surgical patients
- Haemostatic drugs: Tranexamic acid (antifibrinolytic - blocks plasminogen binding to fibrin), aprotinin (serine protease inhibitor), desmopressin (DDAVP - releases vWF from endothelium)
Quick Reference: Coagulation Tests and Pathways
| Scenario | PT/INR | aPTT | Platelets | TEG/ROTEM Finding | Likely Cause |
|---|---|---|---|---|---|
| On warfarin | ↑ | Normal | Normal | Prolonged R/CT | Factor VII (extrinsic) depletion |
| On heparin | Normal | ↑ | Normal | Prolonged R/CT (INTEM) | AT-mediated factor inhibition |
| DIC | ↑ | ↑ | ↓ | Prolonged R, low MA, high LY30 | Consumption + fibrinolysis |
| Haemophilia A/B | Normal | ↑ | Normal | Prolonged R/CT | Intrinsic factor deficiency |
| Thrombocytopenia | Normal | Normal | ↓ | Low MA/MCF | Platelet depletion |
| Hypofibrinogenemia | ↑ | ↑ | Normal | Low FIBTEM MCF | Low fibrinogen |