
normal ECG waves P QRS T intervals leads diagram
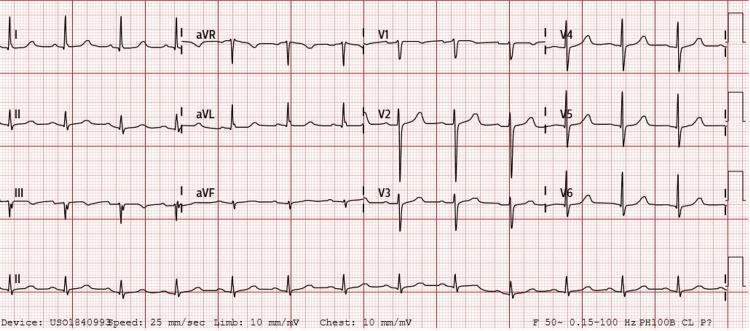
A standard 12-lead electrocardiogram (ECG) displayed on a red grid background, demonstrating normal sinus rhythm at a rate of approximately 70 beats per minute. The tracing includes limb leads (I, II, III), augmented limb leads (aVR, aVL, aVF), precordial leads (V1-V6), and a continuous rhythm strip of lead II at the bottom. The QRS complexes exhibit normal duration and morphology without pathological widening. P waves are identifiable before each QRS complex, indicating atrial depolarization originating from the sinoatrial node. T waves are upright in leads I, II, aVF, and V2-V6, and appropriately inverted in lead aVR. There is a lack of acute ST-segment elevation or depression. The R-R intervals are regular, reflecting a stable cardiac rhythm. This tracing represents the resolution of previously identified junctional bradycardia following the treatment of hyperkalemia. The technical parameters are visible at the bottom, indicating a standard paper speed of 25 mm/sec and voltage calibration of 10 mm/mV.
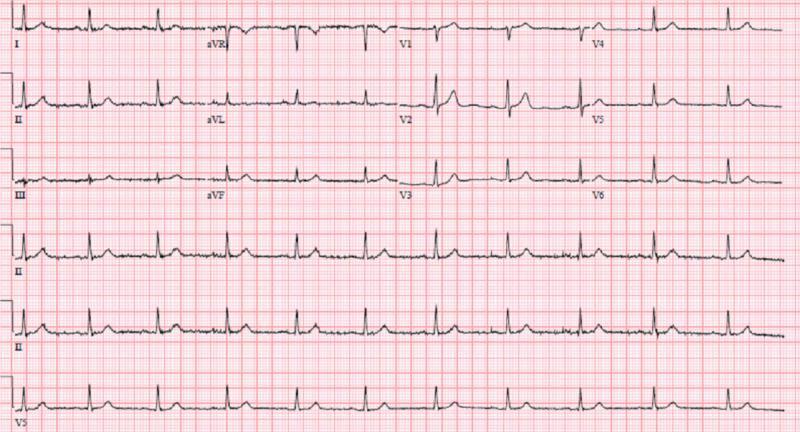
A standard 12-lead electrocardiogram (ECG) displayed on a traditional red grid background. The tracing shows a normal sinus rhythm with a regular rate and consistent R-R intervals. P waves are clearly visible preceding each QRS complex in the limb and precordial leads. The QRS complexes are of normal duration and morphology, with a standard R-wave progression observed from V1 through V6. The ST segments appear isoelectric without clear evidence of acute ST-elevation or depression in any lead. T waves are upright in most leads, with the exception of lead V1 and aVR, where inversion is a normal variant. This ECG represents a clinically stable cardiac state at the time of presentation, despite the patient's underlying severe coronary artery disease (CAD), including significant stenosis of the left anterior descending and left circumflex arteries. The absence of acute ischemic changes or pathological Q waves highlights that baseline ECGs can remain unremarkable even in the presence of severe structural heart disease.
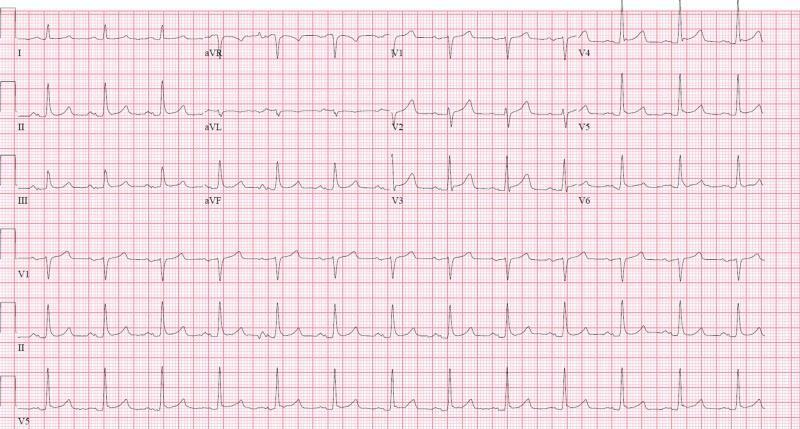
A standard 12-lead electrocardiogram (ECG) displayed on a traditional pink grid background. The tracing demonstrates a normal sinus rhythm characterized by a regular ventricular rate and consistent R-R intervals. Distinct P waves precede every QRS complex, particularly visible as upright deflections in leads II, III, aVF, and V2 through V6. The QRS complexes exhibit normal morphology and duration without evidence of widening or bundle branch blocks. The ST segments are isoelectric throughout all limb and precordial leads, indicating an absence of acute ST-elevation myocardial infarction (STEMI) or significant ST-depression suggestive of ischemia. T waves are generally upright and symmetrical across the precordium. The tracing includes a rhythm strip at the bottom (leads V1, II, and V5) for continuous assessment of the cardiac cycle. This diagnostic image represents a baseline cardiac evaluation for a patient presenting with syncope and hypovolemic shock, providing a clinical comparison for later episodes of potential coronary vasospasm.
oxygen hemoglobin dissociation curve sigmoid shape
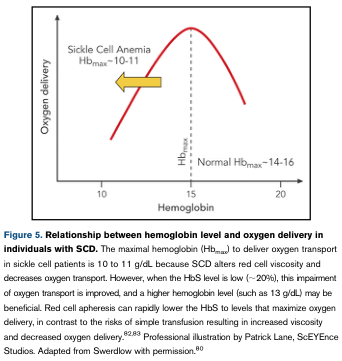
Summary : This figure illustrates the relationship between hemoglobin (Hb) level and oxygen delivery in individuals with sickle cell disease (SCD), highlighting the optimal Hb range for oxygen transport in SCD compared to normal individuals. line plot: # Title & Axes : • No explicit title on the plot, but the context is "Relationship between hemoglobin level and oxygen delivery in individuals with SCD." • X-axis: "Hemoglobin" (units not specified, but contextually g/dL). • Y-axis: "Oxygen delivery" (units not specified). • X-axis tick labels: 10, 15, 20. • Y-axis: No tick labels, only qualitative trend. # Data Points & Series : • Single red curve showing oxygen delivery as a function of hemoglobin level. • The curve rises from Hb = 10, peaks near Hb = 14–16, then declines toward Hb = 20. • Arrow and annotation for "Sickle Cell Anemia Hb_max ~10–11" indicating the optimal Hb range for SCD. • Dashed vertical line at "Normal Hb_max ~14–16" indicating the optimal Hb range for normal individuals. # Design Encodings : • Red solid line for the main curve. • Yellow arrow highlighting the SCD optimal Hb range. • Dashed vertical line for normal Hb_max. • Text annotations for "Sickle Cell Anemia Hb_max ~10–11" and "Normal Hb_max ~14–16". # Distribution & Trends : • The curve is unimodal, peaking at intermediate Hb levels. • Oxygen delivery increases with Hb up to a point, then decreases at higher Hb levels. • The optimal Hb for SCD is lower (~10–11 g/dL) than for normal individuals (~14–16 g/dL). # Analysis : • The figure visually demonstrates that the maximal oxygen delivery in SCD occurs at a lower hemoglobin level than in normal individuals, due to altered red cell viscosity and oxygen transport in SCD. • Increasing Hb above the SCD optimal range may decrease oxygen delivery, while lowering Hb to the optimal range can improve oxygen transport. • The curve supports clinical recommendations for transfusion targets in SCD patients to avoid excessive Hb levels that could impair oxygen delivery.
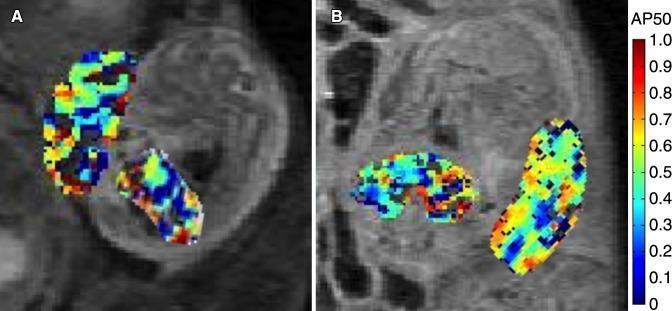
This diagnostic image set displays two functional MR images (A and B) showing maternal-fetal units in a mouse model at embryonic days 14.5 and 17.5. The images feature overlaid color-coded AP50 maps, which represent fetal and placental oxygen-hemoglobin dissociation parameters. In both panels, the placenta and fetal liver are isolated as regions of interest. A vertical color bar on the right side indicates AP50 values scaled from 0 to 1.0, with cool colors (dark blue) representing lower values and warm colors (red/orange) representing higher values. Panel A (day 14.5) demonstrates a heterogeneous distribution of oxygenation parameters within the tissues, showing a mix of green, yellow, and blue pixels. Panel B (day 17.5) illustrates the progression of these physiological markers over time, with the placental AP50 values showing a significant spatial shift toward warmer colors, reflecting changes in oxygen transfer efficiency. These maps provide a non-invasive visual method for studying fetal oxygenation and placental function during gestation.
KIMS - Department of Physiology | Paper 1 - Third Internal Assessment
Complete Answer Guide
LONG ESSAY (10 marks)
Q1. Describe the leads, waves and intervals of normal ECG. Mention the ECG changes in cardiac infarction.
A. LEADS OF ECG (12 leads total)
- Lead I: Right arm (-) to Left arm (+)
- Lead II: Right arm (-) to Left leg (+)
- Lead III: Left arm (-) to Left leg (+)
- aVR: Right arm
- aVL: Left arm
- aVF: Left foot
- V1: 4th intercostal space, right sternal border
- V2: 4th intercostal space, left sternal border
- V3: Between V2 and V4
- V4: 5th intercostal space, mid-clavicular line
- V5: Anterior axillary line (same horizontal level as V4)
- V6: Mid-axillary line (same horizontal level as V4-V5)
B. WAVES OF NORMAL ECG
| Wave | Origin | Duration | Amplitude |
|---|---|---|---|
| P wave | Atrial depolarization (SA node → atria) | 0.08-0.1 s | <2.5 mm |
| QRS complex | Ventricular depolarization | 0.06-0.10 s | Variable |
| T wave | Ventricular repolarization | 0.16-0.27 s | Upright in most leads |
| U wave | Purkinje fiber repolarization (not always seen) | - | Small, after T |
- Q wave: First downward deflection (septal depolarization)
- R wave: First upward deflection
- S wave: Downward deflection after R
C. INTERVALS AND SEGMENTS
| Interval/Segment | Normal Duration | Significance |
|---|---|---|
| PR interval | 0.12 - 0.20 s | AV conduction time |
| QRS duration | 0.06 - 0.10 s | Ventricular depolarization |
| QT interval | 0.35 - 0.44 s | Ventricular depolarization + repolarization |
| ST segment | Isoelectric | Plateau phase of ventricular AP |
| PR segment | Isoelectric | AV nodal delay |
D. ECG CHANGES IN MYOCARDIAL INFARCTION
- Tall, peaked (hyperacute) T waves - earliest change
- ST segment elevation (> 1 mm in limb leads, > 2 mm in chest leads)
- ST elevation (STEMI pattern - "tombstone" or convex upward)
- Development of pathological Q waves (>0.04 s duration, >25% of R wave height)
- T wave inversion begins
- Pathological Q waves persist
- ST returns toward baseline
- Deep, symmetric T wave inversion (Wellens' sign pattern)
- Persistent pathological Q waves (permanent scar)
- ST normalizes
- T waves may normalize or remain inverted
| Territory | Leads showing changes | Artery |
|---|---|---|
| Anterior | V1-V4 | LAD |
| Lateral | I, aVL, V5-V6 | LCx |
| Inferior | II, III, aVF | RCA |
| Posterior | Tall R in V1-V2 (reciprocal) | RCA/LCx |
SHORT ANSWERS (3 marks each)
Q2. Explain why normally blood does not clot in vivo.
- Smoothness of vascular endothelium: Intact endothelium does not activate factor XII (Hageman factor) - no trigger for intrinsic pathway.
- Prostacyclin (PGI2): Released by endothelial cells; inhibits platelet aggregation and promotes vasodilation.
- Antithrombin III (heparin cofactor): Neutralizes thrombin and several other activated clotting factors (Xa, IXa, XIa).
- Thrombomodulin: Endothelial protein that binds thrombin; the complex activates Protein C.
- Protein C and Protein S: Together inactivate Factor Va and Factor VIIIa.
- Tissue Factor Pathway Inhibitor (TFPI): Inhibits the extrinsic pathway (Factor VIIa-tissue factor complex).
- Natural heparin: Released by mast cells and basophils; enhances antithrombin III activity.
- Fibrinolytic system (plasmin): Dissolves any small clots that form.
- Blood flow: Continuously dilutes and removes activated clotting factors.
Q3. Explain why cardiac muscle cannot be tetanised.
- The cardiac action potential lasts approximately 200-400 ms (compared to 1-2 ms in skeletal muscle).
- The absolute refractory period (ARP) of cardiac muscle lasts almost as long as the action potential itself - about 200-250 ms.
- This is due to the prolonged plateau phase (Phase 2) maintained by slow L-type Ca²+ channels remaining open.
- In skeletal muscle, the action potential is very short (1-2 ms), and tetanic contractions occur when stimuli arrive before relaxation is complete.
- In cardiac muscle, no new action potential can be generated during the absolute refractory period - so no second stimulus can cause sustained contraction during the contraction phase.
- By the time the ARP ends and the muscle is capable of responding again, the contraction is almost over and relaxation has begun.
Q4. Why is the stool bulky and pale colored in obstructive jaundice?
- Bile salts and bilirubin cannot enter the small intestine.
- Normally, bilirubin is converted to urobilinogen (and then to stercobilin) by gut bacteria - stercobilin gives stool its normal brown color.
- In obstruction, no bilirubin reaches the gut, so no stercobilin is formed.
- Result: pale, clay-colored (acholic) stools.
- Bile salts are essential for fat emulsification and absorption in the small intestine.
- Without bile, dietary fats cannot be emulsified and are not absorbed by intestinal microvilli.
- Unabsorbed fats (especially long-chain triglycerides) pass into the stool.
- Fat in stool = steatorrhea - stool is pale, bulky, greasy, malodorous, and floats.
Q5. Explain the cause for sigmoid shape of the Oxygen-Hemoglobin Dissociation Curve.
- Hb is a tetramer with 4 subunits (2α + 2β), each carrying one heme group.
- In the deoxy state (T form / tense form), the structure is tightly folded with low O2 affinity.
- When the first O2 molecule binds to one heme group, it causes a conformational change in the globin subunit.
- This change is transmitted to neighboring subunits via the 2,3-BPG binding site and salt bridges.
- The molecule shifts from T-form (tense, low affinity) → R-form (relaxed, high affinity).
- Each successive O2 molecule binds with increasing affinity (positive cooperativity).
- The 4th O2 binds with the highest affinity.
- At low PO2 (tissues): Hb has low affinity → readily releases O2 (flat lower portion)
- At high PO2 (lungs): Hb has very high affinity → readily loads O2 (upper flat plateau)
- The steep middle portion allows efficient O2 delivery over a small PO2 range (20-60 mmHg)
Q6. Explain the cause of negative resting membrane potential.
- K+ is ~30x more concentrated inside the cell (140 mEq/L inside vs. 4 mEq/L outside).
- Na+ is ~10x more concentrated outside (145 mEq/L outside vs. 10 mEq/L inside).
- Large organic anions (proteins, phosphates) are trapped inside and cannot cross the membrane.
- At rest, the membrane is highly permeable to K+ (via leak channels) and nearly impermeable to Na+.
- K+ flows out down its concentration gradient, leaving behind negative charges (organic anions) inside.
- This outward K+ current makes the inside more negative.
- K+ continues to leave until the electrical force (pulling K+ back in) equals the chemical force (driving K+ out) = K+ equilibrium potential (~-90 mV, Nernst equation).
- Pumps 3 Na+ out and 2 K+ in per cycle (electrogenic).
- Directly contributes about -5 to -10 mV to the RMP.
- More importantly, it maintains the ion concentration gradients.
- Impermeant intracellular anions attract cations inside and repel anions, contributing to the negative interior.
SHORT ESSAY (5 marks each)
Q7. Explain the complications of blood transfusion.
| Complication | Mechanism |
|---|---|
| Acute hemolytic reaction | ABO incompatibility - antibodies in recipient destroy donor RBCs; fever, chills, back pain, hemoglobinuria, renal failure, DIC |
| Febrile non-hemolytic reaction | Antibodies against donor leukocytes/platelets; most common; fever, chills |
| Allergic/Anaphylactic reaction | Antibodies against donor plasma proteins (esp. IgA in IgA-deficient recipients); urticaria, anaphylaxis |
| TRALI (Transfusion-Related Acute Lung Injury) | Donor antibodies against recipient leukocytes; pulmonary edema within 6 hours |
| Circulatory overload (TACO) | Too rapid infusion; pulmonary edema, hypertension |
| Air embolism | Air in tubing enters vein |
| Hypothermia | Massive transfusion with cold blood |
- Delayed hemolytic reaction (3-14 days): Anamnestic antibody response in previously sensitized patients.
- Alloimmunization: Development of new antibodies against donor antigens.
- Graft-versus-host disease (GVHD): Donor lymphocytes attack immunocompromised recipient's tissues.
- Post-transfusion purpura: Thrombocytopenia 5-10 days post-transfusion.
- Hypocalcemia: Citrate (preservative) chelates Ca²+.
- Hyperkalemia: Stored blood has high K+ from hemolysis.
- Acidosis: Citric acid + lactic acid from stored blood.
- Coagulopathy: Dilution of clotting factors and platelets.
- HIV, Hepatitis B, Hepatitis C, CMV, malaria, syphilis (now rare due to screening).
Q8. Define and classify shock. Explain hypovolemic shock.
| Type | Mechanism | Examples |
|---|---|---|
| Hypovolemic | Reduced circulating blood volume | Hemorrhage, burns, dehydration, vomiting |
| Cardiogenic | Pump failure | MI, cardiac tamponade, severe arrhythmia |
| Distributive | Maldistribution of blood flow | Septic, anaphylactic, neurogenic shock |
| Obstructive | Obstruction to blood flow | Pulmonary embolism, tension pneumothorax |
- Baroreceptors detect fall in BP → sympathetic activation
- ↑ Heart rate, ↑ Contractility
- Vasoconstriction (arteriolar) → ↑ Peripheral resistance
- Renin-Angiotensin-Aldosterone system activated → Na+ and water retention
- ADH (Vasopressin) released → water reabsorption
- Tachycardia, anxiety, reduced pulse pressure, prolonged capillary refill
- Urine output decreases (20-30 mL/hr)
- Marked hypotension, tachycardia, confusion
- Oliguria (<20 mL/hr)
- Decompensated shock - all mechanisms fail
- Severe hypotension, unconsciousness, anuria
- Death if untreated
Q9. Define Hypoxia. Explain different types of hypoxia with examples.
- PaO2 is reduced; hemoglobin is not fully saturated.
- Cause: Low inspired O2 tension (high altitude), hypoventilation (COPD, opioid overdose), diffusion impairment (pulmonary fibrosis, pneumonia), V/Q mismatch (pulmonary embolism), right-to-left shunt.
- Example: Mountain climbers at high altitude; drowning.
- PaO2 is normal but O2-carrying capacity of blood is reduced.
- Cause: Anemia (reduced Hb), carbon monoxide poisoning (COHb), methemoglobinemia.
- Example: CO poisoning - CO has 200x affinity for Hb over O2; patient looks "cherry red" but is hypoxic.
- Arterial O2 content is normal but blood flow is too slow to deliver adequate O2.
- Cause: Heart failure, shock, local arterial obstruction.
- Example: Congestive heart failure; gangrene of a limb.
- O2 delivery is normal but cells cannot utilize O2 due to impaired mitochondrial function.
- Cause: Cyanide poisoning (blocks cytochrome oxidase/Complex IV), alcohol in large doses.
- Example: Cyanide poisoning - blood and tissues are hyperoxic, but cells cannot use the O2.
- O2 delivery is normal but tissue demand exceeds supply.
- Example: Extreme exercise, high fever, thyrotoxicosis.
Q10. Explain pathophysiology and management of peptic ulcer.
- H. pylori infection (90% of duodenal, 70% of gastric ulcers): Disrupts mucus layer, produces urease (generates NH3 → mucosal damage), stimulates gastrin release → ↑ HCl.
- Excess HCl secretion: Stimulated by gastrin, histamine, acetylcholine.
- NSAIDs/Aspirin: Inhibit COX-1 → ↓ prostaglandin synthesis → ↓ mucus and bicarbonate secretion, direct mucosal injury.
- Pepsin: Proteolytic enzyme activated at low pH.
- Bile reflux: Particularly in gastric ulcers.
- Smoking: ↓ prostaglandins, ↓ bicarbonate, ↑ gastric acid.
- Mucus-bicarbonate layer: Forms gel barrier trapping bicarbonate.
- Surface epithelial cells: Tight junctions prevent acid back-diffusion; rapid renewal.
- Prostaglandins (PGE2, PGI2): Stimulate mucus and bicarbonate, increase blood flow, promote cell renewal.
- Mucosal blood flow: Removes excess acid and delivers nutrients.
- Alkaline tide: Neutralizes residual acid.
- Eradicate H. pylori (Triple therapy): PPI (Omeprazole) + Amoxicillin + Clarithromycin for 14 days.
- Proton Pump Inhibitors (PPIs): Omeprazole, Pantoprazole - most effective acid suppressants (block H+/K+-ATPase pump).
- H2 receptor blockers: Ranitidine, Famotidine.
- Antacids: Symptomatic relief (Mg(OH)2, Al(OH)3).
- Cytoprotective agents: Sucralfate (forms gel at ulcer base), Misoprostol (PGE1 analog).
- Perforation: Emergency oversewing or patch repair.
- Bleeding: Endoscopic hemostasis; if fails - surgery.
- Vagotomy + drainage for refractory cases.
SHORT ESSAY - 5 marks each (Q11-17)
Q11. Enumerate the steps of phagocytosis.
- Phagocytes are attracted to the site of infection by chemical signals (chemokines, complement C5a, bacterial products, LTB4).
- Phagocyte receptors bind to particles directly or via opsonins (IgG antibody, C3b complement).
- Receptors include: Fc receptors (for IgG), complement receptors (CR1, CR3), mannose receptors, scavenger receptors.
- Opsonization greatly enhances phagocytosis.
- Pseudopods extend around the particle ("zipper" mechanism).
- Plasma membrane folds around and encloses the particle in a membrane-bound vesicle called a phagosome.
- The phagosome fuses with lysosomes to form a phagolysosome.
- Lysosomal enzymes (acid hydrolases, lysozyme, myeloperoxidase, defensins) are released into the phagolysosome.
- NADPH oxidase converts O2 → superoxide (O2−) → hydrogen peroxide (H2O2).
- Myeloperoxidase converts H2O2 + Cl− → HOCl (hypochlorous acid) - most potent microbicidal agent.
- ROS (reactive oxygen species) damage microbial DNA, proteins, lipids.
- Lysozyme: Cleaves bacterial cell wall peptidoglycan.
- Defensins: Disrupt microbial membranes.
- Lactoferrin: Sequesters iron (essential for bacterial growth).
- Acid pH of phagolysosome.
- Debris is expelled by exocytosis (degranulation) or phagocyte undergoes apoptosis.
Q12. Describe the factors regulating cardiac output.
- Normal CO = ~5 L/min (HR 72/min × SV 70 mL)
| Factor | Effect |
|---|---|
| Sympathetic (β1 receptors, noradrenaline) | ↑ HR (positive chronotropy) |
| Parasympathetic (vagus nerve, acetylcholine) | ↓ HR (negative chronotropy) |
| Temperature | ↑ temperature → ↑ HR |
| Thyroid hormone | ↑ HR |
| Hypoxia / CO2 | ↑ HR via chemoreceptors |
| Bainbridge reflex | ↑ venous return → ↑ HR |
- Frank-Starling Law: As venous return increases → EDV increases → greater fiber stretch → greater force of contraction → ↑ SV.
- Factors increasing preload: ↑ venous return, ↑ blood volume, venoconstriction.
- ↑ afterload → ↓ SV (heart works harder to eject blood).
- Factors: hypertension, aortic stenosis.
- Intrinsic strength of contraction independent of preload.
- Increased by: sympathetic stimulation, catecholamines, digitalis, ↑ Ca²+, thyroid hormone.
- Decreased by: heart failure, hypoxia, acidosis, β-blockers.
- Metabolic autoregulation: ↑ tissue demand → local vasodilation → ↑ venous return → ↑ CO.
- Anemia, AV fistula: ↑ CO to compensate.
Q13. Define GFR. Mention its normal value. Explain the factors regulating it.
- GFR is determined by the net filtration pressure (NFP):
- NFP = Glomerular hydrostatic pressure (PGC, ~60 mmHg) - Bowman's capsule pressure (PBS, ~15 mmHg) - Oncotic pressure of plasma (πGC, ~32 mmHg)
- NFP = 60 - 15 - 32 = +13 mmHg
- Myogenic mechanism: Increased arterial pressure → afferent arteriole constricts (prevents rise in PGC).
- Tubuloglomerular feedback (TGF): ↑ NaCl delivery to macula densa → adenosine release → afferent arteriole constriction → ↓ GFR (negative feedback).
- Dilation (prostaglandins, NO, dopamine) → ↑ PGC → ↑ GFR.
- Constriction (noradrenaline, angiotensin II, endothelin) → ↓ PGC → ↓ GFR.
- Constriction (angiotensin II mildly) → ↑ PGC → ↑ GFR (but severe constriction → ↓ GFR).
- ↑ Protein (dehydration, infusion) → ↑ πGC → ↓ GFR.
- ↓ Protein (nephrotic syndrome, malnutrition) → ↓ πGC → ↑ GFR.
- Determined by glomerular capillary permeability and surface area.
- ↑ Kf (glomerulonephritis, mesangial relaxation) → ↑ GFR.
Q14. Describe the chemical regulation of respiration.
- Located in the ventral surface of medulla oblongata (separate from respiratory centers).
- Sensitive to ↑ PaCO2 (hypercapnia) and ↓ pH of CSF.
- Mechanism: CO2 crosses the blood-brain barrier → combines with H2O → H2CO3 → H+ + HCO3−. H+ ions stimulate chemoreceptors → ↑ ventilation.
- CO2 is the most important chemical regulator of respiration in normal conditions.
- Do NOT respond directly to O2 levels.
- Located in carotid bodies (at bifurcation of common carotid artery - most important) and aortic bodies (in aortic arch).
- Sensitive to: ↓ PaO2 (<60 mmHg), ↑ PaCO2, ↓ pH.
- Carotid bodies also respond to ↓ arterial blood flow, ↑ temperature.
- Signal via CN IX (Hering's nerve → glossopharyngeal) from carotid bodies and CN X (vagus) from aortic bodies.
| Stimulus | Receptor | Response |
|---|---|---|
| ↑ CO2 (PaCO2 >40 mmHg) | Central >> Peripheral | ↑ Rate and depth of breathing |
| ↓ pH (metabolic acidosis) | Central + Peripheral | ↑ Ventilation (compensatory) |
| ↓ O2 (PaO2 <60 mmHg) | Peripheral only | ↑ Ventilation ("hypoxic drive") |
Q15. Describe composition and functions of Pancreatic juice.
- Volume: 1.5-2 L/day
- pH: 8.0-8.3 (alkaline)
- Produced by acinar cells (enzymes) and ductal cells (bicarbonate/water)
- Water: Major component
- Bicarbonate (HCO3−): Major anion; secreted in high concentrations (up to 140 mEq/L) by ductal cells in response to secretin; neutralizes gastric acid in duodenum.
- Electrolytes: Na+, K+, Cl−
- Trypsinogen → Trypsin (activated by enterokinase/enteropeptidase from duodenum)
- Chymotrypsinogen → Chymotrypsin (activated by trypsin)
- Proelastase → Elastase
- Procarboxypeptidase → Carboxypeptidase (cleaves C-terminal amino acids)
- Trypsin inhibitor (prevents autodigestion within pancreas)
- Pancreatic lipase: Hydrolyzes triglycerides → monoglycerides + fatty acids (requires co-lipase)
- Cholesterol esterase (CECE): Hydrolyzes cholesterol esters
- Phospholipase A2: Cleaves phospholipids
- Pancreatic α-amylase: Hydrolyzes starch → maltose, maltotriose, limit dextrins (secreted in active form)
- Ribonuclease (RNase) and DNase: Digest nucleic acids
- Neutralizes gastric acid → creates optimal pH (7-8) for intestinal enzymes.
- Protein digestion: Endopeptidases (trypsin, chymotrypsin) cleave interior peptide bonds; exopeptidases (carboxypeptidase) cleave terminal amino acids.
- Fat digestion: Lipase and colipase hydrolyze triglycerides; bile salts emulsify fats first.
- Carbohydrate digestion: Amylase completes starch digestion begun in the mouth.
- Nucleic acid digestion: DNase and RNase.
Q16. Describe micturition reflex. What is cystometrogram?
- Spinal micturition center: Sacral segments S2-S4 (detrusor nucleus / Onuf's nucleus)
- Higher centers: Pontine micturition center (PMC), hypothalamus, cortex (voluntary control)
-
Bladder filling: Urine accumulates; detrusor muscle remains relaxed (low pressure) due to sympathetic tone (β3 adrenoceptors). Internal urethral sphincter is closed (α1 sympathetic). External sphincter is closed (somatic, pudendal nerve).
-
Stretch stimulus: At ~300-400 mL, stretch receptors in the bladder wall send afferent impulses via pelvic nerve → S2-S4.
-
Micturition reflex arc:
- Afferent: Pelvic nerve (sensory) from detrusor stretch receptors.
- Integration: Sacral micturition center (S2-S4) coordinates with pontine micturition center.
- Efferent:
- Parasympathetic (pelvic nerve): Contracts detrusor (M3 receptors).
- Sympathetic inhibited: Internal sphincter opens.
- Somatic (pudendal nerve) inhibited: External sphincter relaxes (voluntary override can maintain contraction).
-
Voiding: Detrusor contracts, both sphincters relax → urine expelled.
-
After micturition: Sympathetic tone restores sphincter closure; detrusor relaxes; cycle restarts.
- Phase I (Filling / Tonus limb): Slight rise in pressure as bladder fills (0-300 mL). Bladder compliance is high (pressure remains nearly flat due to plastic nature of smooth muscle).
- First sensation to void: ~150-200 mL
- Phase II: Micturition contractions appear as pressure waves when the micturition reflex is triggered.
- Phase III (Voiding): Sharp rise in pressure during detrusor contraction, pressure falls after voiding.
Q17. Enumerate the duties of a doctor.
- Provide competent medical care with compassion and respect for patient dignity.
- Maintain patient confidentiality (except where law requires disclosure).
- Obtain informed consent before any examination, investigation, or treatment.
- Provide emergency care when needed, regardless of payment.
- Not refuse treatment on grounds of race, religion, gender, or social status.
- Maintain continuity of care; not abandon a patient midway without notice.
- Refer to appropriate specialists when necessary.
- Truthfully inform patients about their condition and treatment options.
- Maintain the dignity and honour of the profession.
- Not indulge in self-advertisement or canvassing.
- Not poach patients from colleagues.
- Maintain proper medical records.
- Cooperate with medicolegal requirements and report notifiable diseases.
- Continue medical education (CME) to stay updated.
- Report communicable/notifiable diseases to public health authorities (e.g., cholera, plague, TB).
- Participate in health promotion and disease prevention.
- Provide impartial medicolegal services when required.
- Report cases of suspected child abuse, unnatural death, or injury due to crime.
- Respect the law and not prescribe controlled substances irresponsibly.
- Provide evidence in courts when summoned.
- Issue certificates (death, fitness, medical) honestly and accurately.
- Participate in national health programs.
- Maintain physical and mental health.
- Practice self-regulation and avoid substance abuse.
- Seek help if suffering from a condition that may impair professional duties.