

What are the findings & possible ecg dx? ( Clinical History : Normotensive patient, Echo : Hypertrophied IVS & PW, LVIDd 46mm, Global hypokinesia, EF 33%,)
left ventricular hypertrophy ECG with strain pattern
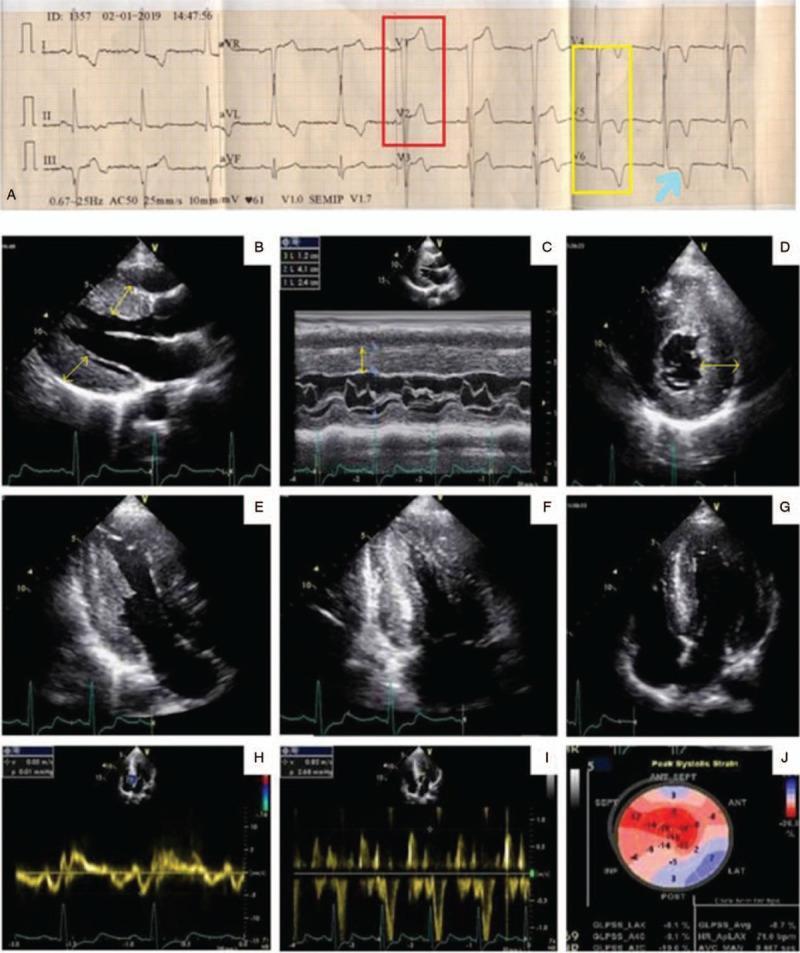
A multi-panel clinical diagnostic figure comprising a surface electrocardiogram (ECG) and transthoracic echocardiography (TTE) images related to cardiac amyloidosis evaluation. Panel A displays a 12-lead ECG showing signs of left ventricular hypertrophy (LVH), with high-amplitude QRS complexes in V2 (red box) and V5-V6 (yellow box) accompanied by a classic ST-segment depression and T-wave inversion indicative of a strain pattern (blue arrow). Panels B-G show 2D and M-mode echocardiography images illustrating significant asymmetric septal hypertrophy, with the interventricular septum measuring 2.4 cm. A distinctive 'speckled' or granular myocardial texture is visible in the short-axis views (D-E). Panels H-I utilize Tissue Doppler imaging to evaluate diastolic dysfunction, showing an E/e' ratio suggestive of grade 2 dysfunction. Panel J presents a bull's-eye map from speckle-tracking strain echocardiography, demonstrating a characteristic 'apical sparing' pattern (marked diminution of longitudinal strain in the basal and mid-segments with preserved apical function), which is highly suggestive of cardiac amyloidosis.
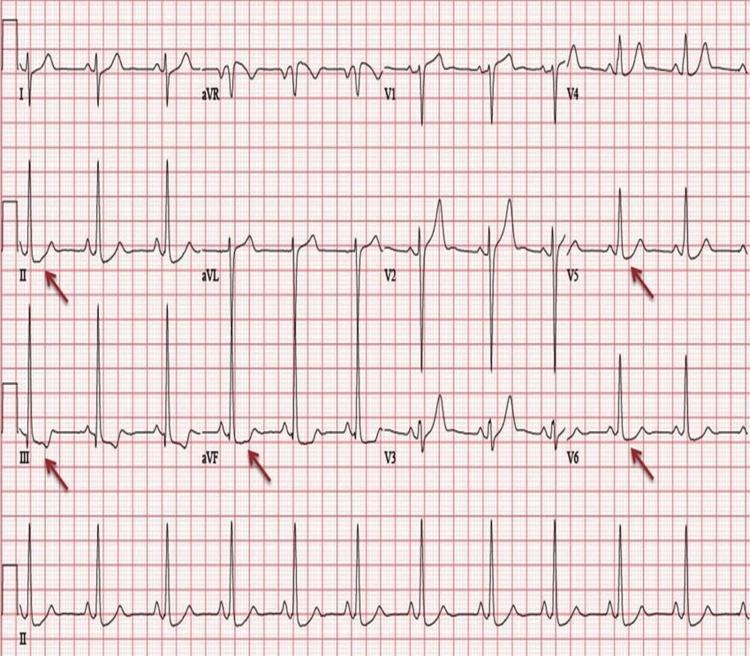
This diagnostic image is a 12-lead electrocardiogram (ECG) demonstrating classic features of Left Ventricular Hypertrophy (LVH) with associated strain patterns. The tracing shows a sinus rhythm with high QRS voltage, characterized by tall R-waves in the lateral leads (V5, V6) and deep S-waves in the right precordial leads (V1, V2), satisfying Sokolow-Lyon criteria for LVH. Red arrows highlight significant ST-segment depression and T-wave inversions in the inferolateral leads (II, III, aVF, V5, and V6). This repolarization abnormality is characteristic of a 'strain pattern' often seen in severe chronic pressure or volume overload of the left ventricle. Clinical relevance includes the assessment of hypertensive heart disease and cardiomyopathies, such as left ventricular non-compaction (LVNC). The ECG serves as a primary screening tool for identifying structural heart changes and associated ischemic or metabolic disturbances.
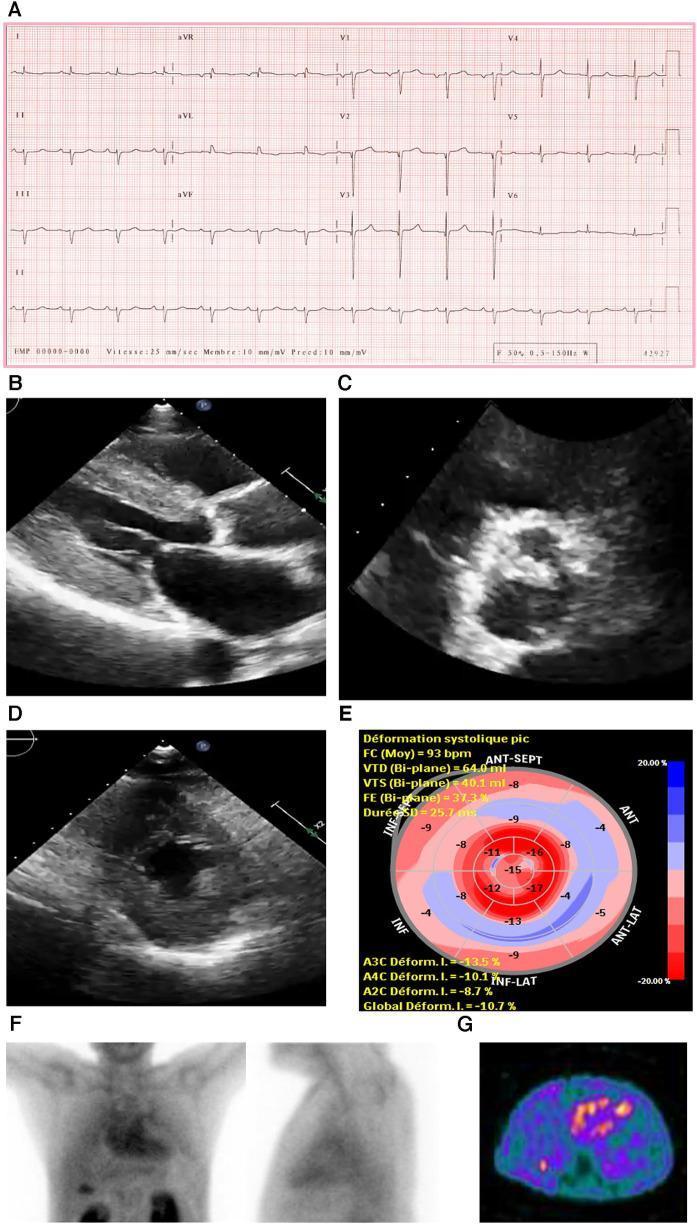
This composite diagnostic image illustrates clinical investigations for cardiac amyloidosis. Panel A shows a 12-lead electrocardiogram (ECG) demonstrating a regular sinus rhythm, prolonged PR interval (first-degree AV block), and low voltage in the limb leads, which contrasts with the ventricular hypertrophy seen in imaging. Panels B and D are 2D echocardiograms showing a small left ventricular (LV) cavity with marked concentric LV hypertrophy. Panel C displays a parasternal short-axis view of a severely calcified trileaflet aortic valve, characteristic of aortic stenosis. Panel E presents a global longitudinal strain (GLS) polar map ('bull's-eye' plot) showing reduced strain in the basal and mid-ventricular segments with relative apical sparing (a classic 'cherry on top' pattern). Panel F consists of anterior and lateral planar bone scintigraphy (99mTc-PYP) showing intense myocardial tracer uptake (Grade 3). Panel G shows a matching SPECT scan confirming strong cardiac uptake, confirming a diagnosis of transthyretin cardiac amyloidosis.
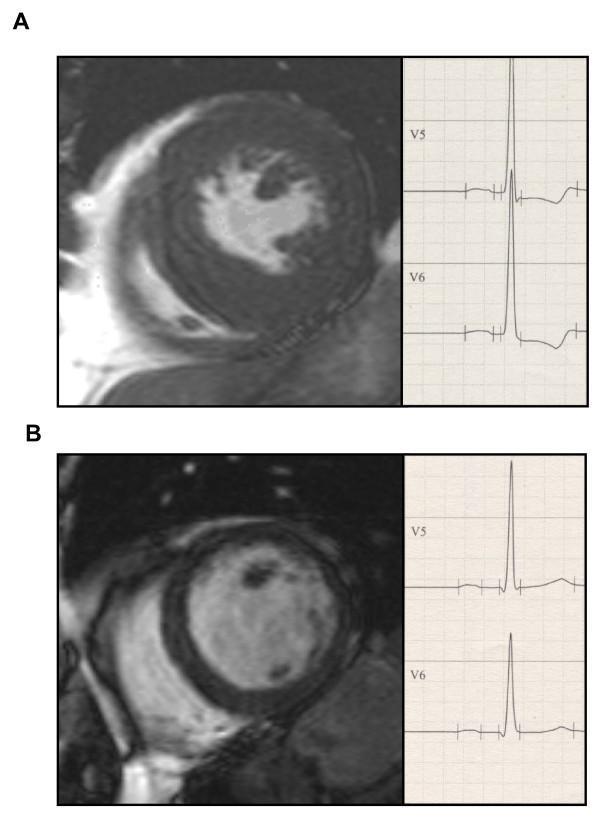
This comparative medical illustration presents short-axis Cardiac Magnetic Resonance (CMR) images and corresponding Electrocardiogram (ECG) tracings for two types of Left Ventricular Hypertrophy (LVH). Panel A demonstrates concentric LVH, characterized by a significantly thickened myocardial wall and a reduced left ventricular (LV) end-diastolic cavity diameter (42 mm). The adjacent ECG shows high-voltage R waves in leads V5 and V6 with accompanying ST-segment depression and T-wave inversion, consistent with a left ventricular strain pattern. Panel B illustrates eccentric LVH, featuring a dilated LV cavity (end-diastolic diameter 60 mm) and relatively thinner myocardial walls compared to the concentric model. The corresponding ECG in panel B shows high-voltage R waves but with upright T waves and less pronounced ST-segment changes. The visual comparison highlights the structural differences between pressure-overload (concentric) and volume-overload (eccentric) remodeling and their respective electrophysiological manifestations, facilitating the study of cardiac morphology and ECG-LVH correlation criteria.
dilated cardiomyopathy ECG LBBB low voltage poor R wave progression
ECG Findings & Analysis
ECG Findings (Systematic Read)
| Parameter | Finding |
|---|---|
| Rhythm | Sinus rhythm, regular |
| Rate | ~76 bpm |
| PR interval | Normal (~160-180 ms) |
| QRS duration | Widened (~120-130 ms) - borderline/complete LBBB morphology |
| QRS axis | ~61° (per machine readout) - normal axis |
| RV5/SV1 amplitude | 4.04 mV (machine) - markedly elevated |
- Limb leads (I, II, III, aVF): Broad, notched upright QRS complexes; ST-T changes with T-wave inversion in inferior leads
- aVR: Deep QS-type complex (expected in LVH/LBBB)
- aVL: Broad monophasic R wave; ST depression with T-wave inversion
- V1-V2: Deep broad QS complexes (rS or QS pattern) - no initial r wave, consistent with septal activation reversal in LBBB
- V3: Transitional, still with deep S
- V4-V5: Tall broad R waves; ST segment depression; T-wave inversion (strain pattern)
- V6: Tall broad monophasic R wave with secondary ST-T changes
- QRS width ~120+ ms with the pattern of LBBB (QS in V1, broad monophasic R in V5-V6, no septal Q waves in lateral leads)
- LVH voltage criteria met: RV5 + SV1 > 35 mm (Sokolow-Lyon), RV5/SV1 amp 4.04 mV per machine
- Lateral strain pattern: ST depression + T-wave inversion in I, aVL, V4-V6
- Machine interpretation confirms: Sinus rhythm / Left ventricular abnormality / Possible left [ventricular hypertrophy] / Abnormal ECG
ECG Diagnoses (in order of likelihood)
- Broad QRS (≥120 ms), QS in V1, broad monophasic R in V5-V6, absent septal Q waves in lateral leads
- Secondary ST-T changes (discordant T waves) are expected in LBBB and are not independent ischemic markers
- Voltage criteria satisfied (Sokolow-Lyon: SV1 + RV5/V6 > 35 mm)
- Strain pattern (ST depression + T inversion in I, aVL, V4-V6) reflects pressure/volume overload
- Note: In the presence of LBBB, LVH voltage criteria are less reliable but the overall pattern is consistent
Clinico-ECG Correlation
| Clinical Finding | ECG Correlation |
|---|---|
| Hypertrophied IVS & PW (Echo) | LVH voltage criteria + strain pattern |
| EF 33% (severe LV dysfunction) | LBBB (in DCM, LBBB causes dyssynchrony and worsens EF) |
| Global hypokinesia | LBBB with dyssynchrony - no discrete wall motion abnormality expected |
| LVIDd 46 mm (upper-normal/mild dilat.) | Consistent with hypertrophic + dilated phase |
| Normotensive | Rules out hypertensive cardiomyopathy as primary driver |
Most Probable Diagnosis
- Echo: Hypertrophied IVS + PW (symmetric hypertrophy) + LVIDd 46 mm (borderline dilated) + EF 33% (severely reduced) + Global hypokinesia
- ECG: LBBB + LVH voltage + lateral strain
- Normotensive patient
Immediate Clinical Considerations
- Exclude ischemic cardiomyopathy - coronary angiography or stress imaging (LBBB + ST changes can mask ischemia)
- CRT candidacy - EF ≤35% + LBBB with QRS ≥120 ms = Class I indication (NYHA II-IV)
- HF medications - ACEi/ARB/ARNI + beta-blocker + MRA + SGLT2i per guidelines
- Holter monitoring - HCM has high risk of ventricular arrhythmias; assess for VT/VF and ICD candidacy
- Cardiac MRI - best for distinguishing HCM (fibrosis pattern) vs. DCM vs. infiltrative disease