
Advances in drug delivery system in anesthesia 10 mark answer
drug delivery systems anesthesia advances
target controlled infusion TCI propofol pharmacokinetic model diagram
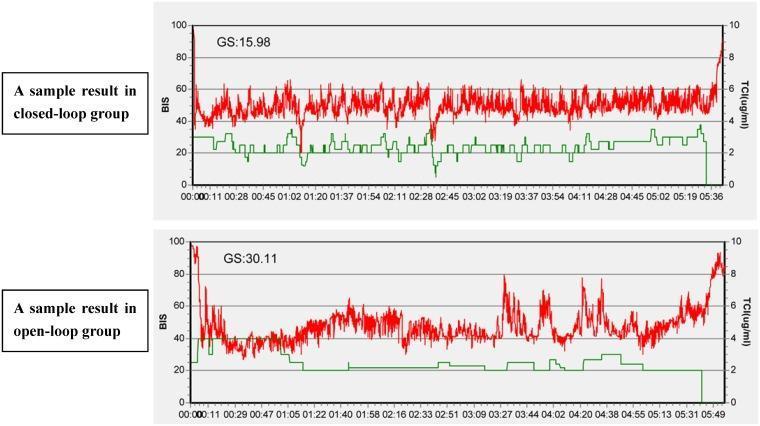
This medical comparison chart illustrates the trends of Bispectral Index (BIS) and target-controlled infusion (TCI) of propofol during anesthesia in two different clinical groups: closed-loop and open-loop systems. The visual content consists of two time-series graphs with time on the x-axis, BIS values (0-100) on the left y-axis, and propofol concentration (μg/ml) on the right y-axis. The red line represents the BIS trend, while the green line indicates the calculated propofol target concentration. In the closed-loop group (top graph, GS=15.98), the BIS values demonstrate greater stability, fluctuating within a narrow target range of 40-60 throughout the induction and maintenance phases. The propofol concentration shows frequent, small adjustments, suggesting responsive automated titration. In contrast, the open-loop group (bottom graph, GS=30.11) exhibits larger oscillations in BIS values and less frequent propofol dosage adjustments, characterized by longer periods of steady-state infusion despite BIS drift. This comparison highlights the efficiency of closed-loop anesthetic delivery in maintaining a consistent depth of anesthesia and reducing glycemic variability or hemodynamic instability associated with over- or under-sedation.
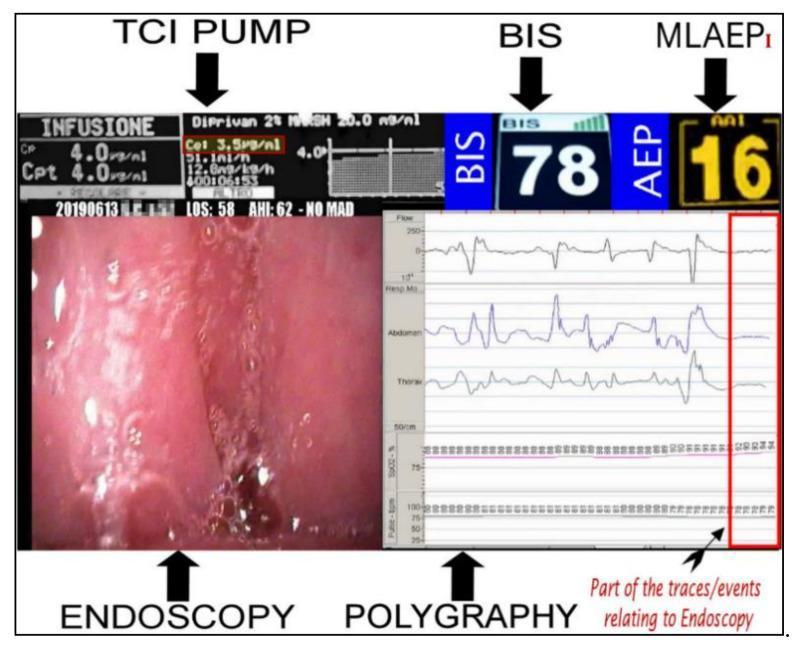
This composite educational image illustrates a 5-Video stream Experimental system (5VsEs) used during Drug-Induced Sleep Endoscopy (DISE). The display integrates five critical monitoring streams: a Target-Controlled Infusion (TCI) pump interface, depth of anesthesia indices, real-time endoscopy, and polygraphy. The TCI pump section displays Propofol administration data, including a plasma concentration (Cp) and target plasma concentration (Cpt) of 4.0 µg/ml, and a predicted effect-site concentration (Cet) of 3.5 µg/ml. Depth of anesthesia is quantified by the Bispectral Index (BIS), shown as 78, and the Middle Latency Auditory Evoked Potential index (MLAEPi/AAI), shown as 16. The lower left panel provides a live endoscopic view of the upper airway, while the lower right panel presents polygraphic waveforms (including flow, respiratory effort, and SpO2). A red rectangle highlights a period of apnea in the polygraphy trace, correlating the pharmacological sedation level with clinical airway obstruction. This setup is used to assess anesthetic pharmacodynamics and differentiate between obstructive and central sleep apnea during surgical evaluation.
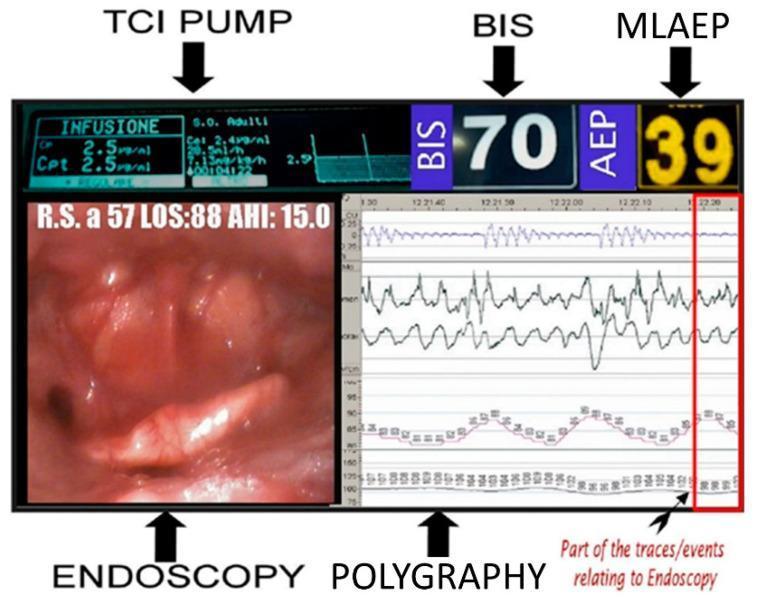
A comprehensive 'all-in-one' integrated monitor display used during Drug-Induced Sleep Endoscopy (DISE), specifically the 5VsEs prototype. The single-screen interface synchronizes five critical data sources for real-time airway evaluation. 1) Top Left: TCI (Target Controlled Infusion) pump monitor showing propofol infusion parameters (CP and Cpt at 2.5 µg/ml). 2) Top Right: Sedation depth monitors displaying a Bispectral Index (BIS) of 70 and Middle Latency Auditory Evoked Potential (MLAEP) value of 39. 3) Bottom Left: High-definition endoscopic view of the upper airway, specifically the oropharynx/laryngeal inlet, annotated with patient clinical data (e.g., AHI 15.0). 4) Bottom Right: A polygraphy section displaying synchronized waveforms including respiratory effort, oxygen saturation trends, and heart rate. A red vertical line indicates the temporal alignment between the endoscopic visual and the physiological traces. This diagnostic setup is designed to correlate pharyngeal collapse patterns with specific anesthetic concentrations and respiratory events during induced sleep, optimizing surgical decision-making for obstructive sleep apnea (OSA).
Advances in Drug Delivery Systems in Anesthesia
Introduction
1. Target-Controlled Infusion (TCI)
- The pump first administers a bolus equal to (V1 x target concentration) to rapidly fill the central compartment
- It then delivers a continuously varying infusion rate to replace drug lost to redistribution and elimination
- Two modes are available: plasma-controlled TCI (targets blood concentration, slower effect-site equilibration) and effect-site TCI (deliberately overshoots plasma to achieve faster effect-site targeting)
- Propofol: Marsh model (weight-based) and Schnider model (age, weight, height, lean body mass) - the Schnider model is preferred for effect-site targeting
- Remifentanil: Minto model
- Sufentanil: Gepts model
- More predictable induction and maintenance compared to manual bolus dosing
- Faster, smoother emergence
- Facilitates TIVA (Total Intravenous Anesthesia)
- Allows patient-controlled sedation (TCI-PCS) using opioids or propofol - TCI-PCS with alfentanil showed superior analgesia quality compared to standard morphine PCA (Barash Clinical Anesthesia 9e, p. 806-807)
2. Closed-Loop Anesthesia Delivery
- PID (Proportional-Integral-Derivative) controllers - adjust infusion based on magnitude of deviation from target, rate of change of that deviation, and cumulative error; may become unstable under rapidly changing conditions
- Model-driven (adaptive) closed-loop systems - the measured response also updates the PK model driving the infusion rate; superior performance in extreme conditions (Barash Clinical Anesthesia 9e, p. 817)
- Depth of anesthesia: BIS, EEG entropy, or auditory evoked potentials as feedback signals for propofol ± remifentanil delivery
- Neuromuscular blockade: train-of-four (TOF) ratio-guided neuromuscular blocking agent infusion
- Blood pressure: vasodilator/vasopressor infusion
- Blood glucose: insulin delivery in the OR/ICU
3. Target-Controlled Inhalational Anesthesia (End-Tidal Control)
- In 2022, the FDA approved the first such software in the US (compatible with GE Aisys CS2 Anesthesia Delivery System); European systems (FLOW-i, Zeus/Dräger) have been available longer
- Reduces anesthetic agent wastage and environmental contamination
- Improves cost-efficiency and recovery consistency (Miller's Anesthesia 10e, p. 10014-10015)
4. Response Surface Models and Multi-Drug Interaction-Guided Delivery
5. Epidural Delivery Advances
Continuous Epidural Infusion (CEI)
Patient-Controlled Epidural Analgesia (PCEA)
Programmed Intermittent Epidural Bolus (PIEB)
- Lower total anesthetic dose
- Higher patient satisfaction
- Lower incidence of motor block and instrumental vaginal delivery
6. Patient-Controlled Analgesia (PCA)
- Better pain control through individualization
- Higher patient satisfaction
- Reduced nursing workload
7. Intrathecal Drug Delivery Systems (IDDS)
- Programmable external telemetry-controlled pumps
- Combination drug cocktails in a single reservoir
- Rechargeable long-life batteries
8. Nano-Based Drug Delivery for Local Anesthetics
| System | Examples | Advantage |
|---|---|---|
| Liposomes | Exparel (liposomal bupivacaine) | Extended-release, up to 72 hours duration |
| Polymeric nanoparticles | PLGA microspheres | Sustained slow release |
| Cyclodextrin complexes | HP-beta-CD + drugs | Improved solubility, reduced cardiotoxicity |
| Lipid nanoparticles | Structured lipid carriers | Depot effect at injection site |
9. Iontophoresis and Transdermal Systems
- Iontophoresis: Uses a small electric current to drive ionized drugs (e.g., lidocaine, fentanyl) through skin. The Numby Stuff system was used for topical anesthesia prior to IV cannulation in pediatrics
- Fentanyl iontophoretic transdermal system (ITS): Patient-activated fentanyl patch for postoperative pain, providing on-demand analgesia without IV access
- Avoids first-pass metabolism, useful when IV access is difficult
10. Smart Pumps and Integrated Monitoring
- Pre-programmed concentration and dose limits alert to potentially dangerous infusion rates
- Connectivity with electronic health records enables automatic documentation
- Integration with anesthesia workstations allows unified monitoring of TCI parameters, depth of anesthesia (BIS/EEG), and neuromuscular function on a single display
Summary Table
| Advance | Key Feature | Clinical Benefit |
|---|---|---|
| TCI | PK model-driven variable rate IV infusion | Precise plasma/effect-site targeting |
| Closed-loop delivery | Automated feedback-controlled titration | Optimal depth, reduced drug use |
| End-tidal control (inhalational) | Preset target alveolar concentration | Reduced waste, cost savings |
| PIEB | Automated epidural boluses | Better spread, lower motor block |
| PCEA/PCA | Patient-activated demand dosing | Individualized, higher satisfaction |
| IDDS | Intrathecal programmable pumps | Chronic pain, low systemic dose |
| Liposomal local anesthetics | Sustained-release nanoparticles | Prolonged block (up to 72 h) |
| Smart pumps + DERS | Drug libraries + dose alerts | Medication safety |
Conclusion
- Barash, Cullen & Stoelting's Clinical Anesthesia, 9th ed., Chapter 11 (Pharmacokinetics / TCI / Closed-loop)
- Miller's Anesthesia, 10th ed., Chapter 23 (TCI), Chapter 27 (Ambulatory anesthesia/end-tidal control)
- De Andres J et al. Intrathecal Drug Delivery. Front Pain Res. 2022. PMID 35782225
- Ma H et al. Nano-Based Drug Delivery Systems for Local Anesthetics. Drug Des Devel Ther. 2023. PMID 37667787
Close loop delivery for 5 marks
closed loop anesthesia delivery automated feedback
Closed-Loop Drug Delivery in Anesthesia
Definition
Components of a Closed-Loop System
| Component | Role |
|---|---|
| Sensor / Monitor | Continuously measures drug effect (the feedback signal) |
| Target value | Clinician-set desired level of drug effect |
| Controller algorithm | Calculates required change in drug infusion rate |
| Infusion pump / actuator | Delivers drug at the computed rate |
Feedback Signals Used
- Depth of hypnosis - Bispectral Index (BIS), processed EEG entropy, auditory evoked potentials (AEP) - used to control propofol or volatile agent delivery
- Analgesia / nociception - Nociceptive indices (sympathetic responsiveness monitors) - used to guide opioid delivery
- Neuromuscular blockade - Train-of-four (TOF) ratio - used to titrate NMB agents
- Blood pressure - Arterial line monitoring - used to titrate vasodilators/vasopressors
- Blood glucose - Continuous glucose monitoring - used for insulin infusion in the OR/ICU
Controller Types
1. PID (Proportional-Integral-Derivative) Controller
- Proportional (P): magnitude of current deviation from target
- Integral (I): cumulative error over time (corrects persistent offset)
- Derivative (D): rate of change of error (anticipates overshoot)
2. Model-Driven (Adaptive) Closed-Loop System
Clinical Evidence
- Over the past decade, multiple clinical trials of closed-loop propofol delivery (with BIS as feedback) and closed-loop propofol + remifentanil co-delivery have demonstrated:
- Superior efficiency in drug use (less total drug administered)
- Faster and smoother emergence from anesthesia
- Better maintenance of BIS within the target range (40-60)
- Performance superior to manual titration by experienced anesthesiologists
Challenges and Limitations
- Defining "anesthesia" - There is no single perfect monitor for anesthetic depth; BIS and entropy have limitations (muscle artifact, burst suppression, awareness at BIS 40)
- Regulatory hurdles - Closed-loop systems are classified as high-risk autonomous medical devices; obtaining FDA/regulatory approval is much harder than for open-loop TCI
- Safety concerns - Incorrect feedback signal or sensor failure could lead to under- or over-dosing without clinician awareness
- Latency - There is an inherent delay between drug administration, PK/PD equilibration, and effect measurement, which challenges controller stability
- Inter-individual variability - PK models may not perfectly predict individual responses, especially in extremes of age, weight, or cardiac output
Current Status
Summary (for exam use)
Closed-loop delivery = continuous measurement of drug effect + automated feedback to adjust infusion rate. Key signal: BIS for hypnosis. Key controller: PID or adaptive/model-driven. Advantages: precision, reduced drug use, faster emergence. Limitations: no perfect depth monitor, regulatory barriers, safety concerns. Currently experimental.