
Can you explain homeostasis in hap b pharm syllabus
Explain now
homeostasis feedback loop diagram physiology
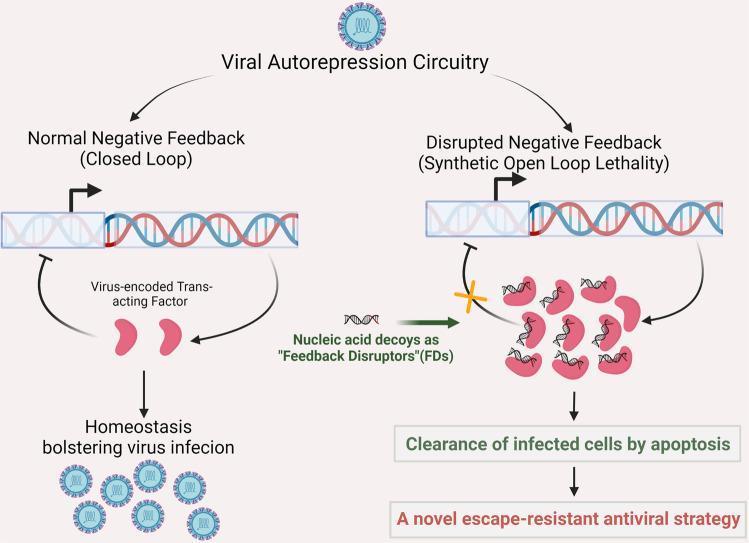
This pathophysiology diagram illustrates the concept of 'open-loop lethality' in viral autorepression circuitry as a novel antiviral strategy. The illustration is divided into two comparative scenarios: 'Normal Negative Feedback (Closed Loop)' and 'Disrupted Negative Feedback (Synthetic Open Loop Lethality)'. On the left, the natural process shows virus-encoded trans-acting factors (red shapes) binding to cis-regulatory sequences on the viral genome to inhibit excessive transcription. This closed loop maintains viral homeostasis and promotes successful infection. On the right, the introduction of synthetic nucleic acid decoys, acting as 'Feedback Disruptors' (FDs), is shown. These decoys sequester the trans-acting factors, indicated by a yellow 'X' disrupting the inhibition arrow. This disruption results in a 'synthetic open loop,' leading to unchecked viral protein expression and toxic accumulation. The diagram maps the downstream educational concepts from this disruption: the clearance of infected cells by apoptosis and the development of an escape-resistant antiviral strategy. Key components labeled include the viral genome (double helix), trans-acting factors, and viral progeny, illustrating principles of molecular virology and therapeutic design.
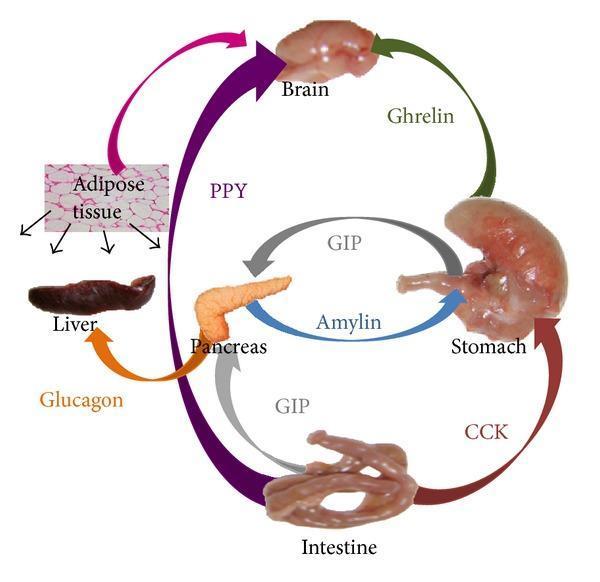
This pathophysiology diagram illustrates the complex endocrine feedback loops involved in human food-intake control and energy homeostasis. The figure features a circular arrangement of key anatomical components: the brain, stomach, intestine, pancreas, liver, and adipose tissue (depicted as a histological section). Interactions are represented by color-coded directional arrows labeled with specific peripheral signals. Key pathways shown include: Ghrelin signaling from the stomach to the brain; Peptide YY (PYY) signaling from the intestine to the brain and adipose tissue; Cholecystokinin (CCK) and Glucose-dependent insulinotropic polypeptide (GIP) from the intestine targeting the stomach and pancreas; Amylin from the pancreas to the stomach; and Glucagon signaling between the pancreas and liver. The diagram demonstrates the integration of central nervous system processing with gastrointestinal and metabolic signals to regulate appetite, satiety, and glucose metabolism. This visual is designed for intermediate to advanced medical education in endocrinology and physiology, highlighting the multiorgan dialogue that maintains metabolic balance.
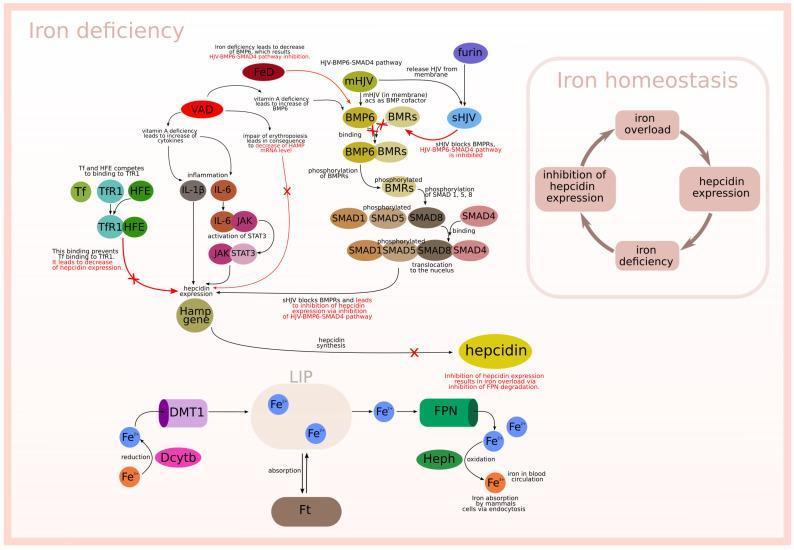
A complex pathophysiology diagram and cellular signaling flowchart detailing iron homeostasis and its dysregulation during iron deficiency and vitamin A deficiency (VAD). The illustration is divided into three functional zones. The upper-left section focuses on hepcidin regulation, showing how VAD and inflammation (IL-1β, IL-6) influence the Hamp gene via the HJV-BMP6-SMAD4 and JAK-STAT3 signaling pathways. It specifically notes that VAD leads to increased BMP6 and cytokines, while iron deficiency (FeD) results in the inhibition of these pathways. Competitive binding between Transferrin (Tf), HFE, and TfR1 is also shown as a regulatory mechanism. The bottom section depicts cellular iron transport: Fe3+ reduction by Dcytb, uptake via DMT1 into the labile iron pool (LIP), storage in ferritin (Ft), and export through ferroportin (FPN) coupled with oxidation by hephaestin (Heph) for systemic circulation. The right panel provides a high-level summary of the iron homeostasis feedback loop, illustrating the relationship between iron overload, hepcidin expression, iron deficiency, and hepcidin inhibition.
Homeostasis - B.Pharm HAP
1. Definition
"Homeostasis is the control of a vital parameter." - Medical Physiology
2. The Concept of Milieu Intérieur
- Milieu extérieur - the outside world
- Milieu intérieur - the stable internal fluid environment surrounding cells (i.e., the extracellular fluid)
3. What Parameters Are Regulated?
| Parameter | Normal Range/Value |
|---|---|
| Blood glucose | ~70-110 mg/dL |
| Body core temperature | 37°C (98.6°F) |
| Arterial blood pressure | ~120/80 mmHg |
| Blood pH (H⁺ concentration) | 7.35-7.45 |
| Plasma K⁺ | 3.5-5.0 mEq/L |
| Plasma Ca²⁺ | 8.5-10.5 mg/dL |
| Blood O₂ and CO₂ | PaO₂ ~80-100 mmHg |
4. Feedback Control Mechanisms
A. Negative Feedback (Most Common)
- Sensor/Receptor - detects the vital parameter (e.g., thermoreceptors detect temperature change)
- Set-point comparison - the sensed value is compared to a reference (normal) value; a "difference signal" or error signal is generated
- Gain/Proportionality factor - the error signal is multiplied and amplified to produce an output signal (e.g., release of insulin)
- Effector - an organ or system that acts to oppose the deviation and bring the parameter back to the set-point (e.g., increased glucose uptake by cells lowers blood sugar)
- When body temperature rises, thermoreceptors in skin and hypothalamus are activated
- Signal travels to medial preoptic and anterior hypothalamic nuclei
- Effectors activated: sweating (sudomotor sympathetic nerves) + cutaneous vasodilation
- Heat dissipates and temperature returns to 37°C
- This silences the thermoreceptors (the "negative" part - the output opposes the input)
B. Positive Feedback (Less Common)
- Childbirth (oxytocin and uterine contractions)
- Blood clotting (coagulation cascade)
- Action potential generation (Na⁺ influx opens more Na⁺ channels)
5. Components of a Homeostatic System (Summary)
Stimulus (deviation from normal)
        ↓
    Receptor/Sensor
        ↓
    Control Center (e.g., hypothalamus, medulla)
        ↓
       Effector
        ↓
   Response (corrects deviation)
        ↓
  Negative feedback → returns to set-point
6. Redundancy in Homeostasis
- Blood glucose is regulated by insulin, glucagon, epinephrine, cortisol, and growth hormone
- If one system fails, others compensate
- This explains why some genetic knockouts in experimental animals do not produce the expected severe effects
7. Homeostasis vs. Equilibrium
| Homeostasis (Steady State) | Equilibrium |
|---|---|
| Requires energy | Does NOT require energy |
| Constant value maintained by balancing gains and losses | No net movement; passive balance |
| Example: blood glucose maintained at 90 mg/dL | Example: a dissolved gas at equal concentration on both sides of a membrane |
8. Homeostatic Imbalance (Pathology)
| System Failing | Disease |
|---|---|
| Blood glucose regulation | Diabetes mellitus (Type 1 or 2) |
| Temperature regulation | Hyperthermia / Hypothermia / Heat stroke |
| Water/electrolyte balance | Dehydration, edema, cardiac arrhythmias |
| Blood pressure regulation | Hypertension / Hypotension |
| Acid-base balance | Acidosis / Alkalosis |
9. Role of the ANS in Homeostasis
- Airflow (bronchial tree)
- Blood flow and blood pressure
- Blood gas composition
- Blood glucose
- Body temperature
- Heart rate
- Glandular secretions
- Electrolyte balance
10. Hierarchy of Feedback Loops
- Hypothalamus controls → anterior pituitary controls → adrenal cortex releases cortisol → cortisol helps control blood glucose
- Some loops are synergistic; others are antagonistic (e.g., insulin lowers glucose; epinephrine and cortisol raise it)
Key Points for Exams
- Homeostasis = maintenance of stable internal environment
- Claude Bernard coined milieu intérieur; Walter Cannon coined "homeostasis"
- Negative feedback = most important mechanism; opposes deviation from set-point
- Positive feedback = amplifies deviation; used in childbirth, clotting, action potentials
- Four components of negative feedback: sensor → comparator → effector → response
- Homeostasis requires energy (steady state, not equilibrium)
- Homeostatic imbalance = disease (diabetes, hypertension, dehydration, etc.)
- ANS + endocrine system = primary executors of homeostasis
This is important question how to add this in ppt i cant understand this
mkdir -p /tmp/workspace/homeostasis-ppt && ls /tmp/workspace/homeostasis-ppt/
~/homeostasis-ppt/create_ppt.py
from pptx import Presentation
from pptx.util import Inches, Pt, Emu
from pptx.dml.color import RGBColor
from pptx.enum.text import PP_ALIGN, MSO_ANCHOR
from pptx.util import Inches, Pt
import copy

prs = Presentation()
prs.slide_width = Inches(13.333)
prs.slide_height = Inches(7.5)

blank = prs.slide_layouts[6]

# ── COLOR PALETTE ──────────────────────────────────────────────
DARK_BLUE   = RGBColor(0x1A, 0x35, 0x6E)  # header background
MED_BLUE    = RGBColor(0x26, 0x5E, 0xA6)  # accent
LIGHT_BLUE  = RGBColor(0xD6, 0xE4, 0xF7)  # content bg
ACCENT_TEAL = RGBColor(0x00, 0x8B, 0x8B)  # highlight
WHITE       = RGBColor(0xFF, 0xFF, 0xFF)
DARK_GRAY   = RGBColor(0x2C, 0x2C, 0x2C)
LIGHT_GRAY  = RGBColor(0xF4, 0xF6, 0xFB)
ORANGE      = RGBColor(0xE8, 0x6A, 0x1A)
GREEN       = RGBColor(0x1E, 0x8A, 0x44)
RED         = RGBColor(0xCC, 0x2E, 0x2E)

# ── HELPER FUNCTIONS ───────────────────────────────────────────

def add_rect(slide, x, y, w, h, fill_color, line_color=None, line_width=None):
    from pptx.util import Pt
    shape = slide.shapes.add_shape(
        1,  # MSO_SHAPE_TYPE.RECTANGLE
        Inches(x), Inches(y), Inches(w), Inches(h)
    )
    shape.fill.solid()
    shape.fill.fore_color.rgb = fill_color
    if line_color:
        shape.line.color.rgb = line_color
        if line_width:
            shape.line.width = Pt(line_width)
    else:
        shape.line.fill.background()
    return shape

def add_textbox(slide, x, y, w, h, text, font_size=18, bold=False,
                color=DARK_GRAY, align=PP_ALIGN.LEFT, italic=False,
                wrap=True):
    tb = slide.shapes.add_textbox(Inches(x), Inches(y), Inches(w), Inches(h))
    tf = tb.text_frame
    tf.word_wrap = wrap
    tf.margin_left = Pt(4)
    tf.margin_right = Pt(4)
    tf.margin_top = Pt(2)
    tf.margin_bottom = Pt(2)
    p = tf.paragraphs[0]
    p.alignment = align
    run = p.add_run()
    run.text = text
    run.font.size = Pt(font_size)
    run.font.bold = bold
    run.font.italic = italic
    run.font.color.rgb = color
    run.font.name = "Calibri"
    return tb

def add_header(slide, title, subtitle=None):
    """Full-width dark blue header bar."""
    add_rect(slide, 0, 0, 13.333, 1.1, DARK_BLUE)
    # Accent stripe
    add_rect(slide, 0, 1.0, 13.333, 0.12, MED_BLUE)
    add_textbox(slide, 0.3, 0.1, 12.5, 0.85, title,
                font_size=32, bold=True, color=WHITE, align=PP_ALIGN.LEFT)
    if subtitle:
        add_textbox(slide, 0.3, 0.78, 12.5, 0.35, subtitle,
                    font_size=14, color=LIGHT_BLUE, align=PP_ALIGN.LEFT, italic=True)

def add_footer(slide, text="B.Pharm | HAP | Homeostasis"):
    add_rect(slide, 0, 7.15, 13.333, 0.35, DARK_BLUE)
    add_textbox(slide, 0.3, 7.16, 12.5, 0.3, text,
                font_size=11, color=LIGHT_BLUE, align=PP_ALIGN.CENTER)

def add_bullet_box(slide, x, y, w, h, title, bullets, title_color=WHITE,
                   box_color=MED_BLUE, text_color=DARK_GRAY, bullet_size=15):
    add_rect(slide, x, y, w, 0.42, box_color)
    add_textbox(slide, x+0.1, y+0.02, w-0.2, 0.38, title,
                font_size=16, bold=True, color=title_color)
    add_rect(slide, x, y+0.42, w, h-0.42, LIGHT_GRAY,
             line_color=MED_BLUE, line_width=0.5)
    tb = slide.shapes.add_textbox(
        Inches(x+0.15), Inches(y+0.47), Inches(w-0.3), Inches(h-0.6))
    tf = tb.text_frame
    tf.word_wrap = True
    for i, b in enumerate(bullets):
        p = tf.paragraphs[0] if i == 0 else tf.add_paragraph()
        p.space_before = Pt(3)
        run = p.add_run()
        run.text = f"• {b}"
        run.font.size = Pt(bullet_size)
        run.font.color.rgb = text_color
        run.font.name = "Calibri"

# ══════════════════════════════════════════════════════════════
# SLIDE 1 - TITLE SLIDE
# ══════════════════════════════════════════════════════════════
slide1 = prs.slides.add_slide(blank)

# Background gradient effect (two rects)
add_rect(slide1, 0, 0, 13.333, 7.5, DARK_BLUE)
add_rect(slide1, 0, 3.5, 13.333, 4.0, MED_BLUE)
add_rect(slide1, 0, 3.48, 13.333, 0.08, ACCENT_TEAL)

# Big title
add_textbox(slide1, 1.0, 1.2, 11.333, 1.5, "HOMEOSTASIS",
            font_size=60, bold=True, color=WHITE, align=PP_ALIGN.CENTER)
add_textbox(slide1, 1.0, 2.7, 11.333, 0.5,
            "Maintenance of a Stable Internal Environment",
            font_size=22, color=LIGHT_BLUE, align=PP_ALIGN.CENTER, italic=True)
add_rect(slide1, 3.5, 3.3, 6.333, 0.06, ACCENT_TEAL)

add_textbox(slide1, 1.0, 3.7, 11.333, 0.45,
            "Human Anatomy & Physiology (HAP)",
            font_size=20, bold=True, color=WHITE, align=PP_ALIGN.CENTER)
add_textbox(slide1, 1.0, 4.2, 11.333, 0.4,
            "B.Pharm First Year",
            font_size=17, color=LIGHT_BLUE, align=PP_ALIGN.CENTER)
add_textbox(slide1, 1.0, 5.5, 11.333, 0.4,
            "Reference: Medical Physiology (Boron & Boulpaep) | Ganong's Review of Medical Physiology",
            font_size=11, color=LIGHT_BLUE, align=PP_ALIGN.CENTER, italic=True)

# ══════════════════════════════════════════════════════════════
# SLIDE 2 - DEFINITION & CONCEPT
# ══════════════════════════════════════════════════════════════
slide2 = prs.slides.add_slide(blank)
add_rect(slide2, 0, 0, 13.333, 7.5, LIGHT_GRAY)
add_header(slide2, "What is Homeostasis?", "Definition & Historical Background")
add_footer(slide2)

# Definition box
add_rect(slide2, 0.4, 1.3, 12.533, 1.3, LIGHT_BLUE, MED_BLUE, 1)
add_textbox(slide2, 0.55, 1.35, 12.2, 1.2,
            "Homeostasis is the ability of the body to maintain a stable internal "
            "environment (milieu intérieur) despite constant changes in the external world.",
            font_size=18, color=DARK_BLUE, italic=True)

# Two columns
# Left: History
add_bullet_box(slide2, 0.4, 2.75, 5.8, 3.4,
               "Historical Background",
               ["Claude Bernard (1878): coined milieu intérieur — the stable fluid environment surrounding cells",
                "Walter Cannon: coined the term 'Homeostasis'",
                "Two environments: Milieu Extérieur (outside) vs Milieu Intérieur (internal fluid = ECF)",
                "The body acts like a greenhouse — protecting cells from external changes"],
               bullet_size=14)

# Right: Key Parameters
add_bullet_box(slide2, 6.55, 2.75, 6.383, 3.4,
               "Parameters Regulated",
               ["Blood glucose: 70–110 mg/dL",
                "Body temperature: 37°C (98.6°F)",
                "Blood pressure: ~120/80 mmHg",
                "Blood pH: 7.35–7.45",
                "Plasma K⁺: 3.5–5.0 mEq/L",
                "Plasma Ca²⁺: 8.5–10.5 mg/dL",
                "PaO₂: 80–100 mmHg"],
               bullet_size=14)

# ══════════════════════════════════════════════════════════════
# SLIDE 3 - FEEDBACK MECHANISMS
# ══════════════════════════════════════════════════════════════
slide3 = prs.slides.add_slide(blank)
add_rect(slide3, 0, 0, 13.333, 7.5, LIGHT_GRAY)
add_header(slide3, "Feedback Control Mechanisms", "Negative & Positive Feedback")
add_footer(slide3)

# Negative feedback title
add_rect(slide3, 0.4, 1.3, 8.0, 0.4, GREEN)
add_textbox(slide3, 0.5, 1.31, 7.8, 0.38,
            "A. Negative Feedback (Most Common)", font_size=16, bold=True, color=WHITE)

# Negative feedback bullets
add_rect(slide3, 0.4, 1.7, 8.0, 2.4, LIGHT_GRAY, line_color=GREEN, line_width=0.8)
neg_bullets = [
    "1. Sensor/Receptor — detects deviation (e.g., thermoreceptors)",
    "2. Set-point Comparator — compares value to normal reference",
    "3. Gain/Amplifier — error signal multiplied to produce output",
    "4. Effector — acts to OPPOSE the deviation and restore normal",
    "→ Output opposes input = system returns to set-point",
    "Example: ↑ Blood glucose → Insulin released → Glucose ↓ back to normal"
]
tb = slide3.shapes.add_textbox(Inches(0.55), Inches(1.75), Inches(7.7), Inches(2.3))
tf = tb.text_frame
tf.word_wrap = True
for i, b in enumerate(neg_bullets):
    p = tf.paragraphs[0] if i == 0 else tf.add_paragraph()
    p.space_before = Pt(4)
    run = p.add_run()
    run.text = b
    run.font.size = Pt(13)
    run.font.color.rgb = DARK_GRAY
    run.font.name = "Calibri"
    if "→" in b:
        run.font.bold = True
        run.font.color.rgb = GREEN

# Positive feedback
add_rect(slide3, 0.4, 4.25, 8.0, 0.4, ORANGE)
add_textbox(slide3, 0.5, 4.26, 7.8, 0.38,
            "B. Positive Feedback (Less Common)", font_size=16, bold=True, color=WHITE)
add_rect(slide3, 0.4, 4.65, 8.0, 1.8, LIGHT_GRAY, line_color=ORANGE, line_width=0.8)
pos_bullets = [
    "Output AMPLIFIES original signal (does NOT restore set-point)",
    "Always leads to an endpoint, not sustained regulation",
    "Examples: Childbirth (oxytocin & uterine contractions)",
    "             Blood clotting (coagulation cascade)",
    "             Action potential (Na⁺ influx → more Na⁺ channels open)"
]
tb2 = slide3.shapes.add_textbox(Inches(0.55), Inches(4.70), Inches(7.7), Inches(1.7))
tf2 = tb2.text_frame
tf2.word_wrap = True
for i, b in enumerate(pos_bullets):
    p = tf2.paragraphs[0] if i == 0 else tf2.add_paragraph()
    p.space_before = Pt(3)
    run = p.add_run()
    run.text = b
    run.font.size = Pt(13)
    run.font.color.rgb = DARK_GRAY
    run.font.name = "Calibri"

# Right side: Comparison table
add_rect(slide3, 8.7, 1.3, 4.233, 0.4, DARK_BLUE)
add_textbox(slide3, 8.8, 1.31, 4.1, 0.38,
            "Comparison", font_size=15, bold=True, color=WHITE)
table_data = [
    ("Feature", "Negative", "Positive"),
    ("Direction", "Opposes change", "Amplifies change"),
    ("Purpose", "Maintain steady state", "Reach an endpoint"),
    ("Stability", "Stable", "Unstable"),
    ("Frequency", "Very common", "Rare"),
]
row_colors = [DARK_BLUE, LIGHT_BLUE, LIGHT_GRAY, LIGHT_BLUE, LIGHT_GRAY]
text_colors = [WHITE, DARK_GRAY, DARK_GRAY, DARK_GRAY, DARK_GRAY]
for ri, (row, rc, tc) in enumerate(zip(table_data, row_colors, text_colors)):
    y = 1.7 + ri * 0.52
    add_rect(slide3, 8.7, y, 4.233, 0.5, rc, MED_BLUE, 0.3)
    for ci, cell in enumerate(row):
        x = 8.7 + ci * 1.41
        add_textbox(slide3, x+0.05, y+0.03, 1.35, 0.44, cell,
                    font_size=11, bold=(ri == 0), color=tc if ri == 0 else DARK_GRAY,
                    align=PP_ALIGN.CENTER)

# ══════════════════════════════════════════════════════════════
# SLIDE 4 - HOMEOSTATIC LOOP DIAGRAM (text-based flowchart)
# ══════════════════════════════════════════════════════════════
slide4 = prs.slides.add_slide(blank)
add_rect(slide4, 0, 0, 13.333, 7.5, LIGHT_GRAY)
add_header(slide4, "Homeostatic Control Loop", "Components & Flow (Negative Feedback)")
add_footer(slide4)

# Draw boxes representing the loop
boxes = [
    (0.5, 1.4, 2.8, 1.0, "STIMULUS\n(Deviation from normal)", ORANGE),
    (0.5, 3.0, 2.8, 1.0, "RECEPTOR/SENSOR\n(Detects change)", MED_BLUE),
    (0.5, 4.6, 2.8, 1.0, "CONTROL CENTER\n(Hypothalamus / Medulla)", DARK_BLUE),
    (4.5, 4.6, 2.8, 1.0, "EFFECTOR\n(Muscle / Gland / Organ)", MED_BLUE),
    (4.5, 3.0, 2.8, 1.0, "RESPONSE\n(Corrects Deviation)", GREEN),
    (4.5, 1.4, 2.8, 1.0, "RETURN TO\nNORMAL (Set-point)", ACCENT_TEAL),
]
for (bx, by, bw, bh, bt, bc) in boxes:
    add_rect(slide4, bx, by, bw, bh, bc)
    add_textbox(slide4, bx+0.05, by+0.05, bw-0.1, bh-0.1, bt,
                font_size=13, bold=True, color=WHITE, align=PP_ALIGN.CENTER)

# Arrows (using thin colored rectangles as arrows)
arrow_color = DARK_BLUE
# Down: Stimulus → Receptor
add_rect(slide4, 1.84, 2.4, 0.12, 0.6, arrow_color)
add_textbox(slide4, 1.6, 2.92, 0.6, 0.2, "▼", font_size=14, color=arrow_color, align=PP_ALIGN.CENTER)
# Down: Receptor → Control Center
add_rect(slide4, 1.84, 4.0, 0.12, 0.6, arrow_color)
add_textbox(slide4, 1.6, 4.52, 0.6, 0.2, "▼", font_size=14, color=arrow_color, align=PP_ALIGN.CENTER)
# Right: Control Center → Effector
add_rect(slide4, 3.3, 5.03, 1.2, 0.12, arrow_color)
add_textbox(slide4, 4.32, 4.9, 0.3, 0.3, "▶", font_size=14, color=arrow_color, align=PP_ALIGN.CENTER)
# Up: Effector → Response
add_rect(slide4, 5.84, 4.0, 0.12, 0.6, arrow_color)
add_textbox(slide4, 5.6, 3.82, 0.6, 0.2, "▲", font_size=14, color=arrow_color, align=PP_ALIGN.CENTER)
# Up: Response → Return to Normal
add_rect(slide4, 5.84, 2.4, 0.12, 0.6, arrow_color)
add_textbox(slide4, 5.6, 2.22, 0.6, 0.2, "▲", font_size=14, color=arrow_color, align=PP_ALIGN.CENTER)
# Negative feedback label
add_textbox(slide4, 3.1, 2.2, 2.0, 0.5,
            "← NEGATIVE FEEDBACK\n   (Opposes Change)",
            font_size=11, bold=True, color=RED, align=PP_ALIGN.CENTER)

# Example box on the right
add_rect(slide4, 8.5, 1.3, 4.433, 5.4, LIGHT_BLUE, MED_BLUE, 1)
add_rect(slide4, 8.5, 1.3, 4.433, 0.45, MED_BLUE)
add_textbox(slide4, 8.6, 1.31, 4.2, 0.43,
            "Example: Temperature Regulation", font_size=14, bold=True, color=WHITE)

temp_steps = [
    ("🌡 Stimulus:", "Body temp rises above 37°C"),
    ("👁 Sensor:", "Thermoreceptors in skin & hypothalamus"),
    ("🧠 Control:", "Anterior hypothalamus activated"),
    ("💪 Effector:", "Sweat glands + skin blood vessels dilate"),
    ("✅ Response:", "Heat dissipates → temperature falls"),
    ("🔁 Feedback:", "Thermoreceptors silenced → loop stops"),
]
for i, (label, val) in enumerate(temp_steps):
    y = 1.85 + i * 0.76
    add_rect(slide4, 8.55, y, 1.45, 0.65, DARK_BLUE)
    add_textbox(slide4, 8.58, y+0.02, 1.4, 0.61, label,
                font_size=11, bold=True, color=WHITE, align=PP_ALIGN.CENTER)
    add_rect(slide4, 10.0, y, 2.85, 0.65, LIGHT_GRAY, MED_BLUE, 0.3)
    add_textbox(slide4, 10.05, y+0.05, 2.75, 0.55, val,
                font_size=11, color=DARK_GRAY)

# ══════════════════════════════════════════════════════════════
# SLIDE 5 - HOMEOSTASIS VS EQUILIBRIUM + REDUNDANCY
# ══════════════════════════════════════════════════════════════
slide5 = prs.slides.add_slide(blank)
add_rect(slide5, 0, 0, 13.333, 7.5, LIGHT_GRAY)
add_header(slide5, "Key Concepts", "Steady State vs Equilibrium | Redundancy | Role of ANS")
add_footer(slide5)

# Comparison table
add_rect(slide5, 0.4, 1.3, 12.533, 0.42, DARK_BLUE)
for ci, (txt, xpos, wid) in enumerate([("Feature", 0.45, 2.5),
                                        ("Homeostasis (Steady State)", 2.97, 4.5),
                                        ("Equilibrium", 7.49, 5.0)]):
    add_textbox(slide5, xpos, 1.31, wid, 0.40, txt,
                font_size=14, bold=True, color=WHITE, align=PP_ALIGN.CENTER)

rows = [
    ("Energy Use", "Requires continuous ENERGY", "No energy needed"),
    ("Mechanism", "Active balancing of gains & losses", "Passive balance"),
    ("State", "Dynamic (constantly regulated)", "Static"),
    ("Example", "Blood glucose maintained at 90 mg/dL", "Gas equilbrium across membrane"),
]
row_bg = [LIGHT_BLUE, LIGHT_GRAY, LIGHT_BLUE, LIGHT_GRAY]
for ri, (row, rbg) in enumerate(zip(rows, row_bg)):
    y = 1.72 + ri * 0.52
    add_rect(slide5, 0.4, y, 12.533, 0.50, rbg, MED_BLUE, 0.3)
    for ci, (txt, xpos, wid) in enumerate(zip(row,
            [0.45, 2.97, 7.49], [2.5, 4.5, 5.0])):
        bold = (ci == 0)
        add_textbox(slide5, xpos, y+0.04, wid, 0.44, txt,
                    font_size=12, bold=bold, color=DARK_GRAY, align=PP_ALIGN.CENTER)

# Redundancy box
add_bullet_box(slide5, 0.4, 4.0, 5.8, 2.7,
               "Redundancy in Homeostasis",
               ["More vital = more regulatory systems",
                "If one system fails, others compensate",
                "Blood glucose: regulated by insulin, glucagon, epinephrine, cortisol, GH",
                "Explains why some genetic knockouts show no obvious effect"],
               box_color=ACCENT_TEAL, bullet_size=13)

# ANS role box
add_bullet_box(slide5, 6.55, 4.0, 6.383, 2.7,
               "Role of the ANS in Homeostasis",
               ["ANS + Endocrine system = primary executors",
                "Regulates: heart rate, BP, blood glucose, temp, electrolyte balance",
                "Airflow in bronchial tree, glandular secretions",
                "Hierarchy: Hypothalamus → Pituitary → Adrenal cortex → Cortisol → Blood glucose"],
               box_color=DARK_BLUE, bullet_size=13)

# ══════════════════════════════════════════════════════════════
# SLIDE 6 - HOMEOSTATIC IMBALANCE & DISEASES
# ══════════════════════════════════════════════════════════════
slide6 = prs.slides.add_slide(blank)
add_rect(slide6, 0, 0, 13.333, 7.5, LIGHT_GRAY)
add_header(slide6, "Homeostatic Imbalance", "When Homeostasis Fails → Disease")
add_footer(slide6)

add_textbox(slide6, 0.4, 1.25, 12.533, 0.4,
            "Failure to maintain homeostasis leads to disease or DEATH.",
            font_size=16, bold=True, color=RED, align=PP_ALIGN.CENTER)

diseases = [
    ("Blood Glucose\nRegulation", "Diabetes Mellitus\n(Type 1 & 2)", MED_BLUE),
    ("Temperature\nRegulation", "Hyperthermia\nHypothermia\nHeat Stroke", ORANGE),
    ("Water/Electrolyte\nBalance", "Dehydration\nEdema\nArrhythmias", ACCENT_TEAL),
    ("Blood Pressure\nRegulation", "Hypertension\nHypotension", RED),
    ("Acid-Base\nBalance", "Acidosis\nAlkalosis", GREEN),
    ("Kidney Function", "Renal Failure\nUremia\nAnemia", DARK_BLUE),
]
cols = 3
for i, (system, disease, color) in enumerate(diseases):
    col = i % cols
    row = i // cols
    x = 0.4 + col * 4.3
    y = 1.85 + row * 2.55
    add_rect(slide6, x, y, 4.0, 0.62, color)
    add_textbox(slide6, x+0.05, y+0.04, 3.9, 0.54,
                system, font_size=14, bold=True, color=WHITE, align=PP_ALIGN.CENTER)
    add_rect(slide6, x, y+0.62, 4.0, 1.78, LIGHT_BLUE, line_color=color, line_width=1)
    add_textbox(slide6, x+0.1, y+0.68, 3.8, 1.65,
                disease, font_size=14, color=DARK_GRAY, align=PP_ALIGN.CENTER)

# ══════════════════════════════════════════════════════════════
# SLIDE 7 - EXAM KEY POINTS SUMMARY
# ══════════════════════════════════════════════════════════════
slide7 = prs.slides.add_slide(blank)
add_rect(slide7, 0, 0, 13.333, 7.5, DARK_BLUE)
add_rect(slide7, 0, 1.15, 13.333, 0.08, ACCENT_TEAL)
add_textbox(slide7, 0.5, 0.15, 12.333, 0.95,
            "Key Points for Exams", font_size=34, bold=True,
            color=WHITE, align=PP_ALIGN.CENTER)
add_footer(slide7)

key_points = [
    "1. Homeostasis = maintenance of stable internal environment (milieu intérieur)",
    "2. Coined by Walter Cannon; milieu intérieur by Claude Bernard (1878)",
    "3. Negative feedback = MOST IMPORTANT; opposes deviation → restores set-point",
    "4. Positive feedback = amplifies deviation; used in childbirth, clotting, action potentials",
    "5. Four components: Sensor → Comparator → Effector → Response",
    "6. Homeostasis needs ENERGY — it is a steady state, NOT equilibrium",
    "7. Homeostatic imbalance → diseases: diabetes, hypertension, heat stroke, acidosis",
    "8. ANS + Endocrine system are primary controllers of homeostasis",
    "9. Redundancy: vital parameters have multiple overlapping control systems",
    "10. Hierarchy: Hypothalamus → Pituitary → Adrenals → Blood glucose",
]
cols2 = [key_points[:5], key_points[5:]]
for ci, col in enumerate(cols2):
    x = 0.4 + ci * 6.5
    tb = slide7.shapes.add_textbox(Inches(x), Inches(1.4), Inches(6.1), Inches(5.5))
    tf = tb.text_frame
    tf.word_wrap = True
    for i, kp in enumerate(col):
        p = tf.paragraphs[0] if i == 0 else tf.add_paragraph()
        p.space_before = Pt(8)
        run = p.add_run()
        run.text = kp
        run.font.size = Pt(15)
        run.font.color.rgb = WHITE if "MOST IMPORTANT" not in kp else ACCENT_TEAL
        run.font.name = "Calibri"
        run.font.bold = "MOST IMPORTANT" in kp or kp.startswith("3.")

# Save
out_path = "/tmp/workspace/homeostasis-ppt/Homeostasis_HAP_BPharm.pptx"
prs.save(out_path)
print(f"Saved: {out_path}")
python /tmp/workspace/homeostasis-ppt/create_ppt.py
ls -lh /tmp/workspace/homeostasis-ppt/Homeostasis_HAP_BPharm.pptx
Homeostasis HAP BPharm
Presentation · PPTX
What's Inside (7 Slides)
| Slide | Content |
|---|---|
| 1 | Title Slide - Subject & reference info |
| 2 | Definition, Historical Background (Claude Bernard / Cannon), Parameters Regulated |
| 3 | Negative vs Positive Feedback - detailed comparison table |
| 4 | Homeostatic Control Loop Diagram with Temperature Regulation Example step-by-step |
| 5 | Steady State vs Equilibrium, Redundancy, Role of ANS |
| 6 | Homeostatic Imbalance - diseases when homeostasis fails |
| 7 | Exam Key Points Summary (all 10 important points) |
Tips for Using the PPT
- Open in Microsoft PowerPoint or Google Slides (upload the .pptx)
- You can edit any text by clicking on the text boxes
- Colors used: dark blue for headers, green for negative feedback, orange for positive feedback, red for imbalance/diseases
- Slide 7 is a ready-made exam revision summary you can screenshot for quick reference