Oky now give me the complete guide for how to read x ray and ct scan . With pictures in full details.
Oky now give me the complete guide for how to read x ray and ct scan . With pictures in full details. It nursing and mbbs level
Reading File
Finding Sources
Finding Sources
Finding Sources
Finding Sources
Finding Sources
Reading File
Reading File
Reading File
Finding Sources
Finding Sources
Finding Sources
Reading File
Finding Sources
Finding Sources
Loading Image
Loading Image
Reading File
Reading File
Reading File
Loading Image
Reading File
Loading Image
Reading File
Reading File
Reading File
Loading Image
Reading File
Loading Image
Reading File
Loading Image
Reading File
I now have sufficient content from authoritative textbooks to write a comprehensive guide. Let me compile everything:
Complete Guide to Reading X-Rays and CT Scans
For Nursing & MBBS Students
Sources: Pfenninger & Fowler's Procedures for Primary Care | Grainger & Allison's Diagnostic Radiology | Harrison's Principles of Internal Medicine 22e
PART 1: CHEST X-RAY (CXR)
Section 1.1 - What Is an X-Ray and How Does It Work?
X-rays use ionizing radiation that passes through the body. Tissues absorb (attenuate) the beam differently depending on their density. The result is a 2D shadow image. There are 5 radiodensities to recognize:
| Density | Appears as | Example |
|---|---|---|
| Air | Black | Lung fields, bowel |
| Fat | Dark grey | Subcutaneous tissue |
| Water/Soft tissue | Grey | Heart, muscle, fluid |
| Bone | White | Ribs, clavicles, vertebrae |
| Metal | Bright white | Pacemakers, surgical clips |
Key rule: Two adjacent structures of the same density will not have a visible border between them. This is the basis of the silhouette sign.
Section 1.2 - Types of Chest X-Ray Views
| View | Full Name | When Used |
|---|---|---|
| PA | Posteroanterior - beam travels back to front | Standard outpatient view, patient stands, deep breath |
| AP | Anteroposterior - beam front to back | Bedside/ICU, supine patients |
| Lateral | Side view | Needed alongside PA; reveals retrocardiac/retrosternal lesions |
| Decubitus | Patient lying on side | Small effusions, confirm free fluid |
| Expiratory | Patient breathes out | Detecting small pneumothorax |
Important: Cardiomegaly definitions differ on PA vs AP. Never measure heart size on an AP film without noting the limitation.
Section 1.3 - The RIP Validity Check (Do This BEFORE Reading)
Before interpreting any film, assess technical quality using RIP:
R - Rotation
- Measure the distance from spinous processes to medial heads of each clavicle
- Should be equal bilaterally (a 2-3 mm difference is acceptable)
- Rotation distorts the mediastinum and heart size
I - Inspiration
- Count the posterior ribs where they join the spine
- A minimum adequate inspiration = 9 posterior ribs visible
- Poor inspiration causes false "fluffy" opacities mimicking CHF or pneumonia
P - Penetration (Exposure)
- Ideal: Intervertebral spaces visible down to the cardiac shadow but disappear beneath the diaphragm
- Overpenetrated: Looks too dark/"burnt out" - turns lung fields black, falsely negative
- Underpenetrated: Too white - misses findings
Section 1.4 - Normal PA Chest X-Ray
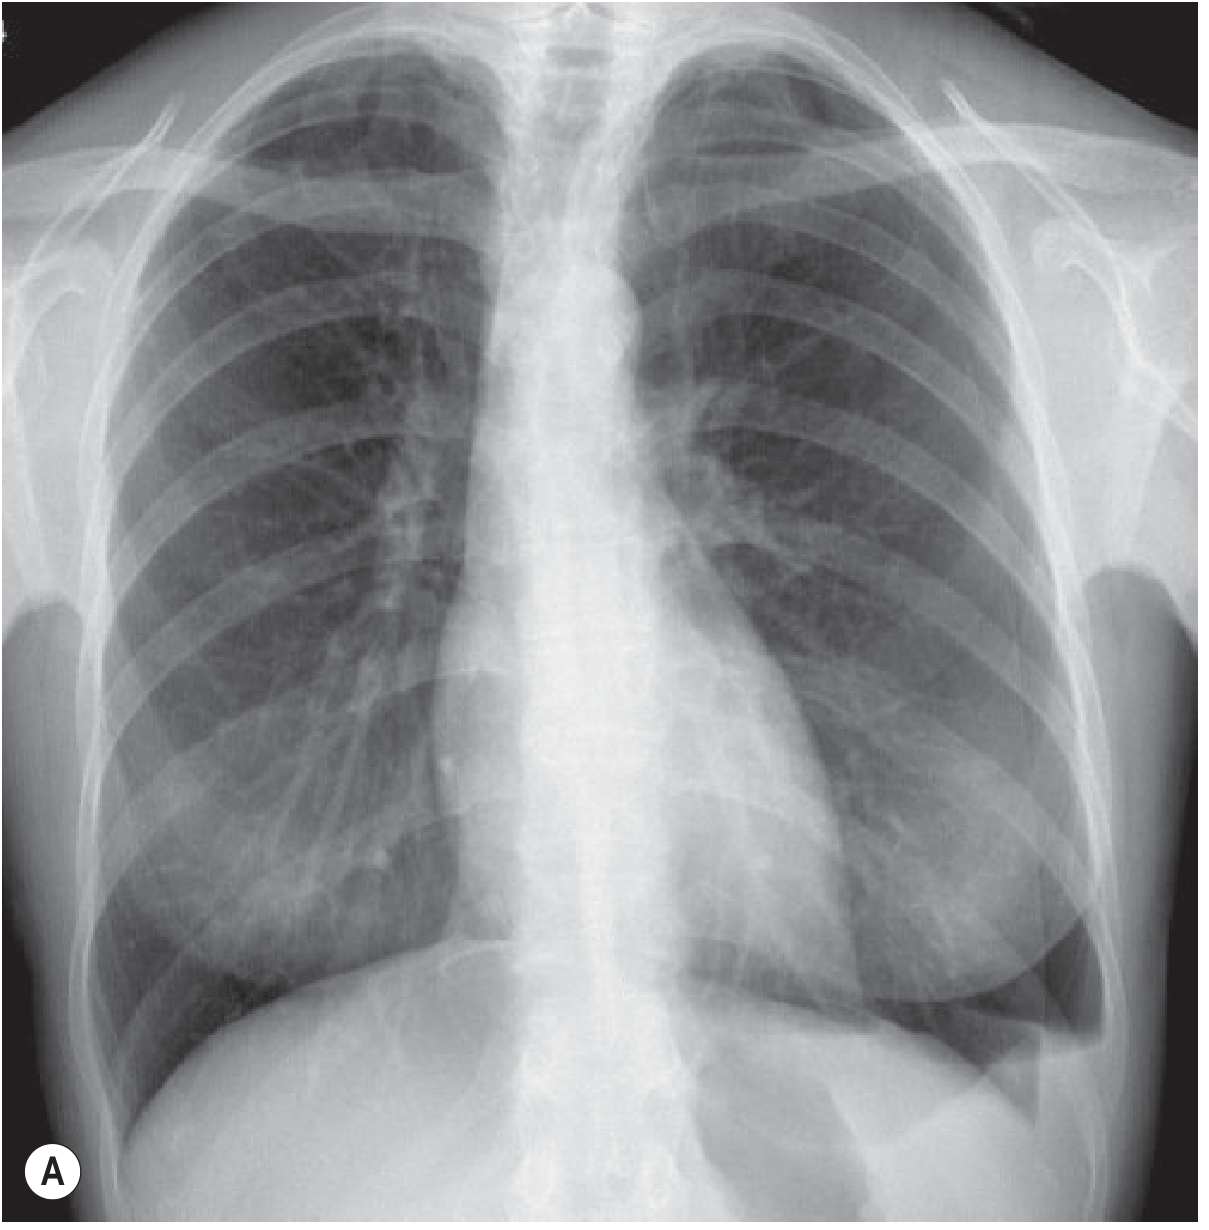
Normal PA chest X-ray. Both lung fields are clear and black (air-filled). The cardiac shadow occupies less than 50% of the thoracic width. Both costophrenic angles are sharp. The right hemidiaphragm is slightly higher than the left.
Section 1.5 - Lateral CXR Landmarks
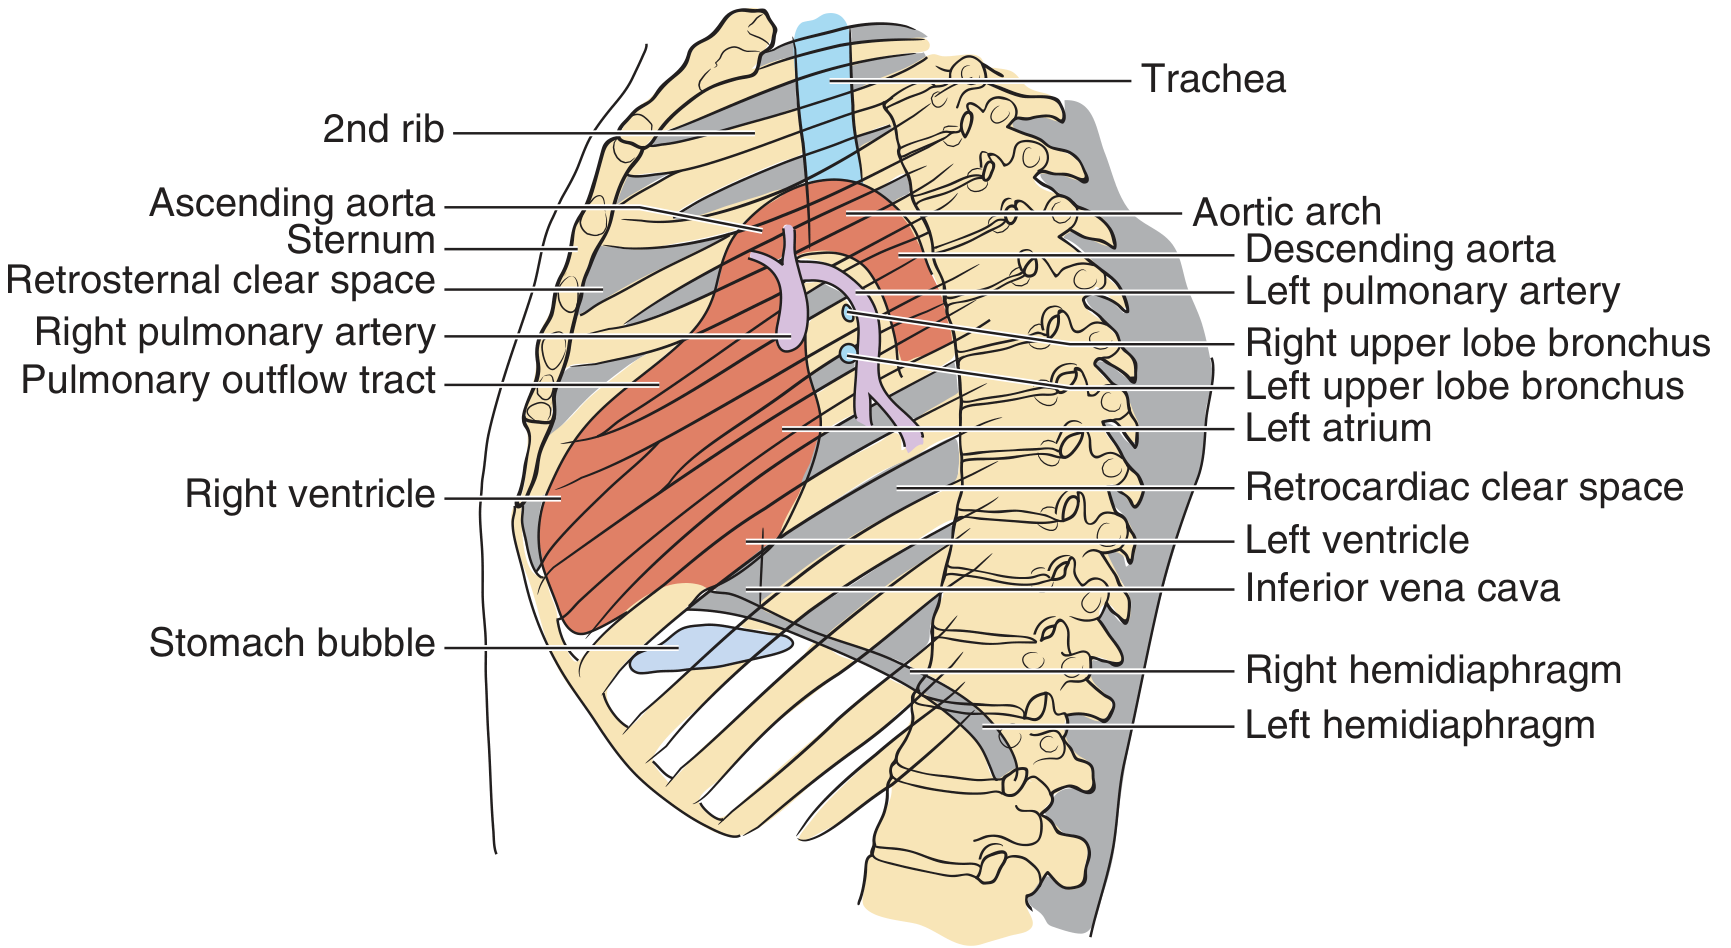
Lateral CXR anatomy. Always check: (1) retrosternal clear space - obliterated by RV enlargement or thyroid mass, (2) retrocardiac clear space - obscured by LV enlargement or lower lobe collapse, (3) spine - should get progressively darker (blacker) inferiorly; if it becomes whiter, there is a posterior lesion, (4) both diaphragms form acute posterior costophrenic angles.
Section 1.6 - The Systematic 7-Step Approach to CXR
Always read in a systematic order - never jump to the obvious abnormality first:
Step 1: Bones and Soft Tissues
- Scan all ribs (check for fractures, notching, destruction)
- Clavicles, scapulae, humeral heads, spine
- Soft tissue: breast shadows, subcutaneous emphysema, foreign bodies
- Rib fractures of ribs 1-2 = high-energy trauma, look for aortic injury
- Lower rib fractures = risk of liver/spleen injury
Step 2: Mediastinum
Trachea:
- Should be midline (may deviate slightly right at level of aortic arch - normal)
- Deviation AWAY from pathology = tension pneumothorax, large effusion
- Deviation TOWARD pathology = lung collapse, fibrosis, lobectomy
Width:
- Normal mediastinal width < 8 cm in adults
- Width > 25% of thoracic diameter = widened
- Widened mediastinum: aortic dissection, pericardial tamponade, lymphoma, thymoma, teratoma
- Children under 5 years: normally wide mediastinum due to thymus
Step 3: Cardiac Silhouette
Size (CTR - Cardiothoracic Ratio):
- Measure the maximum transverse diameter of the heart
- Divide by the widest thoracic diameter at the same level
- CTR > 50% on PA = cardiomegaly
- Important: this rule does NOT apply to AP films
Borders:
- Right heart border = right atrium
- Left upper border = aortic knob, pulmonary artery, left atrial appendage
- Left lower border = left ventricle
- Any blurring of a border = silhouette sign = adjacent pathology (pneumonia, collapse)
Silhouette Sign Examples:
| Lost border | Location of lesion |
|---|---|
| Right heart border (medial) | Right middle lobe pneumonia |
| Left heart border | Lingula pneumonia |
| Right hemidiaphragm | Right lower lobe consolidation |
| Left hemidiaphragm | Left lower lobe consolidation |
Step 4: Diaphragms
- Normal: right hemidiaphragm is 2-20 mm higher than the left (liver pushes it up)
- In >90% of people, right is higher than left
- Normal diaphragm position: at the level of the 5th-6th anterior rib on PA
- Air under diaphragm = surgical emergency = hollow viscus perforation
- Elevated hemidiaphragm: pneumonia, effusion, phrenic nerve palsy, subphrenic abscess
- Depressed/flat diaphragm: emphysema, severe asthma, tension pneumothorax
- Costophrenic angle (where lung meets diaphragm laterally): should be a sharp acute angle; blunting = pleural effusion (~200-500 mL needed to blunt it)
Step 5: Hila
- The hila are formed by the pulmonary arteries and veins
- Normal: left hilum is higher than the right in 70% of people; equal in 30%
- The right hilum is NEVER higher than the left normally
- Hilar enlargement: sarcoidosis (bilateral symmetric), lymphoma, TB, malignancy, pulmonary arterial hypertension
Step 6: Lung Parenchyma
Do a side-to-side "ping-pong" comparison of left vs right to spot asymmetry.
Opacities to recognize:
| Pattern | Description | Think of |
|---|---|---|
| Consolidation | Dense white opacity, may have air bronchograms | Pneumonia, haemorrhage, infarction |
| Interstitial | Hazy lines/reticulation throughout | Pulmonary oedema, ILD, lymphangitis |
| Nodule | Round opacity 5-30 mm | Granuloma, metastasis, primary lung Ca |
| Mass | Round opacity >30 mm | Malignancy (primary or secondary) |
| Cavitation | Opacity with central lucency | TB, abscess, cavitating cancer |
| Air bronchogram | Dark air-filled airways visible within opacity | Consolidation (not atelectasis/effusion) |
Vessel markings:
- Normal vessels stop 3-5 mm from the chest wall
- Cephalization of flow = vessels larger in upper zones than lower = heart failure
- Kerley B lines = horizontal lines at lung bases, 1-2 cm long = interstitial oedema
- Complete absence of vessels in one area = pneumothorax
Step 7: Pleura
Pleural Effusion:
- < 200 mL: may be undetectable on erect PA (use US or CT)
- 200-500 mL: blunts the posterior then lateral costophrenic angle
-
500 mL: classic meniscus (concave upper border, higher laterally than medially)
-
1000 mL: reaches the level of the 4th anterior rib
- Massive effusion: dense white hemithorax + contralateral mediastinal shift
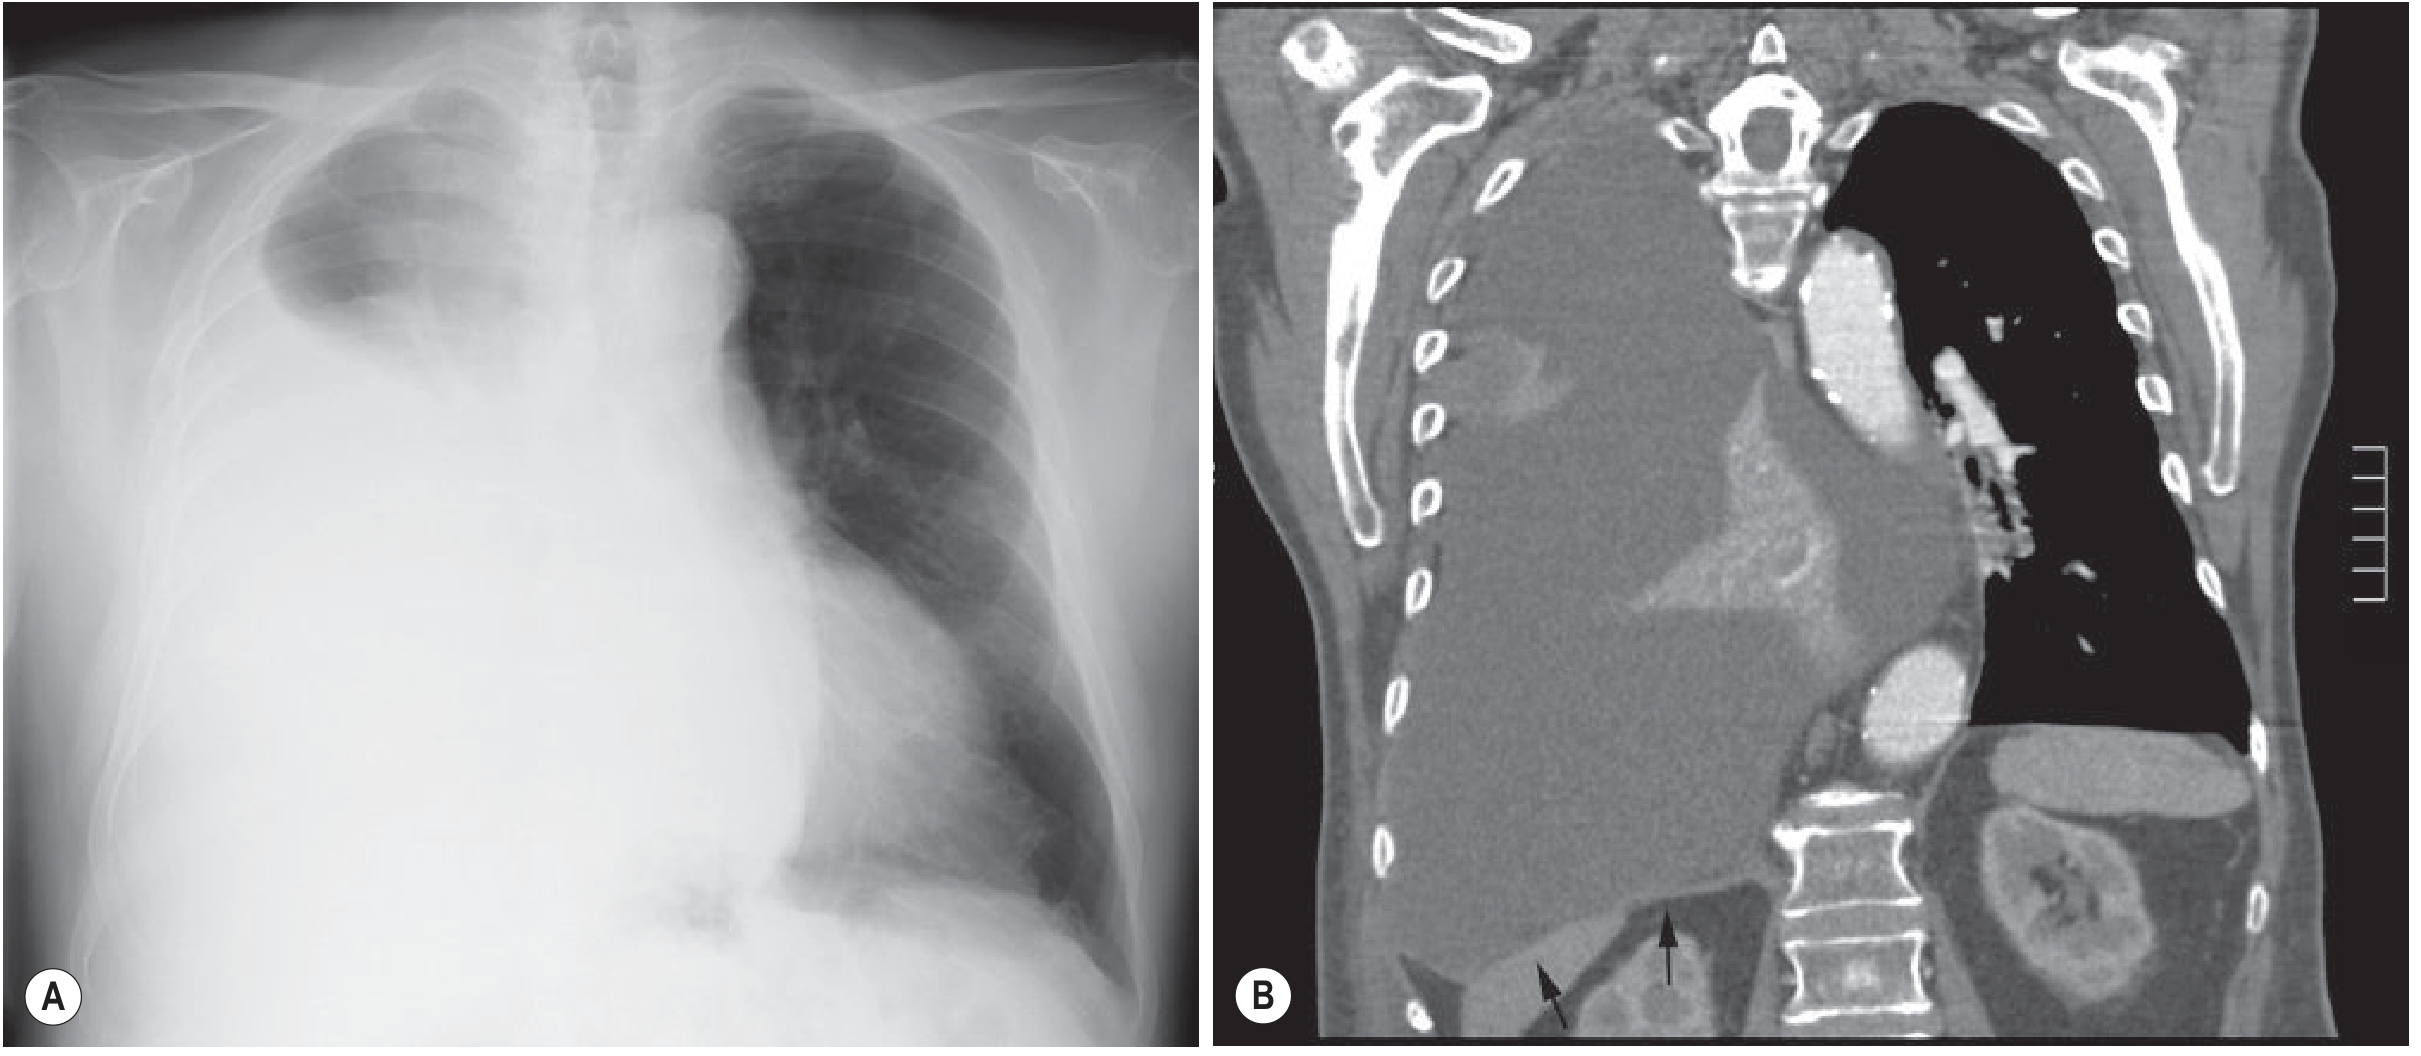
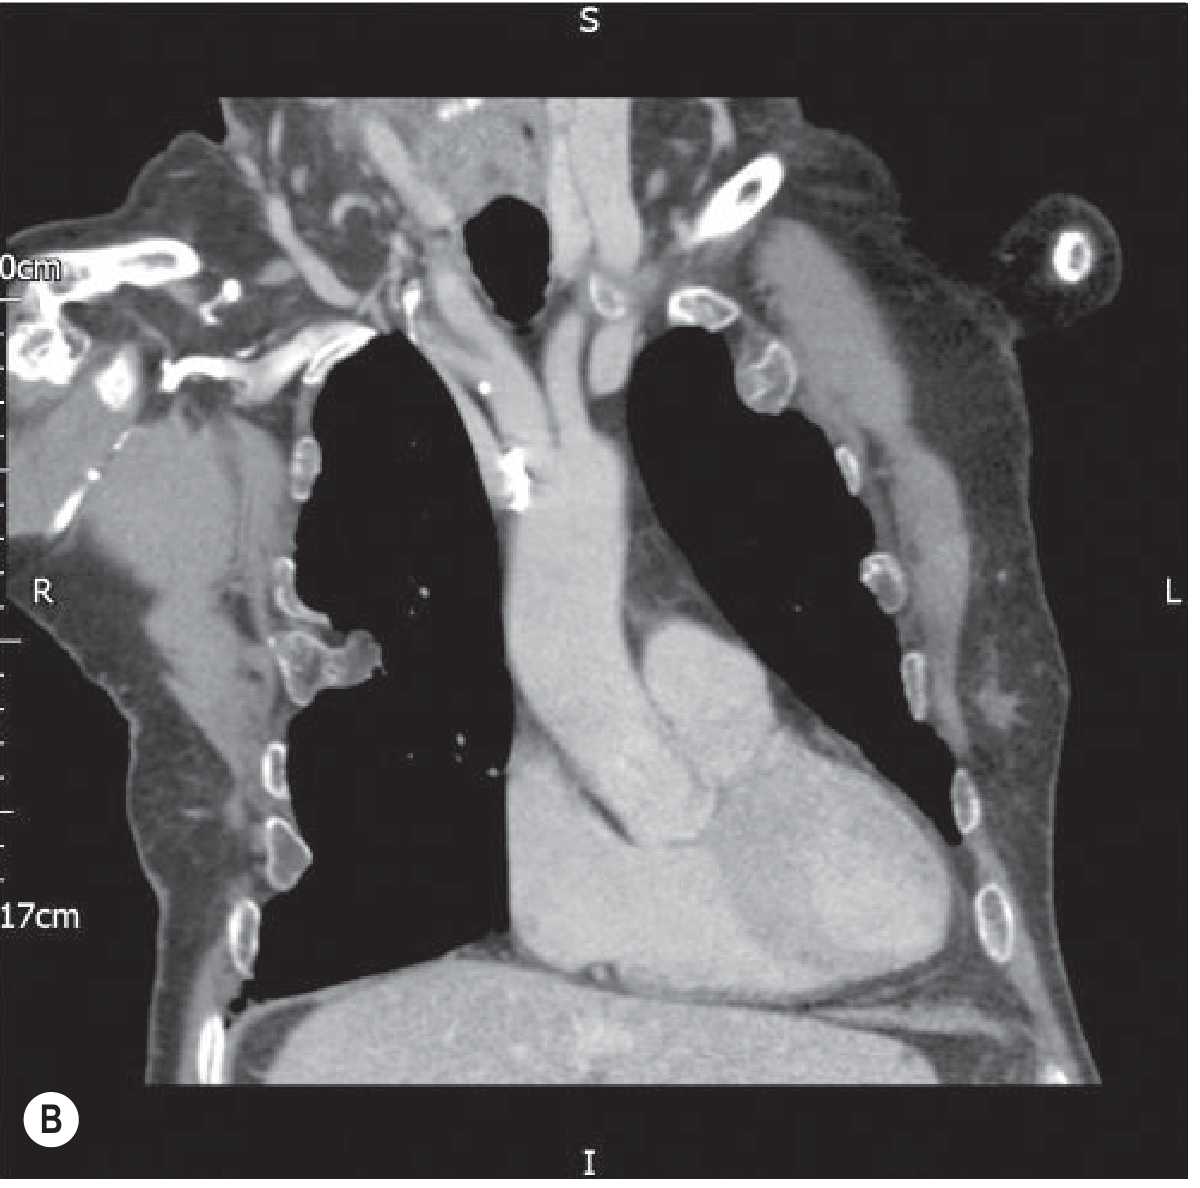
Left: Massive right pleural effusion on CXR - note the white opacification of the right hemithorax with mediastinal shift. Right: Coronal CT reconstruction confirming the massive effusion, compressed lung, and depressed right hemidiaphragm (arrows).
No mediastinal shift with a large effusion = think obstructive collapse of the same lung, or mesothelioma.
Pneumothorax:
- Look for a thin visceral pleural line at the apex, separated from the chest wall
- A transradiant (black) zone with NO vessel markings beyond the line
- Expiratory film accentuates small pneumothorax
- Skin folds mimic pneumothorax - the difference: skin fold lines extend beyond chest margin, have wide margins, and do not follow the lung edge
Left primary spontaneous pneumothorax at deep inspiration (A) and deep expiration (B). Note the black zone at the left apex devoid of vessel markings, and the visceral pleural line. The pneumothorax is more visible on the expiratory film.
Section 1.7 - Top 10 "Normal" Rules to Memorize
- Integrate history and clinical findings with the image
- Clavicular heads are equidistant from the spinous processes
- At least 9 posterior ribs visible on a normal PA inspiratory film
- Intervertebral spaces disappear beneath the diaphragm on a properly penetrated film
- Children under 5: normal wide mediastinum (thymus)
- Adults: mediastinum should not exceed 8 cm
- Left hilum is higher than the right (always)
- Right hemidiaphragm is higher than the left (always, normally)
- CTR > 50% on PA = cardiomegaly (this does not apply on AP)
- Absent vascular markings at lung periphery = pneumothorax until proven otherwise
PART 2: COMPUTED TOMOGRAPHY (CT SCAN)
Section 2.1 - How CT Works
CT uses the same X-ray principle but acquires images in a rotating arc around the patient, then reconstructs them into cross-sectional slices using computer algorithms. The result is a 3D dataset of the entire structure.
Hounsfield Units (HU) - the CT density scale:
| Tissue | HU value |
|---|---|
| Air | -1000 HU |
| Fat | -100 to -50 HU |
| Water | 0 HU |
| Soft tissue / blood | +20 to +80 HU |
| Fresh blood | > +35 HU |
| Clotted blood | ~+70 HU |
| Bone | +400 to +1000 HU |
CT scanners are regularly calibrated with water = 0 HU and air = -1000 HU as fixed reference points.
Section 2.2 - Window Settings (Critical Concept)
The HU range is far wider than the human eye can distinguish. Windows adjust which range of HU values is displayed. This does NOT change the data - only the display.
| Window | Level (centre) | What you're looking at |
|---|---|---|
| Lung window | ~-600 HU | Low-density lung parenchyma, airways, vessels |
| Mediastinal/soft tissue window | ~+40 HU | Heart, aorta, lymph nodes, pleura, mediastinum |
| Bone window | ~+400 HU | Ribs, spine, cortical bone details |
| Liver window | ~+60 HU | Abdominal organs, liver lesions |
On lung windows: everything denser than lung appears white. On mediastinal windows: the lung parenchyma appears black.
Section 2.3 - CT Orientations
CT images are viewed in three planes:
- Axial (transverse): cross-sections from head to toe - the most common view
- Coronal: front to back slices, like a PA X-ray but in 3D
- Sagittal: side-to-side slices, like a lateral X-ray but in 3D
Convention: Axial CT images are viewed as if looking up from the patient's feet - so the patient's right is on the viewer's LEFT.
Section 2.4 - The Secondary Pulmonary Lobule (CT Cornerstone)
The entire CT interpretation of the lung is built around this fundamental unit:
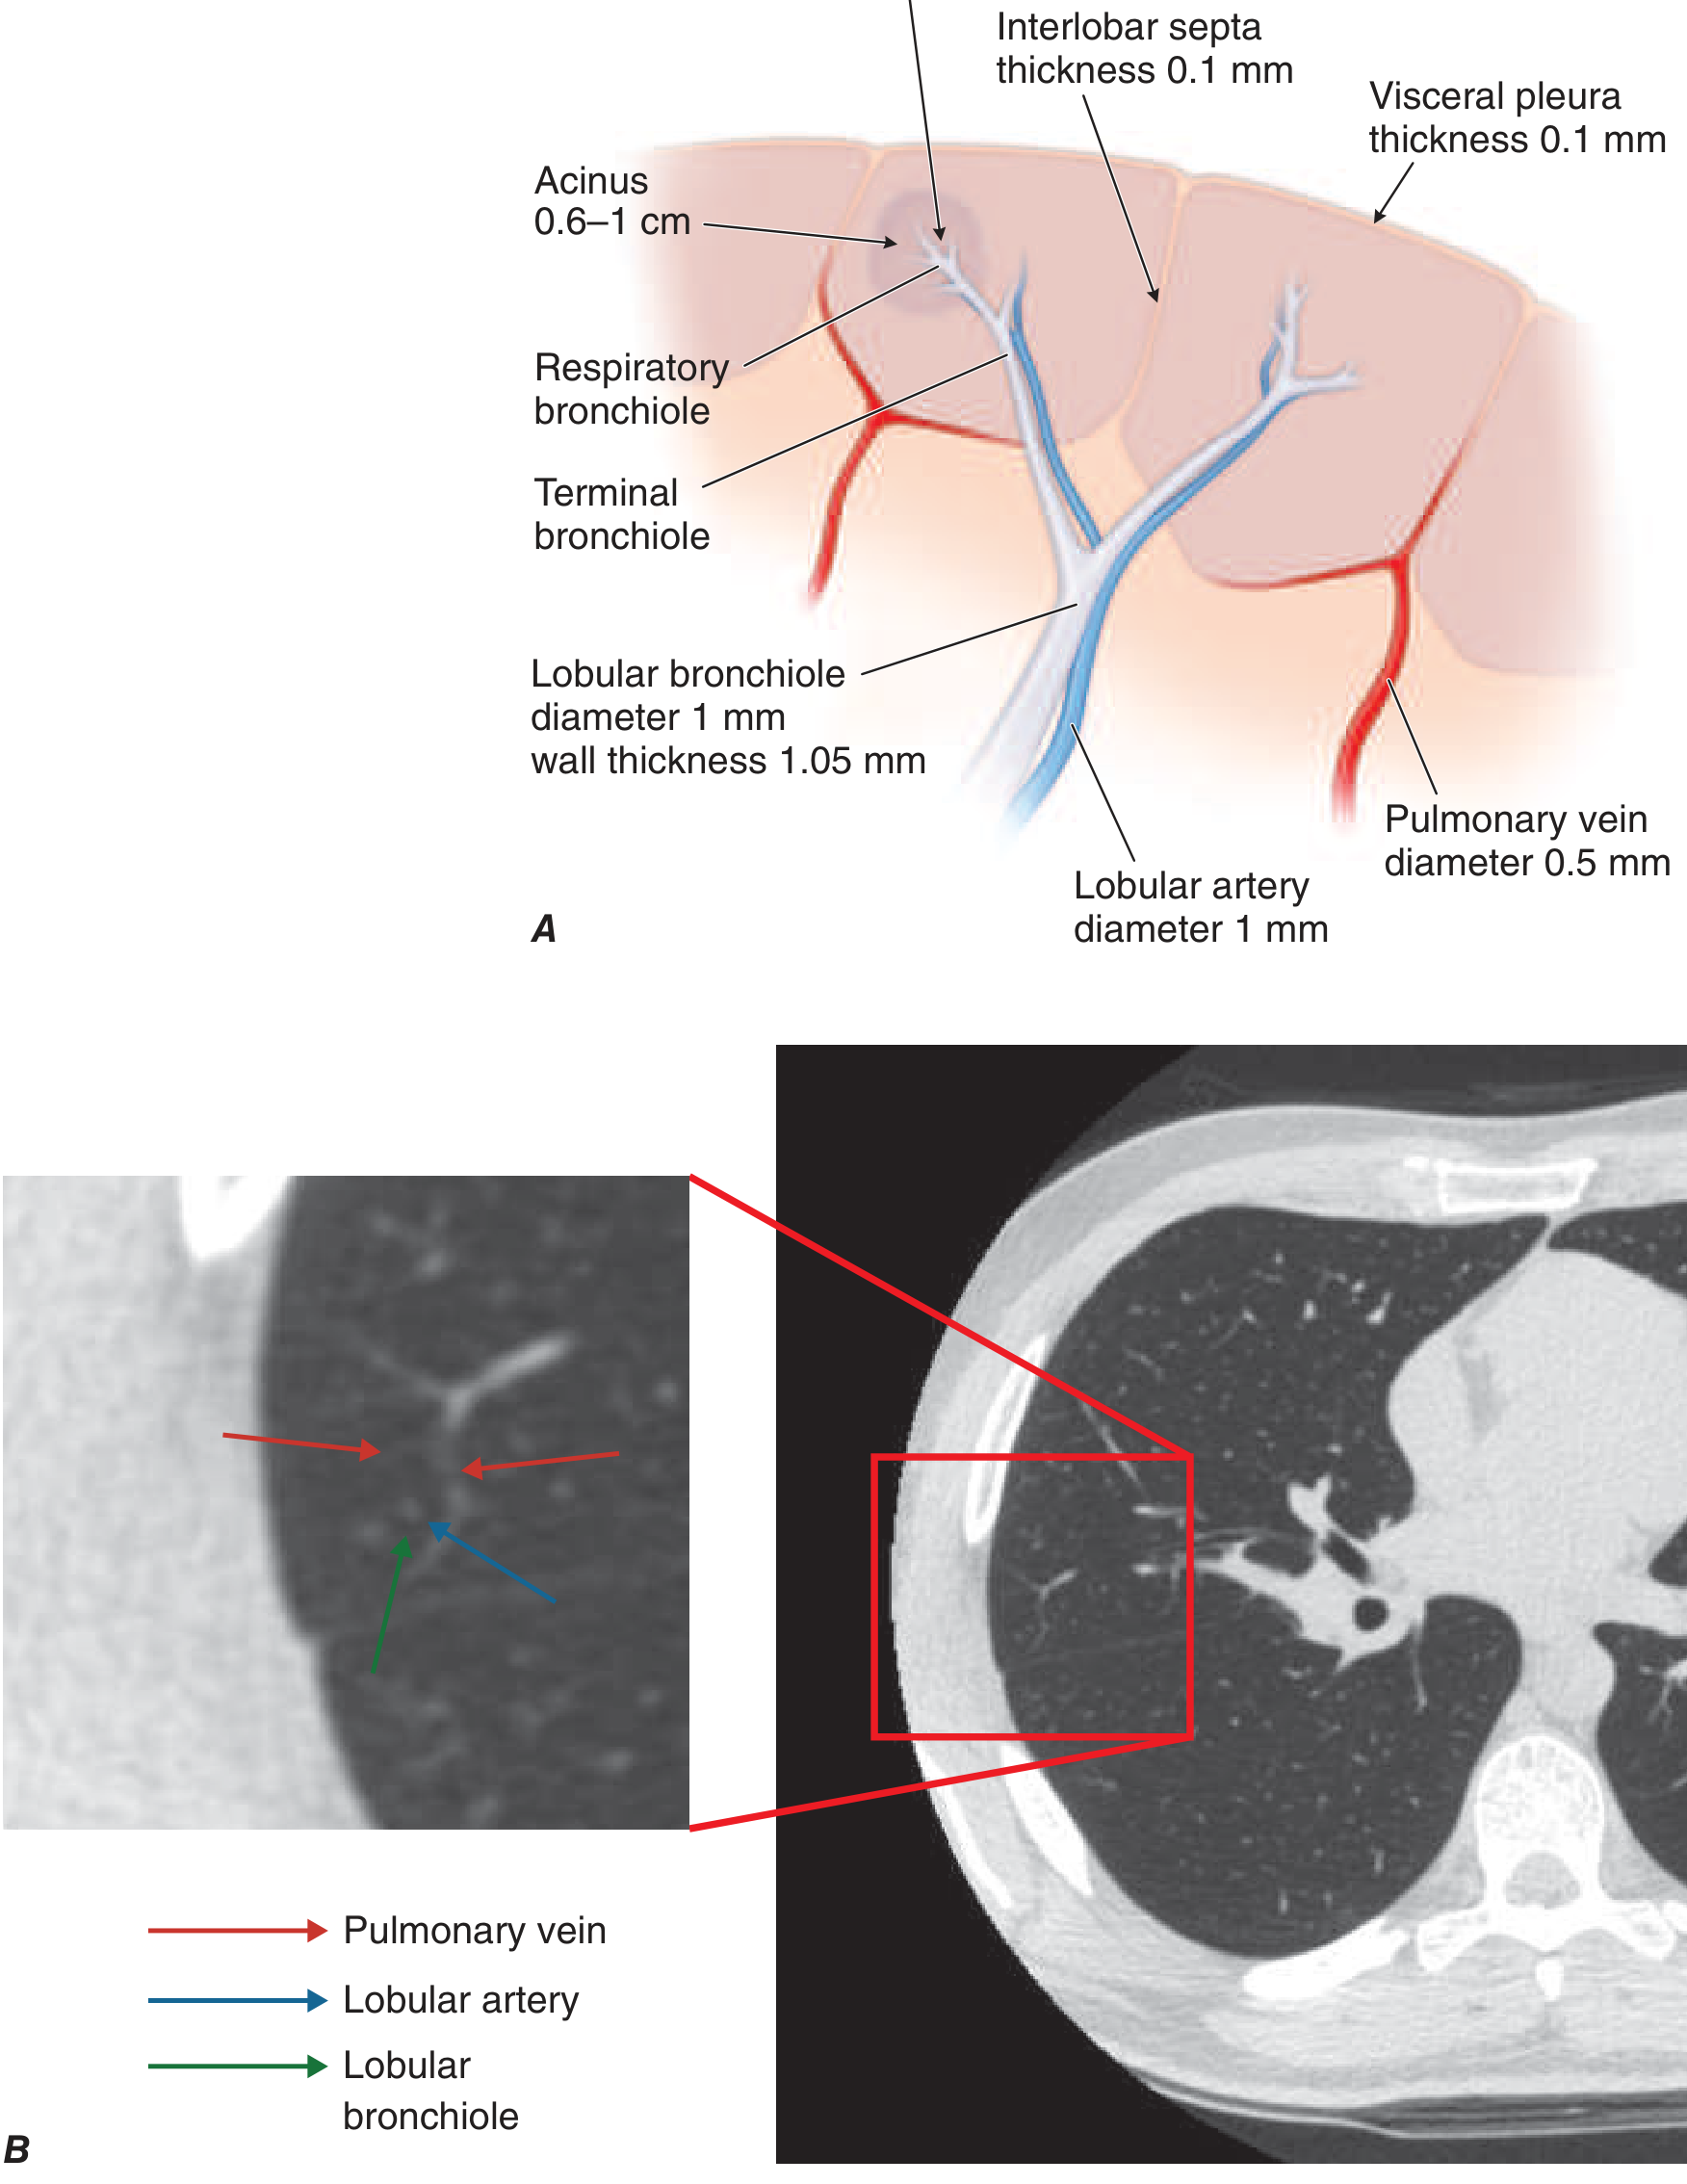
Secondary pulmonary lobule anatomy (A - diagram; B - CT with zoom). The lobule has a central airway (lobular bronchiole, 1 mm) + lobular artery (1 mm) at its core, and is bounded by interlobular septa (0.1 mm) carrying pulmonary veins.
Disease distribution based on lobule anatomy:
| CT Pattern | Lobule location | Disease |
|---|---|---|
| Centrilobular nodules | Central (airways) | Bronchiolitis, hypersensitivity pneumonitis, endobronchial spread of TB |
| Interlobular septal thickening | Peripheral septa | Pulmonary oedema (Kerley B lines), lymphangitis carcinomatosa, ILD |
| Ground glass opacity (GGO) | Alveoli partially filled | COVID-19, early pneumonia, IPF |
| Honeycombing | Peripheral destruction | End-stage fibrosis (UIP pattern) |
Section 2.5 - Emphysema Patterns on CT
| Pattern | Location | Disease |
|---|---|---|
| Centrilobular emphysema (CLE) | Upper lobe predominant | COPD (smoking) |
| Paraseptal emphysema (PSE) | Peripheral, subpleural | Young adults, spontaneous pneumothorax |
| Panlobular emphysema (PLE) | Lower lobe, diffuse | Alpha-1 antitrypsin deficiency |
Section 2.6 - Reading a CT Chest: Systematic Approach
Step through every structure on every window:
On Lung Windows:
- Airways - size, wall thickness, bronchiectasis?
- Lung parenchyma - consolidation, GGO, nodules, masses, cavities, emphysema?
- Distribution - upper, mid, lower zones; central vs peripheral; bilateral vs unilateral
- Pleura - effusion, thickening, pneumothorax
On Mediastinal Windows:
- Trachea and main bronchi
- Aorta and great vessels - aneurysm, dissection, PE (filling defects)
- Pulmonary artery - diameter > 3 cm suggests pulmonary hypertension
- Heart and pericardium
- Lymph nodes - mediastinal, hilar (normal short axis < 1 cm)
- Oesophagus
On Bone Windows:
- All ribs, sternum, spine - fractures, lesions, metastases
- Soft tissue emphysema around fracture sites
Coronal CT reconstruction of the normal chest (mediastinal window). The black areas are air-filled lungs. The white rounded structures are ribs in cross-section. The central grey mass is the heart. The dark trachea is visible at the top.
Section 2.7 - Key CT Findings for Common Pathologies
Pleural Effusion on CT
- CT is more sensitive than CXR - detects even small effusions
- Can distinguish free (follows gravity, crescentic) vs loculated (fixed, remains in position)
- Simple transudate: 0-20 HU
- Exudate/haemorrhage: > 35 HU
- Empyema vs simple effusion: CT shows pleural thickening + enhancement ("split pleura sign") + infiltration of extrapleural fat
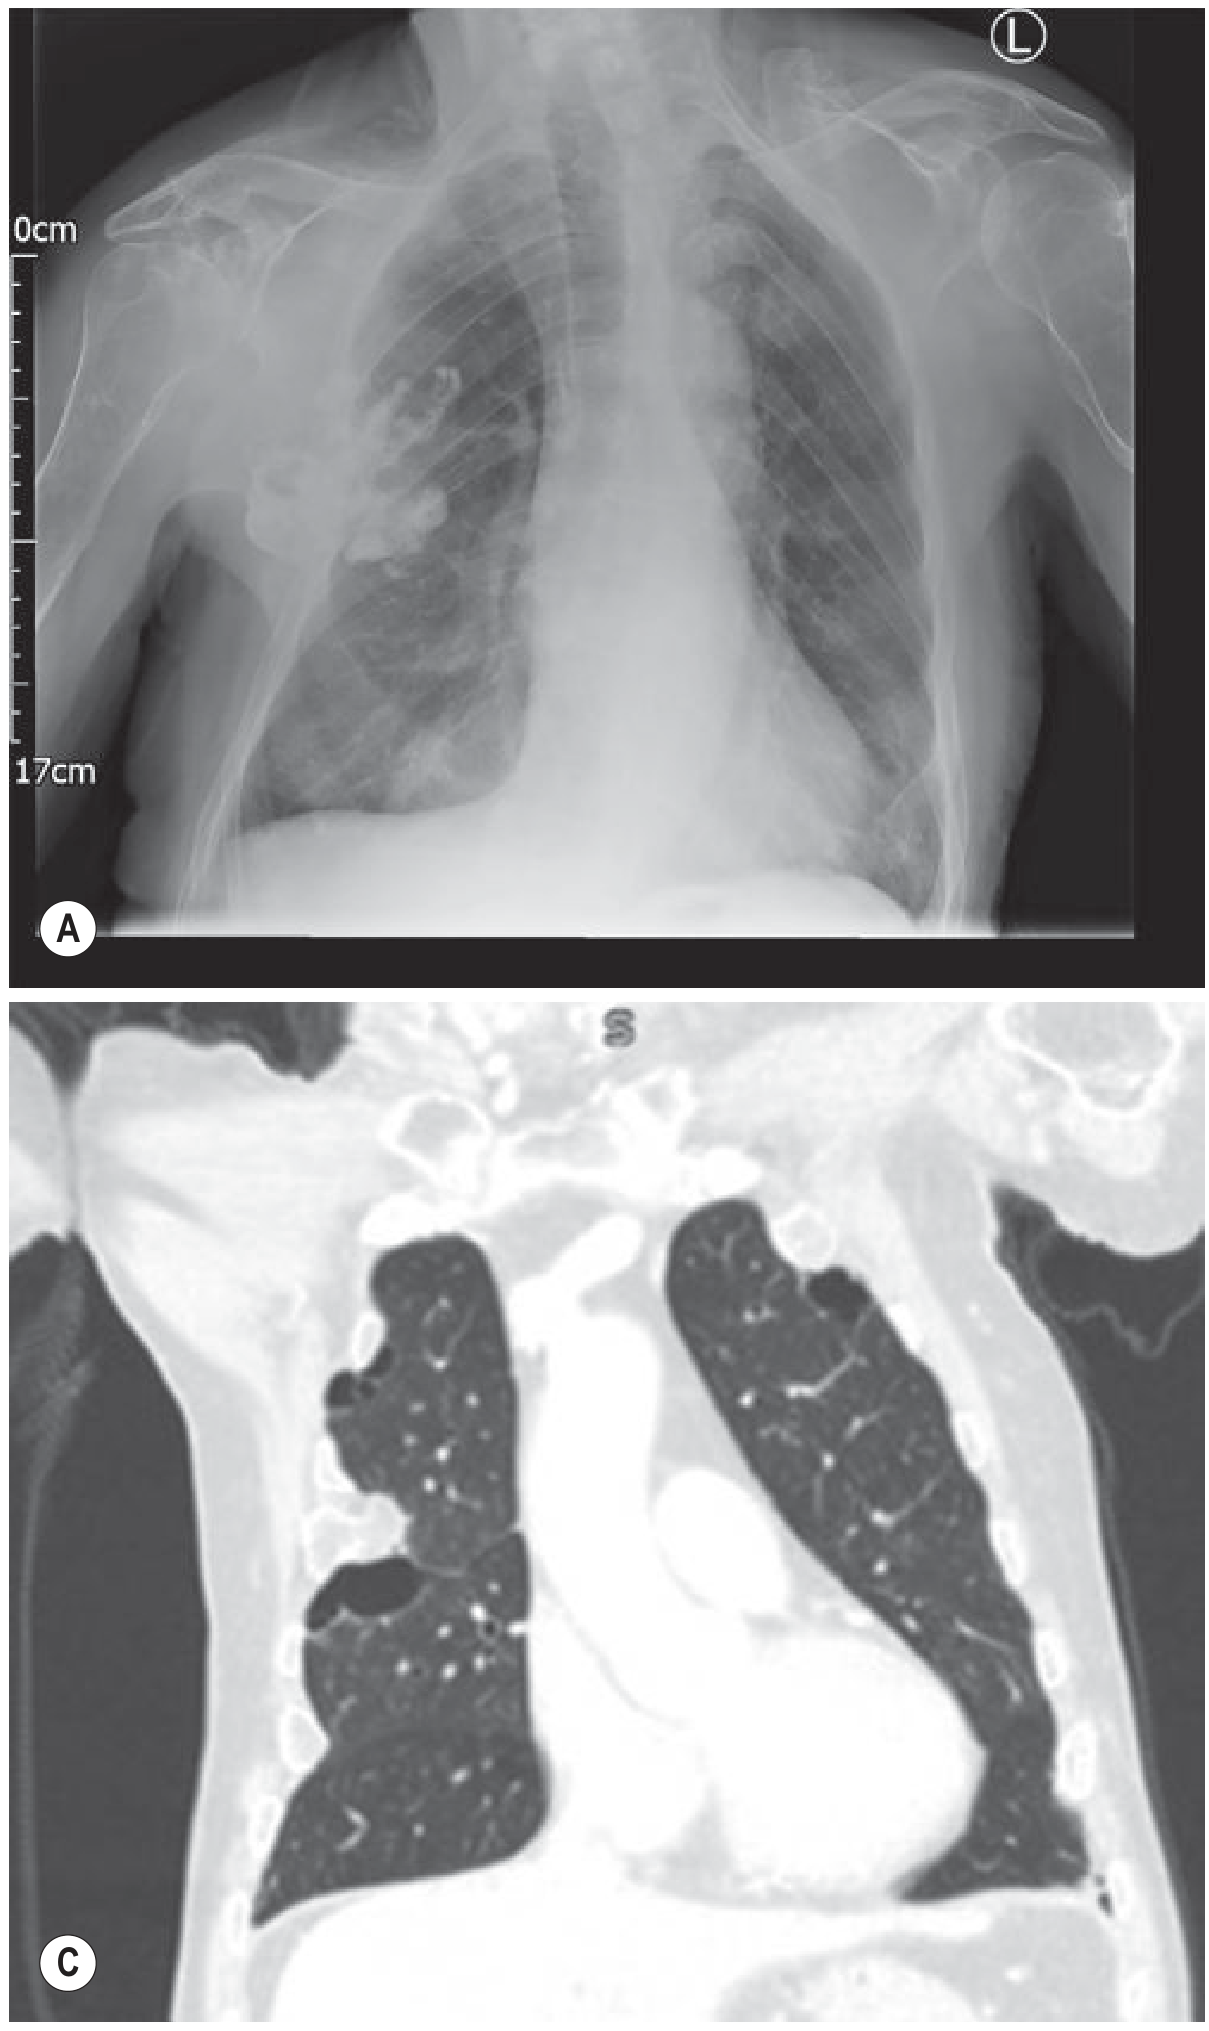
PA CXR (A) and CT lung window (C) showing bilateral pathology. CT allows direct characterisation of the fluid and distinction of pleural thickening/enhancement (empyema) from simple effusion.
Haemothorax on CT
- Fresh blood: > 35 HU
- Clotted blood: ~70 HU
- "Haematocrit effect" = layering in subacute stage (dense blood sinks, serum floats)
Pneumothorax on CT
- More sensitive than CXR for small/anterior pneumothoraces
- Anteromedial air collection in supine patients (missed on CXR)
- Used for detecting underlying cause (bullae, blebs)
Pulmonary Embolism (CTPA - CT Pulmonary Angiogram)
- Contrast-enhanced, timed to opacify pulmonary arteries
- PE appears as a filling defect (dark void) within a bright white contrast-filled vessel
- Central saddle PE vs segmental/subsegmental PE
- PA diameter > 3 cm = raised pulmonary artery pressure (suggests chronic PE)
Lung Nodule on CT
- Nodule 5-30 mm: solid, part-solid (ground-glass halo), or pure ground-glass
- Key features: size, density, margins (spiculated = malignant), calcification pattern
- Calcified granuloma = benign (popcorn, central, laminated calcification)
- Eccentric/stippled calcification = may be malignant
- Follow with serial CT (Fleischner Society guidelines)
Section 2.8 - CT Abdomen Basics
CT abdomen uses contrast in 3 phases:
| Phase | Timing after IV contrast | Best for |
|---|---|---|
| Arterial phase | 25-30 seconds | Aorta, arteries, hypervascular lesions (HCC, carcinoid) |
| Portal venous phase | 60-70 seconds | Liver parenchyma, veins, most solid organ pathology |
| Delayed phase | 3-5 minutes | Renal collecting system, urothelial lesions, bladder |
Key HU values for abdomen:
- Liver: +50 to +70 HU
- Simple cyst: 0-10 HU
- Lipoma: -100 to -50 HU (fat density, diagnostic)
- Adrenal adenoma (lipid-rich): < 10 HU unenhanced + > 60% washout on delayed phase
- Bone: > 400 HU
PART 3: Quick Reference Comparison Table
| Feature | X-Ray (CXR) | CT Scan |
|---|---|---|
| Radiation | Low | Higher (equivalent to ~100+ CXRs) |
| Speed | Fast, portable | Slower, requires scanner |
| Views | 1-2 2D projections | Full 3D reconstruction |
| Detail | Limited - overlapping structures | Excellent - cross-sectional |
| Best for | Initial screening, cardiac size, pneumothorax, effusion, consolidation | Complex pathology, PE, staging, trauma, nodules |
| Density scale | 5 visual densities | Hounsfield Units (precise, -1000 to +1000) |
| Pleural effusion detection | > 200-500 mL | Very small amounts |
| Mediastinal evaluation | Limited | Superior |
| Cost | Low | Higher |
PART 4: Common Mistakes to Avoid
- Reading before checking RIP - a rotated or poorly inspired film will lead to false findings
- Missing the silhouette sign - a blurred border means pathology adjacent to that structure
- Calling AP cardiomegaly - heart appears larger on AP; never diagnose cardiomegaly on AP alone
- Supine effusion confusion - in supine patients, fluid layers posteriorly and causes a diffuse haze, not a meniscus
- Skin folds mistaken for pneumothorax - check if the line extends beyond the chest wall
- Missing CT window changes - never read a CT on only one window; lung, mediastinal, and bone windows each reveal different pathologies
- Ignoring distribution - where the pathology sits in the lung (upper vs lower, central vs peripheral) narrows the diagnosis significantly
Sources: Pfenninger & Fowler's Procedures for Primary Care, 3rd Ed. | Grainger & Allison's Diagnostic Radiology | Harrison's Principles of Internal Medicine 22e | Bailey & Love's Short Practice of Surgery 28th Ed. | Goldman-Cecil Medicine
Find recent PubMed papers on advanced CT imaging techniques and protocols
Reading File
Searching PubMed
"computed tomography" AND "photon-counting" AND imaging
Searching PubMed
"CT protocol" AND "low dose" AND optimization
Searching PubMed
"dual energy CT" AND clinical AND imaging
Reading Article
Reading Article
Searching PubMed
"deep learning" AND "CT reconstruction" AND image quality
Searching PubMed
"CT angiography" AND protocol AND radiation dose
Reading Article
Reading Article
Reading Article
Searching PubMed
"iterative reconstruction" AND "CT" AND noise image quality
Reading Article
Reading Article
Reading Article
All key abstracts are in. Here is the full synthesized report:
Recent PubMed Literature: Advanced CT Imaging Techniques & Protocols
Search covering 2023-2026 | Highest-evidence publications only (Systematic Reviews & Meta-Analyses)
Theme 1: Photon-Counting CT (PCCT) - The Dominant Emerging Technology
Photon-counting CT (PCCT) - also called photon-counting detector CT (PCD-CT) - is the most active research area in CT right now. Unlike conventional energy-integrating detector CT (EID-CT), PCCT directly converts individual X-ray photons into electrical signals, enabling better spatial resolution, reduced noise, less radiation, and spectral (multi-energy) data from a single acquisition.
1a. PCCT for Lung Nodule Detection
[Systematic Review + Meta-Analysis · 2025] Mohammadzadeh S et al. Direct comparison of photon-counting CT and conventional CT in image quality of lung nodules. Eur J Radiol. PMID: 39842305
What they found:
- 13 studies, 718 patients, 362 lung nodules
- PCCT image quality score was +0.45 Likert points higher than EID-CT (95% CI 0.12-0.79)
- 54% of nodules had better image quality on PCCT; only 1.9% were worse
- PCCT delivered a 30.4% reduction in radiation dose (95% CI 19.1-41.7%)
- Authors recommend integrating PCCT into lung cancer screening programs
Bottom line: PCCT is significantly better than conventional CT for lung nodule visibility, with a meaningful radiation dose saving - directly relevant to lung cancer screening protocols.
1b. PCCT for Cardiac / Coronary Imaging
[Systematic Review · 2025] Rønning M et al. Photon-counting CT versus energy-integrating detectors for cardiac imaging. BMC Med Imaging. PMID: 40713483
What they found (11 human in-vivo studies):
- PCCT consistently delivered better diagnostic image quality at similar or lower radiation doses than EID-CT
- Key advantage: artifact reduction around calcifications (blooming artifacts - a major limitation of conventional CCTA)
- In some studies, contrast media volume was also reduced
- Subjective image quality was particularly enhanced; objective parameters (CNR, SNR) varied with protocol selection
- Authors call for larger, standardized trials to confirm clinical outcomes
[Systematic Review + Meta-Analysis · 2025] Kiani I et al. Photon-counting CT angiography vs energy-integrating CT angiography in coronary artery stenosis. BMC Med Imaging. PMID: 41315979
Quantitative findings (12 studies, 213 patients):
- PCD-CT showed a significant reduction in dose index (SMD = -0.62, p<0.001)
- Significant reduction in dose-length product (SMD = -0.66, p<0.001)
- Coronary artery calcium scoring was equivalent between the two (ICC = 0.992)
- PCD-CT showed less overestimation of stenosis from calcified plaques compared to EID-CT
- PCD-CT produced fewer beam-hardening artifacts around calcifications
Clinical impact: In cardiology, overestimating stenosis from calcium blooming leads to unnecessary invasive procedures. PCCT appears to address this directly.
Theme 2: Deep Learning Image Reconstruction (DLIR)
Traditional filtered back projection (FBP) is fast but noisy at low doses. Iterative reconstruction (IR) was an improvement, but introduced an artificial "plastic" texture. DLIR (using neural networks trained on high-quality reference images) now produces cleaner, more natural-looking images at even lower doses.
2a. DLIR vs FBP vs IR: Head and Chest CT
[Systematic Review · 2024] Chandran MO et al. Influence of DLIR algorithm for reducing radiation dose and image noise in head and chest CT. F1000Research. PMID: 38725640
Key findings (15 studies, 1,292 patients):
- DLIR improved image quality AND reduced noise AND reduced radiation dose in both head and chest CT
- 14/15 studies were rated high quality
- DLIR outperformed both IR and FBP in all three outcomes
- The main concern with high-strength DLIR: mild signal loss and blurring of fine structures
Commercial DLIR algorithms currently in clinical use:
- True Fidelity (TF) - GE HealthCare
- AiCE (Advanced intelligent Clear-IQ Engine) - Canon Medical
2b. DLIR in Abdominal CT
[Systematic Review + Meta-Analysis · 2023] Shehata MA et al. Deep-learning CT reconstruction in clinical abdominal scans. Abdom Radiol. PMID: 37280374
Key findings (44 studies, True Fidelity n=32, AiCE n=12):
- DLR produced 22-57.3% less noise compared to iterative reconstruction
- Radiation dose reduction potential: 35.1-78.5%
- Improved contrast-to-noise ratio and lesion detectability
- Benefits also seen in dual-energy CT acquisitions
- For liver lesions >5 mm: preserved detection at CTDIvol as low as 6.8 mGy (BMI 23.5)
- For small lesions (<5 mm) or lesion characterization: CTDIvol of 13.6-34.9 mGy needed depending on patient BMI
- Caution: High reconstruction strength can cause subtle blurring - clinical operators must calibrate strength to indication
2c. DLIR for Chest CT (2026 data)
[Systematic Review · 2026] Obhuli CM et al. Clinical value of deep learning image reconstruction in chest CT. Clin Radiol. PMID: 41411962
This paper (January 2026) confirms DLIR as the current standard for chest CT reconstruction, showing consistent image quality advantages over IR and FBP across clinical chest applications.
Theme 3: Deep Learning for Metal Artifact Reduction (DL-MAR)
Metal implants (joint prostheses, dental hardware, spinal rods, pacemakers) cause severe streak artifacts on CT that can mask pathology.
[Systematic Review · 2024] Kleber CEJ et al. Advancements in supervised deep learning for metal artifact reduction in CT. Eur J Radiol. PMID: 39265203
Key findings (14 studies):
- DL-MAR algorithms operate in three domains: sinogram domain, image domain, and dual domain (combining both)
- 13/14 algorithms showed higher PSNR and SSIM (better image quality metrics) vs uncorrected images AND vs non-DL MAR
- DL-MAR outperforms conventional projection-interpolation MAR methods
- Gap: Lack of standardized methodology makes head-to-head comparison between algorithms difficult; most validation is in phantoms, not real clinical datasets
Theme 4: Dual-Energy CT (DECT) - Expanding Clinical Applications
DECT acquires images at two different photon energies simultaneously, enabling material decomposition - distinguishing substances with similar HU values on conventional CT.
4a. DECT Distinguishing Brain Hemorrhage from Contrast Staining
[Systematic Review + Meta-Analysis · 2025] Ji W & Shi Y. Diagnostic performance of DECT for differentiating acute intracranial hemorrhage from contrast staining. Front Med. PMID: 41789182
Clinical context: After stroke thrombectomy, contrast staining and hemorrhagic transformation look identical on conventional CT. This distinction changes management completely.
Pooled diagnostic performance of DECT (12 studies, 561 patients):
| Metric | Pooled Value |
|---|---|
| Sensitivity | 0.90 (95% CI 0.79-0.96) |
| Specificity | 0.98 (95% CI 0.94-1.00) |
| Diagnostic Odds Ratio | 154.76 |
| AUC | 0.99 (95% CI 0.97-0.99) |
Near-perfect AUC of 0.99 makes DECT a strongly recommended tool in post-thrombectomy imaging. Performance was highest in patients >65 years and in studies published after 2015.
4b. DECT Endoleak Detection After EVAR
[Meta-Analysis · 2025] Wen CX et al. Diagnostic accuracy of DECT for endoleak detection after endovascular aneurysm repair. Eur Radiol. PMID: 40483293
DECT's iodine mapping capability allows detection of low-flow endoleaks that are invisible on standard CT, potentially replacing the need for multiple contrast phases and reducing total radiation burden in surveillance imaging.
Theme 5: Protocol Optimization - Low-Dose CTPA
[Systematic Review + Meta-Analysis · 2026] Supritha S et al. Reduction of radiation dose and contrast volume in CTPA. J Med Imaging Radiat Sci. PMID: 41237681
Findings (35 studies, 11 with complete data):
- Low tube voltage protocols (≤80 kVp) + reduced contrast volume (≤60 mL) + iterative reconstruction
- Achieved 50-80%+ reduction in CTDIvol while preserving diagnostic image quality
- SNR, CNR, and vascular attenuation all remained within diagnostic limits
- Particularly important for patients at risk of contrast-induced nephropathy or with radiation sensitivity (young patients, pregnancy)
- Recommended as routine practice for CTPA
ALARA principle in action: Standard CTPA protocols using 80 kVp + ≤60 mL contrast + IR reconstruction should now be the default in most patients.
Theme 6: Tin-Filtered Low-Dose CT
[Systematic Review · 2025] Bellizzi A et al. Optimisation of non-contrast CT using tin (Sn) filtration. Radiography. PMID: 40669409
Tin filtration (Sn prefix on Siemens scanners, e.g. Sn100 kVp) shifts the X-ray beam to higher energies, dramatically reducing dose while maintaining adequate image quality for specific indications (kidney stone detection, chest screening, calcium scoring). Emerging as a standard low-dose option for selected protocols.
Summary Table: Key Papers at a Glance
| Theme | Paper | PMID | Year | Key Takeaway |
|---|---|---|---|---|
| PCCT - Lung nodules | Mohammadzadeh et al. | 39842305 | 2025 | +0.45 quality score, -30% dose vs conventional CT |
| PCCT - Cardiac | Rønning et al. | 40713483 | 2025 | Better image quality, less calcium blooming artifacts |
| PCCT - Coronary CTA | Kiani et al. | 41315979 | 2025 | -0.62 SMD dose index; less stenosis overestimation |
| DLIR - Head/Chest | Chandran et al. | 38725640 | 2024 | DLIR > IR > FBP for image quality and dose |
| DLIR - Abdomen | Shehata et al. | 37280374 | 2023 | 35-78% dose reduction; preserves lesion detection |
| DL Metal Artifact | Kleber et al. | 39265203 | 2024 | DL-MAR outperforms conventional MAR |
| DECT - Brain | Ji & Shi | 41789182 | 2025 | AUC 0.99 for hemorrhage vs contrast staining |
| DECT - Endoleak | Wen et al. | 40483293 | 2025 | High accuracy for post-EVAR surveillance |
| Low-dose CTPA | Supritha et al. | 41237681 | 2026 | 80 kVp + ≤60 mL contrast → 50-80% dose cut |
Key Trends Across All Papers
-
PCCT is replacing conventional CT in high-end centers - the technology is now validated in lung, cardiac, and vascular applications with better quality AND lower dose simultaneously.
-
DLIR is the new reconstruction standard - filtered back projection is obsolete for clinical use; DLIR is now replacing iterative reconstruction due to better noise texture, less dose, and superior lesion detection.
-
The ALARA principle is driving protocol redesign - every major CT application (chest, CTPA, cardiac, abdomen) has published evidence supporting 30-80% dose reduction without diagnostic compromise.
-
Dual-energy CT has found its clinical niche - material decomposition for post-stroke imaging and post-EVAR surveillance are now evidence-backed indications with very high diagnostic accuracy.
-
AI/Deep learning is permeating every CT step - from reconstruction (DLIR) to artifact reduction (DL-MAR) to nodule detection, AI tools are no longer experimental but validated in systematic reviews.
This is a shared conversation. Sign in to Orris to start your own chat.