
Human leukocyte Antigen
HLA human leukocyte antigen MHC structure diagram
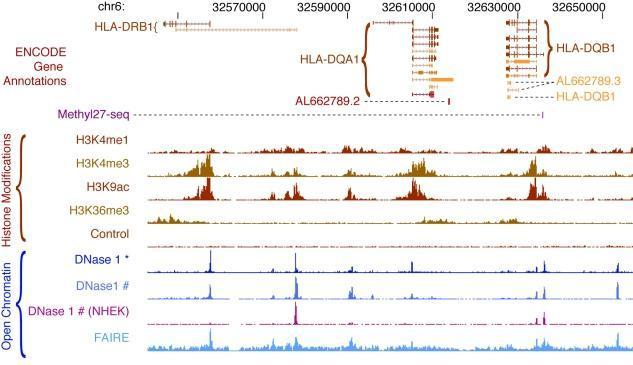
This genomic visualization displays ENCODE chromatin annotations within a 114 kb region of the human HLA locus on chromosome 6, focusing on the HLA-DRB1, HLA-DQA1, and HLA-DQB1 genes. The diagram utilizes a genome browser format to illustrate the relationship between gene structure, DNA methylation, histone modifications, and chromatin accessibility in the GM12878 lymphoblastoid cell line. The top tracks delineate gene isoforms and non-coding transcripts, followed by a Methyl27-seq track showing CpG methylation at the HLA-DQB1 promoter. Histone modification tracks (H3K4me1, H3K4me3, H3K9ac, and H3K36me3) reveal transcriptional regulatory patterns: H3K4me3 and H3K9ac exhibit sharp peaks at transcriptional start sites, while H3K4me1 shows broader enrichment indicative of enhancers. The bottom section details open chromatin regions via DNase I hypersensitivity (using two protocols) and FAIRE-seq signals, highlighting regulatory hubs. A comparative DNase I track for the NHEK cell line demonstrates cell-type-specific variations in chromatin accessibility. This visualization serves as an educational tool for understanding the complex epigenetic regulation of the Human Leukocyte Antigen (HLA) system.

This Comparison Chart illustrates a sequence alignment of Human Leukocyte Antigen (HLA) class II alleles, specifically comparing HLA-DRB1*08:01 and HLA-DRB1*08:02 using data from the IPD-IMGT/HLA database. The visualization utilizes a reference-based layout: the top row provides the full amino acid sequence in single-letter notation, while the subsequent rows represent specific alleles. In these lower rows, dashes indicates identity with the reference sequence, while letters denote amino acid substitutions. Colored boxes highlight critical areas of polymorphism. An orange box highlights a Glycine (G) residue at position 13; a red box emphasizes a position 57 variation where a Serine (S) or Aspartic Acid (D) is present, which is clinically significant for peptide binding affinity and disease susceptibility (e.g., COVID-19 and leprosy); and a light blue box marks a Leucine (L) residue at position 74. This diagram is designed for advanced immunology and genetics education, demonstrating how minor sequence variations in the beta-helix domain of HLA molecules can influence clinical outcomes and autoimmune risk.
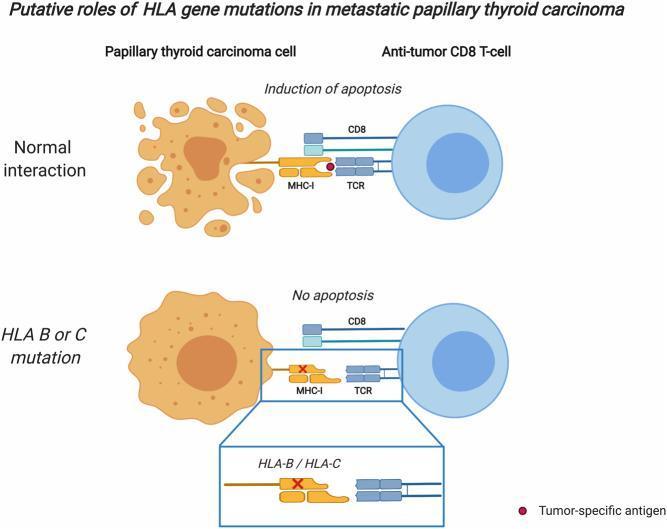
This medical schematic illustrates the mechanism of immune escape in metastatic papillary thyroid carcinoma (PTC) through HLA gene mutations. The diagram is divided into two comparative sections: 'Normal interaction' and 'HLA B or C mutation'. In the 'Normal interaction' section, a papillary thyroid carcinoma cell successfully presents a tumor-specific antigen (red circle) via its MHC class I (MHC-I) receptor. An anti-tumor CD8+ T-cell recognizes this complex through its T-cell receptor (TCR) and CD8 co-receptor, leading to the 'Induction of apoptosis' of the cancer cell. In the 'HLA B or C mutation' section, the PTC cell exhibits a mutation in the HLA-B or HLA-C genes (indicated by a red 'X' over the MHC-I molecule). This mutation results in an impaired or absent MHC-I interaction with the T-cell. Because the CD8+ T-cell cannot recognize the tumor-specific antigen, the interaction is disrupted, labeled as 'No apoptosis'. This illustrates a pathophysiological mechanism where genetic mutations in the human leukocyte antigen system allow metastatic tumor cells to evade cytotoxic immune responses.
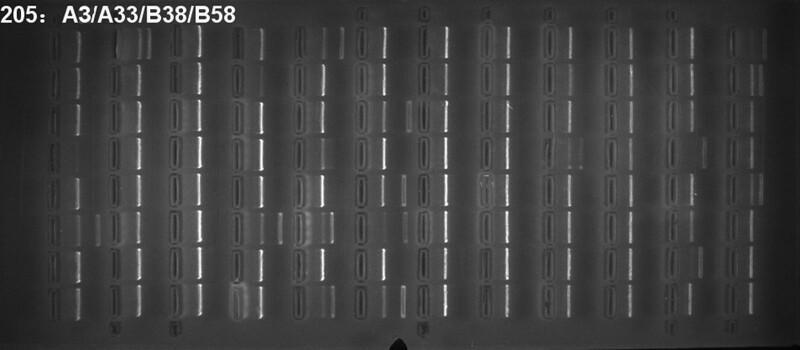
This diagnostic image shows a PCR (polymerase chain reaction) gel electrophoresis result used for HLA (human leukocyte antigen) genotyping. The visual content is a monochrome UV-fluorescence image of an agarose gel arranged in a grid-like matrix of lanes and rows. The dark background features numerous vertically oriented rectangular wells, each containing discrete, bright fluorescent bands of DNA. These bands represent specific amplified genetic markers. The variation in the number, position, and intensity of these bright vertical lines across different wells indicates the Presence/Absence of specific HLA alleles. Text in the upper left corner denotes sample identification for HLA-A and HLA-B serotypes (A3/A33/B38/B58). This visual is used in clinical genetics and immunology to demonstrate the methodology for identifying homozygosity or specific alleles within the Major Histocompatibility Complex (MHC), essential for transplant matching and disease susceptibility research.
Human Leukocyte Antigen (HLA)
1. Overview
"The HLA complex is a cornerstone for the immune system because of its involvement in identification of foreign proteins... HLA proteins are expressed on the surface of nearly all cells, where they bind to peptides that are exported from the cell." - Tietz Textbook of Laboratory Medicine, 7th Ed.
2. Genomic Organization
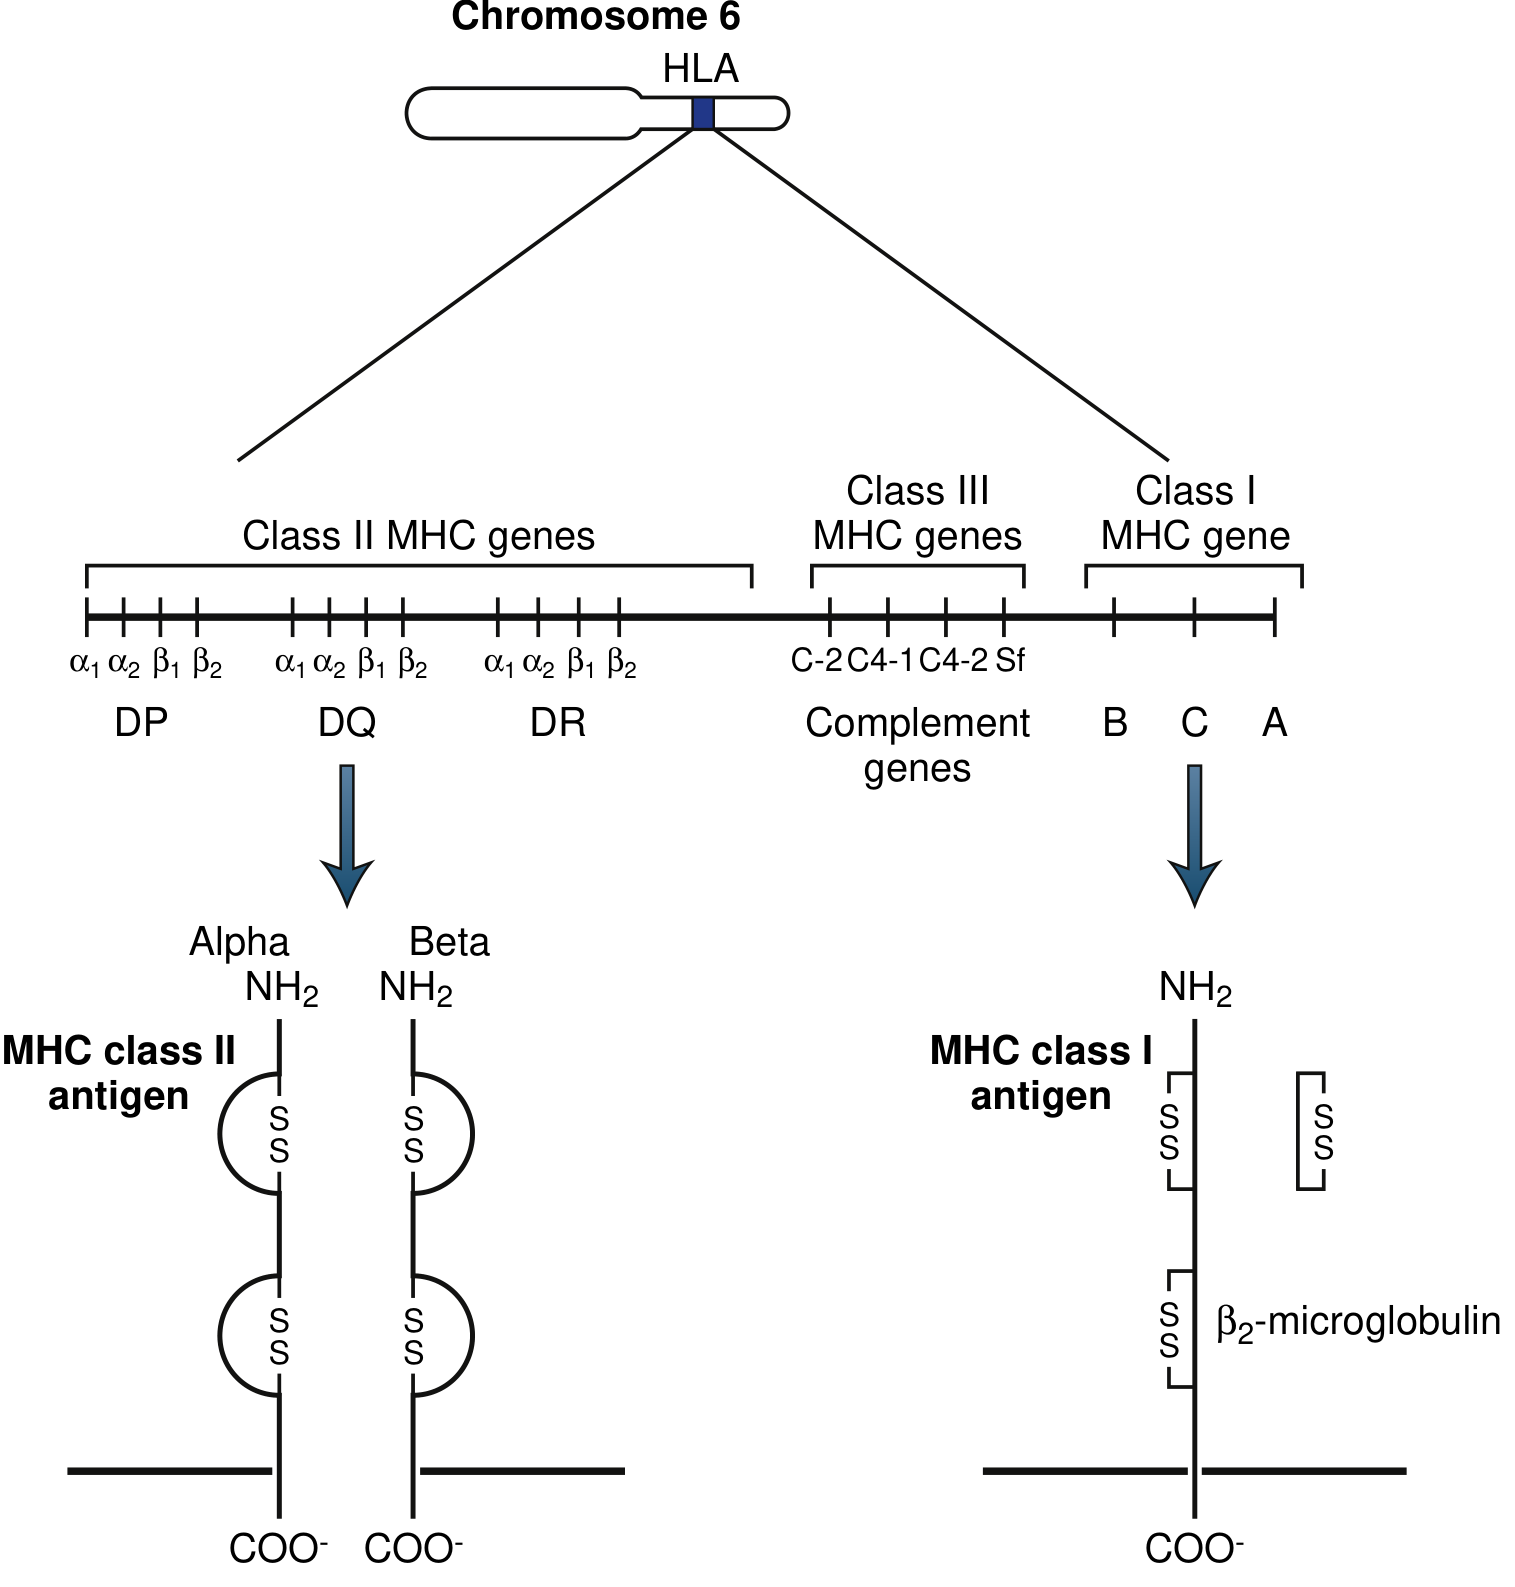
| Class | Genes | Expression | Binds |
|---|---|---|---|
| Class I | HLA-A, HLA-B, HLA-C | Nearly all nucleated cells | CD8+ cytotoxic T cells |
| Class II | HLA-DR, HLA-DQ, HLA-DP (+ HLA-DM, HLA-DO) | Thymic epithelium, professional APCs (dendritic cells, macrophages, B cells) | CD4+ helper T cells |
| Class III | Complement genes (C2, C4-1, C4-2), serum factors | - | - |
3. Molecular Structure
MHC Class I
- Composed of a three-domain α (heavy) chain non-covalently complexed with β₂-microglobulin (encoded outside the MHC, on chromosome 15)
- The peptide-binding groove is formed by domains α1 and α2
- Binds short peptides of 8-10 amino acids (anchored at both ends of the groove)
- CD8 co-receptor binds to the α3 domain
MHC Class II
- Composed of α and β chains (each with two domains)
- The peptide-binding groove is formed by domains α1 and β1
- Binds longer peptides of 13-25 amino acids (open-ended groove)
- CD4 co-receptor binds to a non-polymorphic site on the β chain
- Constitutively expressed on professional antigen-presenting cells (APCs)
4. Antigen Presentation - Two Pathways
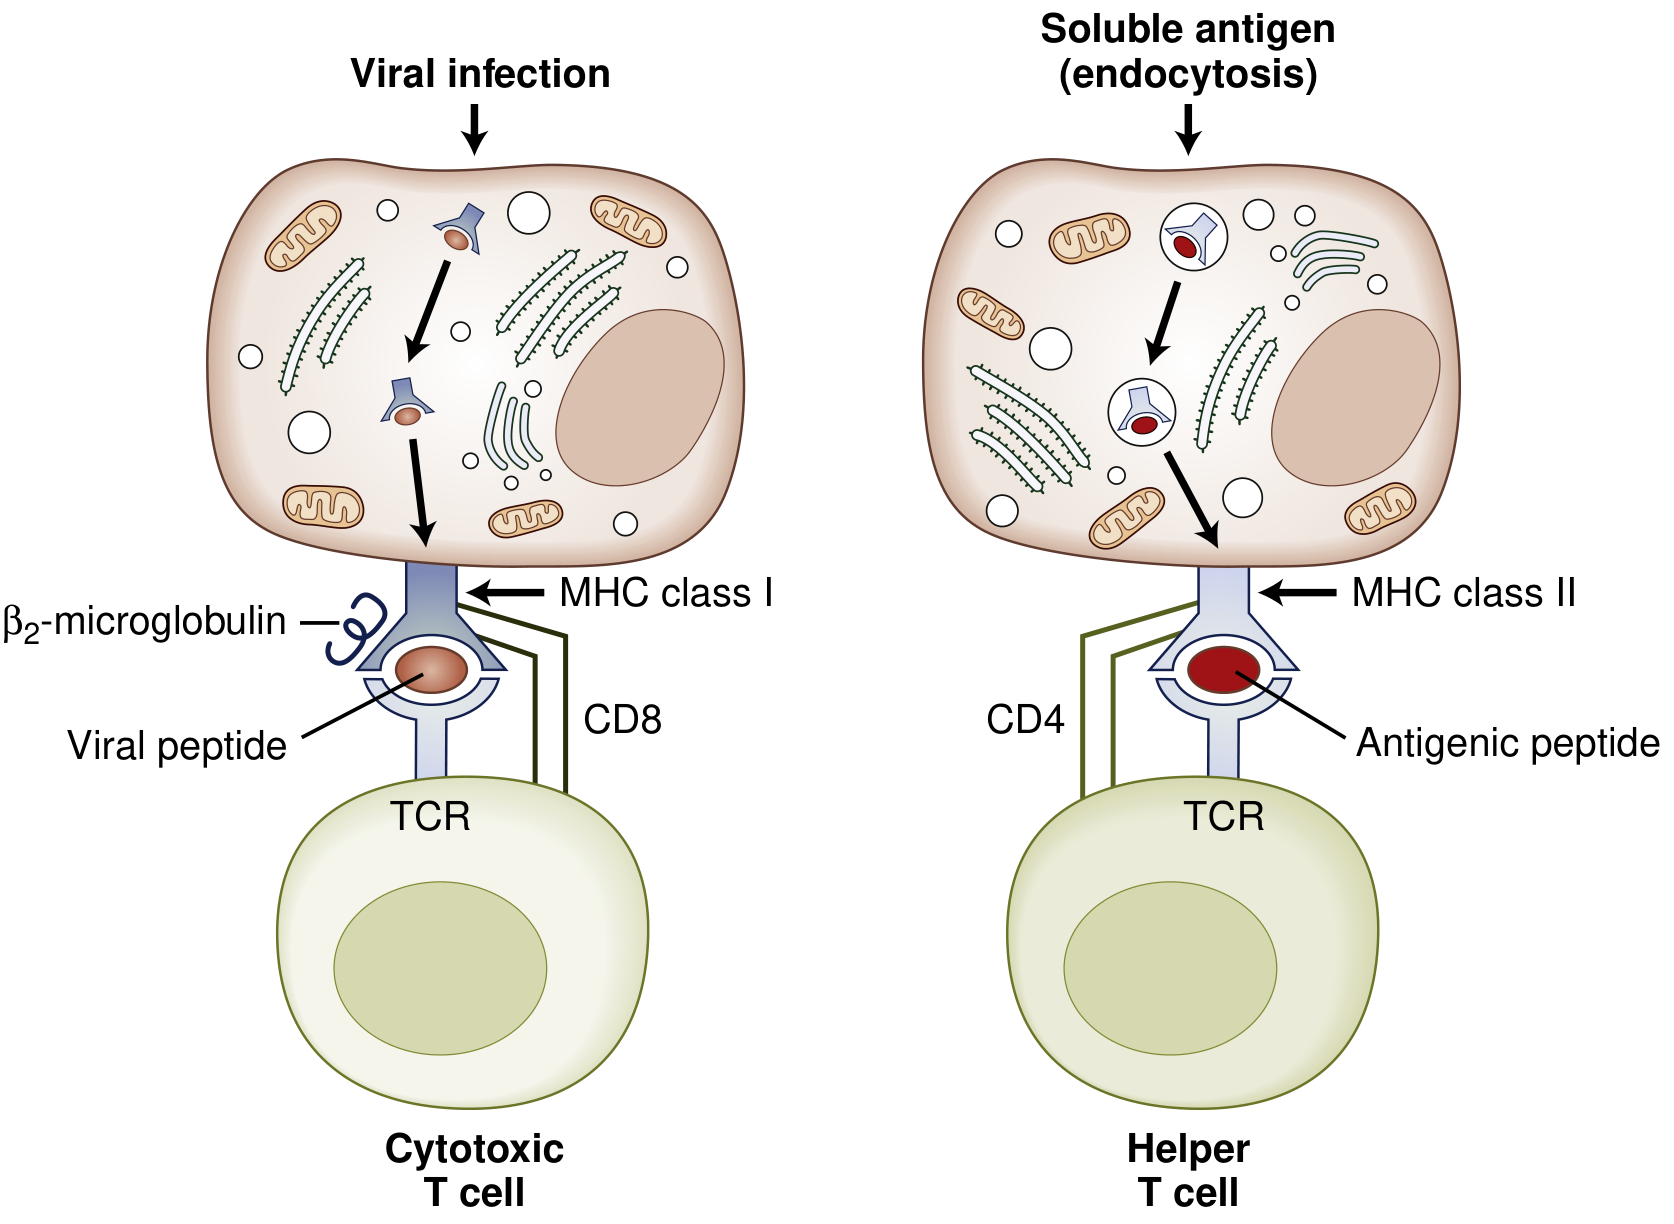
- Intracellular proteins (e.g., viral peptides) are processed by the proteasome
- Peptides transported into ER via TAP, loaded onto MHC-I
- Presented to CD8+ cytotoxic T cells → target cell destruction
- Extracellular antigens taken up by endocytosis
- Processed in lysosomes, loaded onto MHC-II
- Presented to CD4+ helper T cells → cytokine release, B cell activation
"Unlike Igs, TCRs cannot bind antigens directly. Instead, antigens must be processed and presented to T cells by HLA proteins encoded in the MHC." - Rheumatology, 2-Volume Set (2022, Elsevier)
5. HLA Polymorphism & Haplotypes
- Over 3,000 HLA-B alleles recognized by WHO as of 2015
- Each individual expresses a unique set of HLA proteins ("immunologic fingerprint")
- Genes are codominantly expressed - both parental haplotypes are expressed equally
- A haplotype = the specific set of HLA alleles inherited from one parent
- Polymorphism is concentrated in the peptide-binding groove, determining which antigens each individual can present
6. Disease Associations
| Disease | Associated HLA |
|---|---|
| Ankylosing spondylitis | B27 (strongest known HLA association) |
| Reactive arthritis | B27 |
| Psoriatic arthropathy | B27, B7, B13, B16, B38, B39, Cw6 |
| Psoriasis | Cw6 |
| Celiac disease | DQ2, DQ8 |
| Type 1 diabetes | DR17-DQ2 |
| Narcolepsy | DQB1*06:02 |
| Behçet disease | B51 |
| Rheumatoid arthritis | DR4 ("shared epitope") |
| Pemphigus vulgaris | DR4, DQ1 |
| Dermatitis herpetiformis | DQw2 |
| Alopecia areata | DWB1*03, DR4, DQ7 |
7. HLA in Transplantation
- Solid organ transplants: matching at HLA-A, -B, and -DR loci is standard
- Bone marrow/stem cell transplants: high-resolution matching (often to 8/8 or 10/10 loci) is required
- Donor-specific antibodies (DSA): pre-formed HLA antibodies can cause hyperacute rejection
- Recent data suggest matching to the fourth HLA field (ultra-high resolution) may further improve survival
8. HLA in Pharmacogenomics
| Drug | HLA Allele | Reaction |
|---|---|---|
| Abacavir (HIV) | B*57:01 | Hypersensitivity reaction |
| Allopurinol (gout) | B*58:01 | Stevens-Johnson Syndrome / TEN |
| Carbamazepine (epilepsy) | B*15:02 (Asian populations), A*31:01 | SJS/TEN |
- SJS vs TEN differentiated by body surface area: TEN involves >30% BSA and carries up to 40% mortality
- Incidence of cutaneous reactions is ~10-fold higher in Asian populations
- Genetic testing for HLA-B*57:01 (abacavir) has essentially eliminated abacavir hypersensitivity in screened patients
9. Clinical Testing Methods
- Serologic typing: older method using antibody panels (low resolution)
- Molecular typing: PCR-based - ranging from low resolution (antigen-level) to high resolution (allele-level, up to 4th field)
- Next-generation sequencing (NGS/MPS): now enables 4th-field resolution in routine practice
- Tagged variant / surrogate markers: e.g., HCP5 rs2395029 has 99.9% predictive value for HLA-B*57:01 (but false negatives possible due to copy number variation)
- Skin patch testing: can identify hypersensitivity risk (e.g., abacavir)
Summary
- Tietz Textbook of Laboratory Medicine, 7th Ed. - Ch. 97 (HLA Complex)
- Rheumatology, 2-Volume Set (2022, Elsevier) - Antigen Recognition by T Cells
- Bradley and Daroff's Neurology in Clinical Practice - Antigen Presentation
- Fitzpatrick's Dermatology - Histocompatibility Antigen Disease Association