
Explain community medicine epidemiology and biostatistics in detail
Reading File
Now let me search the medical library for community medicine, epidemiology, and biostatistics content in parallel.
Finding Sources
Finding Sources
Finding Sources
Excellent! Park's Textbook of Preventive and Social Medicine is the primary community medicine reference. Let me search its table of contents for epidemiology and biostatistics sections.
Finding Sources
Finding Sources
Now let me read the key epidemiology and biostatistics sections from Park's textbook in parallel:
Reading File
Reading File
Reading File
Now let me read the analytical epidemiology, experimental epidemiology, and biostatistics sections:
Reading File
Reading File
Finding Sources
Reading File
Finding Sources
Reading File
Reading File
Finding Sources
Reading File
Reading File
Reading File
I now have extensive material from Park's Textbook. Let me fetch one key image and read the biostatistics section:
Reading File
Reading File
I now have rich, detailed content from Park's Textbook of Preventive and Social Medicine. Let me compile the comprehensive answer.
Community Medicine: Epidemiology and Biostatistics
Based primarily on Park's Textbook of Preventive and Social Medicine
PART I: EPIDEMIOLOGY
1. Definition and Scope
Epidemiology is the study of the distribution and determinants of health-related states or events in specified populations, and the application of this study to control health problems. The word is derived from Greek: epi (upon), demos (people), logos (science) - literally, the science of what falls upon the people.
Key distinctions:
- In clinical medicine, the unit of study is the individual patient
- In epidemiology, the unit of study is a defined population or population-at-risk
- The clinician asks "What is wrong with this patient?" - the epidemiologist asks "What is the rate of disease in this group vs. that group?"
- The epidemiologist is interested in the relationship between cases and the population in the form of a rate
2. The Epidemiological Triangle
The traditional triangle of epidemiology rests on three interactive components:
| Component | Description |
|---|---|
| Agent | The cause - bacteria, virus, chemicals, radiation, nutritional deficiency |
| Host | The human or animal that harbours disease; influenced by immunity, genetics, exposure level |
| Environment | Biological, social, cultural, physical surroundings; external or internal to the host |
| Time | Incubation periods, duration of illness, epidemic thresholds |
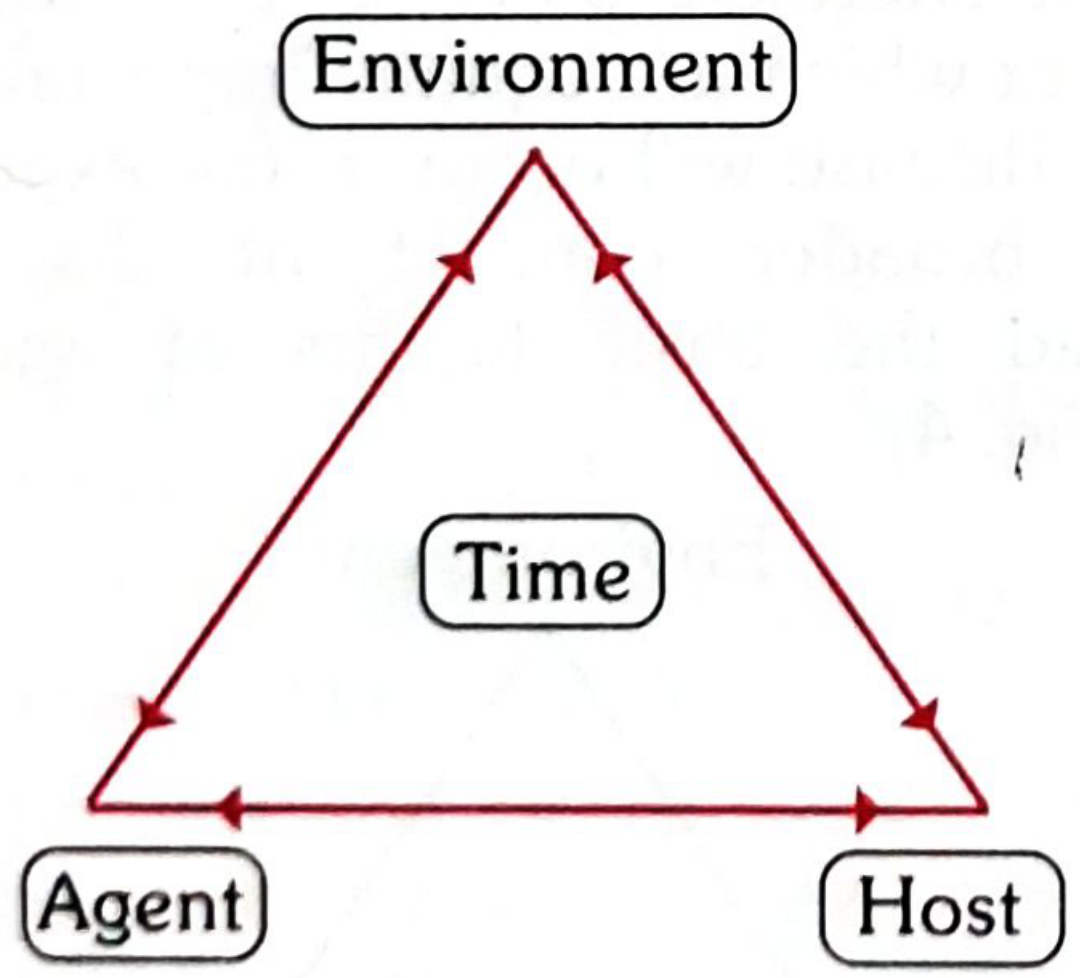
The primary mission of epidemiology is to break one of the legs of this triangle, thereby disrupting disease transmission.
3. Aims of Epidemiology (IEA)
According to the International Epidemiological Association, epidemiology has three main aims:
- To describe the distribution and magnitude of health and disease in human populations
- To identify aetiological factors (risk factors) in the pathogenesis of disease
- To provide data essential for planning, implementation, and evaluation of health services
The ultimate aim is to eliminate or reduce the health problem and promote well-being of society as a whole.
4. Uses of Epidemiology (Morris, 7 Uses)
- Historical study - studying the rise and fall of disease over time; identifying emerging threats (e.g., AIDS, Legionnaires' disease)
- Community diagnosis - quantifying health problems via mortality/morbidity rates; identifying high-risk groups; setting priorities
- Planning and evaluation - determining need for hospitals, health manpower, vaccines; assessing cost-effectiveness
- Individual risks and chances - calculating a person's risk of developing disease (e.g., cancer risk by smoking)
- Syndrome identification - defining new disease syndromes from symptom clusters
- Completing the clinical picture - understanding the full spectrum and natural history of disease
- Searching for causes - testing aetiological hypotheses about risk factors for chronic diseases (e.g., lung cancer and smoking)
5. Basic Measurements in Epidemiology
The epidemiologist expresses disease frequency using three tools:
a. Rate
- Measures the probability that an event will occur in a defined population in a specific time period
- Formula: (Number of events / Population at risk) × multiplier (100, 1000, 100,000)
- A rate must always have a numerator, denominator, and time element
b. Ratio
- Compares two quantities; the numerator is not necessarily part of the denominator
- Example: sex ratio (males per 100 females), fetal death ratio
c. Proportion
- The numerator is part of the denominator
- Example: case fatality rate, proportional mortality ratio
6. Measurement of Mortality
| Measure | Formula | Notes |
|---|---|---|
| Crude Death Rate (CDR) | (Deaths in 1 year / Midyear population) × 1000 | Limited by age-composition differences between populations |
| Age-specific Death Rate | (Deaths in age group / Population in same age group) × 1000 | More useful for comparisons |
| Standardized Mortality Ratio (SMR) | (Observed deaths / Expected deaths) × 100 | Controls for age differences |
| Infant Mortality Rate (IMR) | (Deaths <1 year / Live births) × 1000 | Sensitive index of health status |
| Neonatal Mortality Rate | (Deaths <28 days / Live births) × 1000 | Reflects obstetric care |
| Maternal Mortality Ratio | (Maternal deaths / Live births) × 100,000 | |
| Case Fatality Rate | (Deaths from disease / Cases of disease) × 100 | Measures disease lethality |
Important limitation of CDR: A population with a younger age structure can show a lower CDR than a healthier older population - age-specific rates must always be examined.
Measurement of Morbidity
| Measure | Formula | Notes |
|---|---|---|
| Incidence Rate | (New cases / Population at risk in time period) | Measures risk of developing disease |
| Prevalence Rate | (All existing cases / Total population at a point in time) | Measures burden of disease |
| Attack Rate | (Cases / Population exposed) × 100 | Used in epidemic investigations |
| Secondary Attack Rate | (Cases among contacts / Total contacts) × 100 | Measures transmissibility |
Relationship: Prevalence = Incidence × Duration of disease
7. Types of Epidemiological Studies
A. Descriptive Epidemiology
Describes the distribution of disease by time, place, and person - the "who, when, and where."
Procedures:
- Define the population to be studied
- Define the disease
- Describe disease by time, place, person
- Measure disease frequency
- Compare with known indices
- Formulate an aetiological hypothesis
Descriptive variables:
- Time: Secular (long-term) trends, cyclical fluctuations, seasonal variation, epidemic patterns
- Place: Country, urban/rural, local geography, spot maps
- Person: Age, sex, ethnicity, occupation, socioeconomic status, marital status, lifestyle
Descriptive studies generate hypotheses - they do not test them.
B. Analytical Epidemiology
Tests hypotheses generated by descriptive studies. The unit of study is the individual within the population.
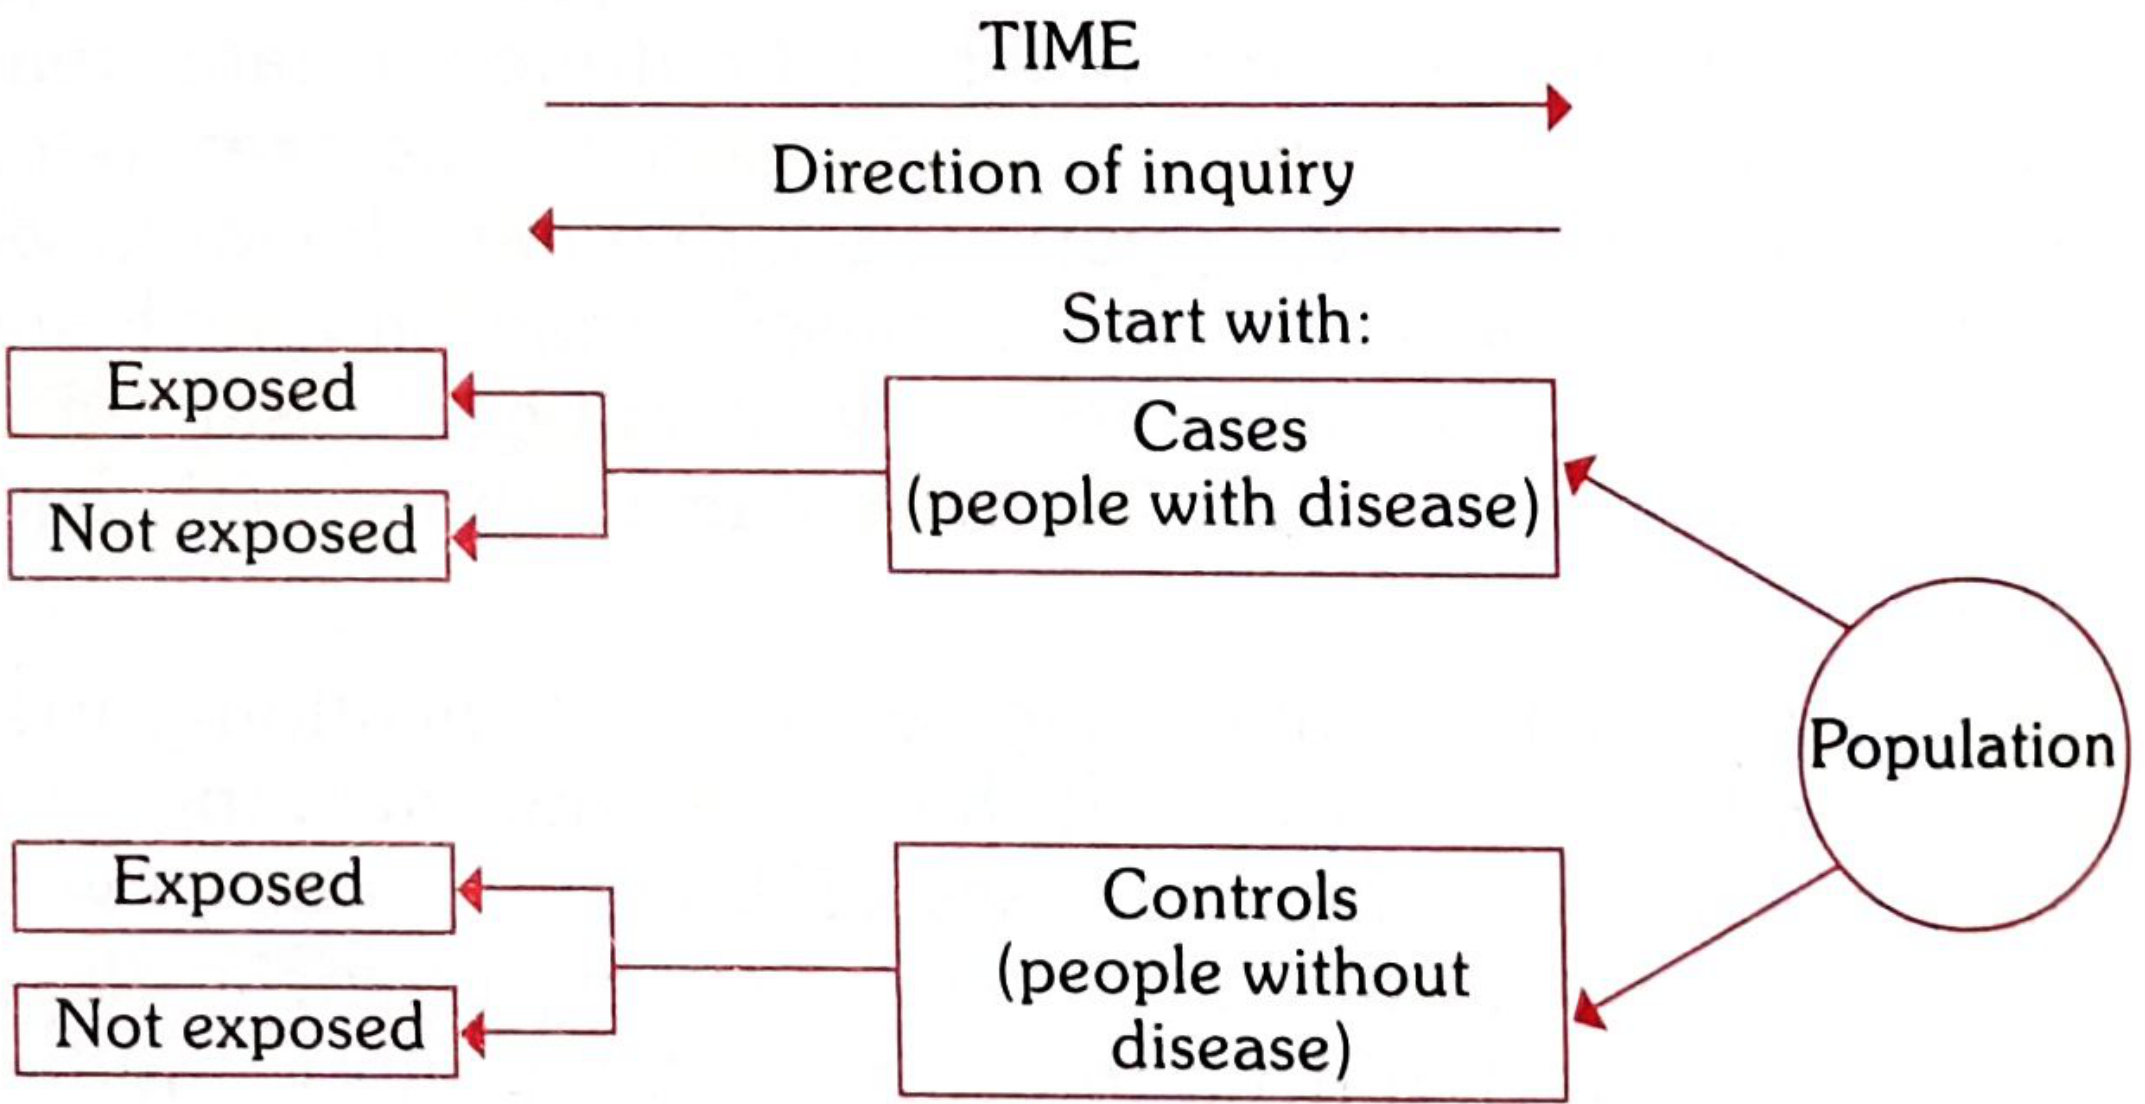
1. Case-Control Study (Retrospective)
Features:
- Both exposure and outcome have already occurred before the study starts
- Proceeds backwards from effect to cause (retrospective)
- Compares cases (those with disease) to controls (those without)
- Measures association using Odds Ratio (OR)
| Advantages | Disadvantages |
|---|---|
| Rapid and inexpensive | Recall bias |
| Good for rare diseases | Selection bias in choosing controls |
| Can study multiple exposures | Cannot calculate incidence rate |
| Small sample size needed | Temporality difficult to establish |
Odds Ratio = (a × d) / (b × c) in the standard 2×2 table
2. Cohort Study (Prospective)
Features:
- Starts with people free of disease, classified by exposure status
- Followed forwards in time to observe development of disease
- Measures association using Relative Risk (RR)
| Advantages | Disadvantages |
|---|---|
| Can calculate incidence and RR | Expensive and time-consuming |
| Establishes temporality | Requires large sample size |
| Reduces recall bias | Loss to follow-up is a problem |
| Can study multiple outcomes | Not suitable for rare diseases |
Relative Risk = (Incidence in exposed) / (Incidence in unexposed)
Attributable Risk = Incidence in exposed - Incidence in unexposed
C. Experimental Epidemiology
The investigator controls the conditions of the study. Analogous to cohort studies but with deliberate intervention.
Types:
- Animal experiments - Useful for proof of aetiology, testing vaccines/drugs; findings may not extrapolate to humans
- Human experiments - Always required to confirm findings in humans
Randomized Controlled Trial (RCT) - The gold standard:
- Participants randomly allocated to intervention or control group
- Minimizes confounding and selection bias
- Can be single-blind, double-blind, or triple-blind
- Aims: prove aetiological factors; measure effectiveness and efficiency of health services
Clinical trials: Test therapeutic measures in patients
Field trials: Test preventive measures in healthy populations
Community trials: Intervention applied to entire communities
Field trials: Test preventive measures in healthy populations
Community trials: Intervention applied to entire communities
8. Epidemic Investigation
Definitions:
- Endemic: The constant presence of a disease in a given area
- Epidemic: Occurrence clearly in excess of normal expectancy in an area
- Pandemic: A worldwide epidemic
- Outbreak: A localized epidemic
Types of Epidemics
A. Common-Source Epidemics
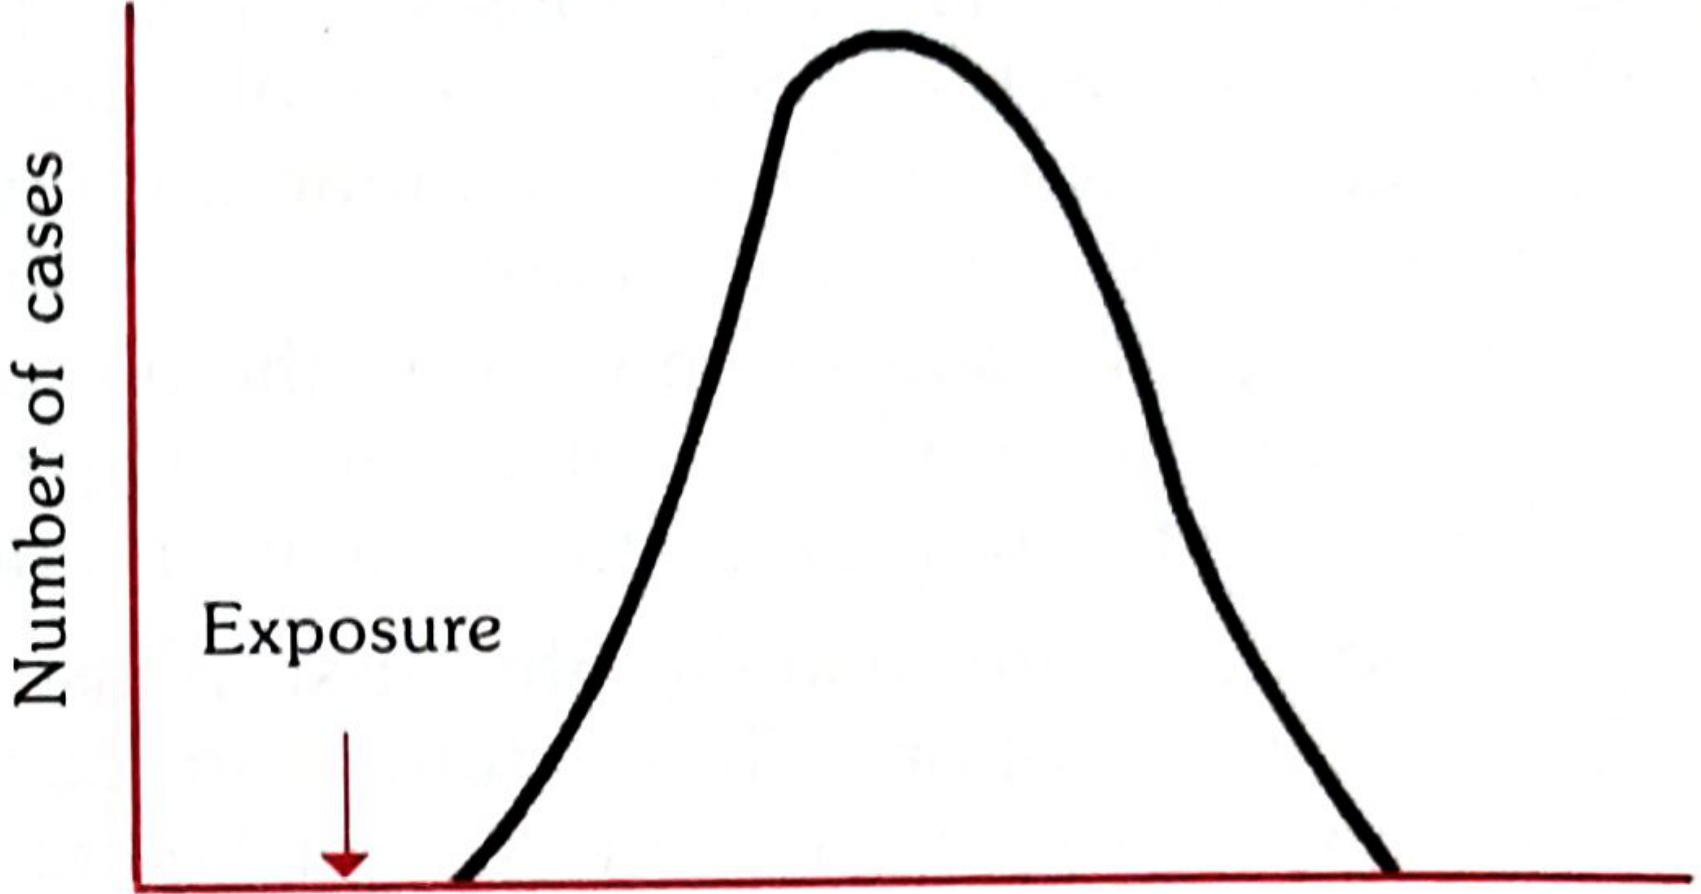
- Point-source (single exposure): All exposure is brief and simultaneous; all cases appear within one incubation period; epidemic curve rises and falls rapidly with a single sharp peak (e.g., food poisoning)
- Continuous/multiple exposure: Exposure persists over time; prolonged epidemic curve
B. Propagated Epidemics:
- Person-to-person spread (e.g., influenza)
- Arthropod vector
- Animal reservoir
C. Slow (Modern) Epidemics: Chronic diseases like coronary heart disease, cancer
Steps in Epidemic Investigation
- Verify the diagnosis
- Confirm the existence of an epidemic
- Define the population at risk
- Describe the epidemic by time, place, person
- Formulate a hypothesis
- Test the hypothesis
- Institute control measures
- Prepare a report
9. Causation in Epidemiology
Multifactorial Causation
The "web of causation" model - disease results from multiple interacting factors. No single factor is sufficient.
Koch's Postulates (for infectious disease causation):
- The organism must be found in all cases of the disease
- It must be isolated and grown in pure culture
- Pure culture must produce the disease in susceptible animals
- Organism must be re-isolated from infected animals
Bradford Hill's Criteria for Causation:
- Strength of association - High RR or OR
- Consistency - Repeated finding across studies
- Specificity - One cause produces one effect
- Temporality - Cause precedes effect
- Biological gradient - Dose-response relationship
- Plausibility - Biologically credible
- Coherence - Consistent with natural history of disease
- Experiment - Removal of cause reduces disease
- Analogy - Similar factor causes similar disease
PART II: BIOSTATISTICS
Biostatistics is the application of statistical methods to biological and health data. It provides the mathematical tools for epidemiological analysis.
1. Types of Data
| Type | Subtypes | Examples |
|---|---|---|
| Qualitative (Categorical) | Nominal (no order) | Blood group, sex, religion |
| Ordinal (ordered) | Severity (mild/moderate/severe), grades | |
| Quantitative (Numerical) | Discrete | Number of children, pulse rate |
| Continuous | Height, weight, blood pressure, serum cholesterol |
In epidemiology:
- Variate: Any piece of information about a patient or disease (discrete or continuous)
- Circumstance: Any environmental factor suspected of causing disease
2. Measures of Central Tendency
| Measure | Definition | Best used when |
|---|---|---|
| Mean (x̄) | Sum of all values / Total number | Normally distributed data |
| Median | Middle value when data is arranged in order | Skewed data, ordinal data |
| Mode | Most frequently occurring value | Nominal data, bimodal distributions |
3. Measures of Dispersion
| Measure | Definition |
|---|---|
| Range | Maximum - Minimum value |
| Variance (s²) | Average of squared deviations from mean |
| Standard Deviation (SD) | Square root of variance; same units as data |
| Standard Error of Mean (SEM) | SD / √n; measures precision of sample mean |
| Coefficient of Variation (CV) | (SD / Mean) × 100; compares variability between different measurements |
| Percentiles/Quartiles | Values dividing data into 100 or 4 equal parts |
SD properties in normal distribution:
- Mean ± 1 SD covers 68.27% of observations
- Mean ± 2 SD covers 95.45% of observations
- Mean ± 3 SD covers 99.73% of observations
4. Normal (Gaussian) Distribution
Characteristics:
- Symmetrical, bell-shaped curve
- Mean = Median = Mode
- Defined completely by mean and SD
- Basis for most parametric statistical tests
When data is skewed, non-parametric tests or data transformation may be needed.
5. Sampling Methods
| Method | Description |
|---|---|
| Simple Random Sampling | Every member has equal probability of selection (lottery method, random number tables) |
| Systematic Random Sampling | Every nth person in a list (e.g., every 10th name) |
| Stratified Random Sampling | Population divided into strata; random sample from each stratum |
| Cluster Sampling | Natural groupings (villages, schools) selected as units |
| Multi-stage Sampling | Sampling done in stages (districts → villages → households) |
| Purposive/Judgement Sampling | Researcher selects "representative" units (non-probability) |
Sample size determination depends on:
- Estimated prevalence/incidence of the condition
- Desired precision (acceptable error)
- Confidence level (usually 95%)
- Design effect (for cluster sampling)
6. Hypothesis Testing
Null Hypothesis (H₀)
States there is no association or no difference between groups. The goal of testing is to reject or fail to reject H₀.
Types of Error
| H₀ True | H₀ False | |
|---|---|---|
| Reject H₀ | Type I Error (α) | Correct (Power) |
| Fail to reject H₀ | Correct | Type II Error (β) |
- Type I error (α): False positive - rejecting H₀ when it is actually true; conventionally set at 0.05 (5%)
- Type II error (β): False negative - failing to reject H₀ when it is false; conventionally set at 0.20 (20%)
- Power = 1 - β: Ability of a study to detect a true difference
p-value
- Probability of observing results as extreme as (or more extreme than) those observed, assuming H₀ is true
- p < 0.05: Statistically significant (less than 5% chance result is due to chance)
- p-value indicates statistical significance, not clinical significance
7. Common Statistical Tests
| Test | When to Use |
|---|---|
| Student's t-test | Comparing means of two groups (parametric, continuous data) |
| Paired t-test | Before/after measurements in same subjects |
| ANOVA (F-test) | Comparing means of 3 or more groups |
| Chi-square (χ²) | Comparing proportions; association between two categorical variables |
| Fisher's Exact Test | Chi-square when cell frequencies are small (<5) |
| Mann-Whitney U test | Non-parametric alternative to independent t-test |
| Wilcoxon Signed-rank test | Non-parametric alternative to paired t-test |
| Kruskal-Wallis test | Non-parametric alternative to ANOVA |
Chi-square Test Formula:
χ² = Σ [(Observed - Expected)² / Expected]
Degrees of freedom = (rows-1) × (columns-1)
8. Measures of Association
| Measure | Used In | Formula |
|---|---|---|
| Relative Risk (RR) | Cohort studies | Incidence in exposed / Incidence in unexposed |
| Odds Ratio (OR) | Case-control studies | (a×d) / (b×c) |
| Attributable Risk (AR) | Cohort studies | Incidence exposed - Incidence unexposed |
| Population Attributable Risk (PAR) | Public health impact | Proportion of disease attributable to exposure in whole population |
| Number Needed to Treat (NNT) | Clinical trials | 1 / Absolute Risk Reduction |
Interpretation of RR/OR:
- RR/OR = 1: No association
- RR/OR > 1: Positive association (risk factor)
- RR/OR < 1: Negative association (protective factor)
9. Confidence Intervals
A 95% confidence interval (CI) states that if the study were repeated 100 times, the true value would fall within the interval in 95 of them.
- Wide CI = imprecise estimate (small sample)
- Narrow CI = precise estimate (large sample)
- If 95% CI for RR does not include 1.0, the association is statistically significant (p < 0.05)
10. Correlation and Regression
| Concept | Definition |
|---|---|
| Pearson's correlation (r) | Measures strength and direction of linear relationship between two continuous variables; ranges from -1 to +1 |
| Spearman's rank correlation | Non-parametric equivalent of Pearson's |
| Linear regression | Predicts value of outcome variable (Y) from predictor variable (X); Y = a + bX |
| Multiple regression | Predicts outcome from multiple independent variables; controls for confounding |
| Logistic regression | Used when outcome is binary (disease yes/no); gives Adjusted Odds Ratios |
11. Sensitivity and Specificity
These evaluate the validity of diagnostic tests and screening programmes:
| Measure | Definition | Formula |
|---|---|---|
| Sensitivity | Ability to correctly identify those WITH disease (true positive rate) | TP / (TP + FN) |
| Specificity | Ability to correctly identify those WITHOUT disease (true negative rate) | TN / (TN + FP) |
| Positive Predictive Value (PPV) | Probability of disease given a positive test | TP / (TP + FP) |
| Negative Predictive Value (NPV) | Probability of no disease given a negative test | TN / (TN + FN) |
- Sensitivity and specificity are properties of the test
- PPV and NPV depend on prevalence in the population
- High sensitivity → fewer false negatives → good for screening
- High specificity → fewer false positives → good for confirmation
12. Vital Statistics
Key sources of health data include:
- Census: Population data every 10 years; provides denominators for rates
- Civil registration: Compulsory recording of births, deaths, marriages
- Sample Registration System (SRS): Continuous demographic surveillance in India
- Disease notification: Compulsory reporting of notifiable diseases
- Hospital records and disease registers
- Epidemiological surveillance: Systematic, ongoing collection, analysis, and use of health data
- National Family Health Survey (NFHS) and District Level Health Survey (DLHS)
13. Bias and Confounding
Bias: Systematic error in study design or execution that distorts results.
| Type | Description |
|---|---|
| Selection bias | Non-representative sample selection |
| Information/measurement bias | Errors in data collection |
| Recall bias | Cases recall past exposure more vividly than controls (case-control studies) |
| Observer bias | Observer's knowledge of hypothesis influences data recording |
| Berkson's bias | Hospital-based case-control studies using hospital controls |
Confounding: A variable associated with both the exposure and the outcome, which distorts the apparent relationship.
- Controlled by: randomization, restriction, matching, stratification, multivariate analysis
Summary Diagram: Epidemiological Study Hierarchy
Experimental Studies (RCTs)        ← Highest evidence
       ↑
Cohort Studies (Prospective)
       ↑
Case-Control Studies (Retrospective)
       ↑
Cross-Sectional Studies
       ↑
Ecological Studies
       ↑
Case Reports/Series               ← Lowest evidence
Integration: Epidemiology and Biostatistics in Community Medicine
Community medicine uses both disciplines together for:
- Disease surveillance and outbreak detection - Statistical thresholds define when disease frequency constitutes an epidemic
- Screening programmes - Sensitivity/specificity calculations determine which tests to use population-wide
- Intervention planning - Sample size calculations determine feasibility of trials; attributable risk tells us the public health impact of removing an exposure
- Health services evaluation - Statistical tests compare mortality and morbidity rates before and after interventions
- Risk communication - Relative risk and attributable risk help translate findings for policy makers and the public
Source: Park's Textbook of Preventive and Social Medicine, Park K., Banarsidas Bhanot Publishers
Fmge key topics from above
Here are the FMGE (Foreign Medical Graduate Examination) key topics from Community Medicine - Epidemiology & Biostatistics. This exam heavily tests formula recall, definitions, and study design identification.
🎯 FMGE High-Yield: Epidemiology & Biostatistics
🔴 MOST FREQUENTLY ASKED (Must Know)
1. Study Designs - Identification & Key Features
| Study | Direction | Measures | Key Feature |
|---|---|---|---|
| Case-Control | Retrospective (effect → cause) | Odds Ratio | Good for rare diseases |
| Cohort | Prospective (cause → effect) | Relative Risk | Can calculate incidence |
| Cross-sectional | Snapshot | Prevalence | "Prevalence study" |
| RCT | Prospective | RR, NNT | Gold standard |
| Ecological | Group-level data | Correlation | Ecological fallacy risk |
FMGE trap: "Which study is best for rare disease?" → Case-control
FMGE trap: "Which study gives incidence rate?" → Cohort
FMGE trap: "Gold standard for causation?" → RCT
2. Odds Ratio vs Relative Risk
| Odds Ratio | Relative Risk | |
|---|---|---|
| Used in | Case-control | Cohort / RCT |
| Formula | (a×d) / (b×c) | [a/(a+b)] / [c/(c+d)] |
| When equal | When disease is rare (<10%) | - |
2×2 Table - Memorize this:
              Disease+    Disease-
Exposed         a           b
Not exposed     c           d
- OR = ad/bc
- RR = [a/(a+b)] ÷ [c/(c+d)]
- AR (Attributable Risk) = Incidence exposed - Incidence unexposed
- PAR% = (Prevalence of exposure × (RR-1)) / (Prevalence of exposure × (RR-1) + 1) × 100
3. Sensitivity & Specificity (Very Frequently Asked)
              Disease+    Disease-
Test +          TP          FP
Test -          FN          TN
| Formula | Mnemonic |
|---|---|
| Sensitivity = TP / (TP+FN) | SnNout - High Sensitivity → Negative rules OUT |
| Specificity = TN / (TN+FP) | SpPin - High Specificity → Positive rules IN |
| PPV = TP / (TP+FP) | Depends on prevalence |
| NPV = TN / (TN+FN) | Depends on prevalence |
FMGE favorites:
- "Screening test should have high ____?" → Sensitivity
- "Confirmatory test should have high ____?" → Specificity
- "PPV increases when ____?" → Prevalence increases
- "Best single test (screening + confirmation)?" → High Sensitivity + Specificity = Validity
Likelihood Ratio Positive = Sensitivity / (1 - Specificity)
4. Incidence vs Prevalence
| Incidence | Prevalence | |
|---|---|---|
| Definition | New cases / Population at risk / Time | All existing cases / Total population |
| Measures | Risk of getting disease | Burden of disease |
| Used for | Acute diseases, aetiology | Chronic diseases, planning |
Key formula: Prevalence = Incidence × Duration
- High duration disease → high prevalence despite low incidence (e.g., diabetes, TB)
- Effective treatment reduces prevalence (shortens duration)
- Improved survival → increases prevalence
5. Mortality Rates (High-yield formulas)
| Rate | Formula | Per |
|---|---|---|
| Crude Death Rate | Deaths / Midyear population | 1000 |
| IMR | Deaths <1yr / Live births | 1000 |
| Neonatal MR | Deaths <28 days / Live births | 1000 |
| Perinatal MR | (Stillbirths + Deaths <7 days) / (Stillbirths + Live births) | 1000 |
| Maternal Mortality Ratio | Maternal deaths / Live births | 100,000 |
| Case Fatality Rate | Deaths from disease / Cases | % (×100) |
| Proportional Mortality Rate | Deaths from one cause / Total deaths | % |
FMGE trap: IMR is the best indicator of:
- Socioeconomic development
- Health services availability
- Nutritional status of a community
Best indicator of health status of a community = IMR
6. Attack Rate (Epidemic Investigation)
- Attack Rate = (Cases / Total exposed) × 100
- Secondary Attack Rate = (New cases among contacts / Total susceptible contacts) × 100
- SAR measures communicability/infectivity of a disease
🟠 FREQUENTLY ASKED
7. Types of Errors & p-value
| H₀ True | H₀ False | |
|---|---|---|
| Reject H₀ | Type I (α) False +ve | Correct ✓ |
| Accept H₀ | Correct ✓ | Type II (β) False -ve |
- α (Type I) = conventionally 0.05 (5%)
- β (Type II) = conventionally 0.20 (20%)
- Power = 1 - β = 0.80 (80%)
- p < 0.05 = statistically significant
FMGE trap: "Concluding a drug works when it actually doesn't" → Type I error
FMGE trap: "Concluding no difference when there actually is one" → Type II error
8. Confidence Interval
- 95% CI = Mean ± 1.96 × SE
- 99% CI = Mean ± 2.58 × SE
- If 95% CI for RR or OR includes 1 → NOT significant
- If 95% CI for difference includes 0 → NOT significant
- Wider CI = smaller sample size = less precision
9. Normal Distribution - SD Rules
| Range | % of population |
|---|---|
| Mean ± 1 SD | 68.27% |
| Mean ± 2 SD | 95.45% |
| Mean ± 3 SD | 99.73% |
- Mean ± 1.96 SD = 95% of population (used for reference ranges)
10. Statistical Tests Selection
| Data Type | Two Groups | >2 Groups |
|---|---|---|
| Parametric (normal, continuous) | t-test | ANOVA |
| Non-parametric | Mann-Whitney U | Kruskal-Wallis |
| Paired data (parametric) | Paired t-test | Repeated measures ANOVA |
| Categorical/proportions | Chi-square (χ²) | Chi-square |
| Small cell size (<5) | Fisher's Exact Test | - |
Correlation:
- Normally distributed → Pearson's r
- Non-normal / ordinal → Spearman's rank
11. Epidemic Types (Common FMGE Scenario)
| Type | Key Feature | Example |
|---|---|---|
| Point-source | Single peak, all cases within 1 incubation period | Food poisoning outbreak |
| Propagated | Multiple peaks, progressive spread | Influenza, cholera |
| Continuous common source | Prolonged plateau, ongoing exposure | Contaminated water supply |
FMGE scenario: "All guests at a wedding get diarrhea within 6 hours" → Point-source epidemic
12. Bradford Hill's Criteria (Causation)
Memorize as "STBP BC PEA":
- Strength of association
- Temporality (cause before effect - the only essential criterion)
- Biological gradient (dose-response)
- Plausibility
- Biological Coherence
- Consistency
- Specificity
- Experiment
- Analogy
Most important criterion = Temporality (cause must precede effect)
13. Bias Types
| Bias | Description | Found In |
|---|---|---|
| Recall bias | Cases remember exposure better than controls | Case-control |
| Berkson's bias | Hospital controls ≠ general population | Hospital-based case-control |
| Neyman bias | Prevalent cases ≠ incident cases (survivors only) | Cross-sectional, case-control |
| Observer/interviewer bias | Researcher influences data collection | Any study |
| Lead time bias | Early detection mimics improved survival | Screening studies |
| Length bias | Slowly progressing disease over-represented in screening | Screening studies |
14. Confounding
- A variable that is associated with both the exposure and the outcome
- Control methods: Randomization, Restriction, Matching, Stratification, Multivariate analysis
- Best way to control confounding in a study = Randomization (in RCT)
- Post hoc control = Mantel-Haenszel stratified analysis or logistic regression
🟡 MODERATE YIELD
15. Sampling Methods
| Method | Key Point |
|---|---|
| Simple Random | Equal probability; lottery/random number table |
| Systematic | Every nth person; risk of periodicity bias |
| Stratified | Subgroups represented proportionally |
| Cluster | Natural groups selected; most practical for field surveys, but highest sampling error |
| Multistage | Stages: state → district → village → household |
Most common for large-scale national surveys = Multistage cluster sampling
16. Screening Criteria (Wilson & Jungner)
A disease suitable for screening must:
- Be an important health problem
- Have a recognizable latent/early stage
- Have an accepted treatment
- Have a suitable test (sensitive, specific, acceptable)
- Natural history of disease must be understood
- Cost-effective
17. NNT (Number Needed to Treat)
- NNT = 1 / Absolute Risk Reduction (ARR)
- ARR = Risk in control - Risk in treated
- Lower NNT = better treatment
- NNH (Number Needed to Harm) = 1 / Absolute Risk Increase
18. Kappa Statistic
- Measures inter-rater agreement beyond chance
- κ > 0.75 = excellent agreement
- κ 0.40-0.75 = good/fair agreement
- κ < 0.40 = poor agreement
📝 FMGE ONE-LINERS (Quick Recall)
| Question type | Answer |
|---|---|
| Best study to establish causation | RCT |
| Best study for rare disease | Case-control |
| Study that gives prevalence | Cross-sectional |
| Incidence can be calculated from | Cohort study |
| OR approximates RR when | Disease is rare (<10%) |
| Sensitivity + Specificity constant even when | Prevalence changes |
| PPV/NPV change with | Prevalence |
| IMR denominator | Live births (not total births) |
| Perinatal MR denominator | Stillbirths + Live births |
| Maternal Mortality Ratio denominator | Live births (not maternal deaths) |
| Most sensitive indicator of community health | IMR |
| Prevalence = | Incidence × Duration |
| Epidemic curve with single peak | Point-source epidemic |
| SAR measures | Infectivity/communicability |
| Most important criterion of causality (Hill) | Temporality |
| Type I error | False positive (α = 0.05) |
| Type II error | False negative (β = 0.20) |
| Power of study | 1 - β (usually 80%) |
| p < 0.05 means | Statistically significant |
| If 95% CI for RR includes 1 | Not significant |
| Mean ± 1.96 SD | 95% reference range |
| Best to control confounding in RCT | Randomization |
| Screening test requires high | Sensitivity |
| Confirmatory test requires high | Specificity |
| SnNout | High Sensitivity - Negative test rules Out |
| SpPin | High Specificity - Positive test rules In |
Exam tip: In FMGE, epidemiology and biostatistics questions are very formula-based and scenario-driven. Focus on identifying study design from the scenario, choosing the correct measure of association, and applying sensitivity/specificity rules. These topics contribute approximately 8-12 questions per FMGE paper.
Make a quick reference pdf cheat sheet of all community medicine for fmge with in 15 pages for exam day
Reading File
Finding Sources
Finding Sources
Now let me build the full PDF using ReportLab with a professional, exam-day cheat sheet layout:
Running Command
mkdir -p /home/daytona/workspace/fmge-cheatsheet && ls /home/daytona/workspace/fmge-cheatsheet
Writing File
~/fmge-cheatsheet/generate_cheatsheet.py
from reportlab.lib.pagesizes import A4
from reportlab.lib import colors
from reportlab.lib.units import mm, cm
from reportlab.platypus import (
SimpleDocTemplate, Paragraph, Spacer, Table, TableStyle,
HRFlowable, KeepTogether, PageBreak
)
from reportlab.lib.styles import getSampleStyleSheet, ParagraphStyle
from reportlab.lib.enums import TA_CENTER, TA_LEFT, TA_JUSTIFY
from reportlab.platypus import Flowable
# ── Color palette ──────────────────────────────────────────────────────────────
C_NAVY = colors.HexColor('#0A1F44')
C_RED = colors.HexColor('#C0392B')
C_ORANGE = colors.HexColor('#E67E22')
C_GREEN = colors.HexColor('#1E8449')
C_TEAL = colors.HexColor('#117A65')
C_PURPLE = colors.HexColor('#6C3483')
C_LBLUE = colors.HexColor('#D6EAF8')
C_LGREEN = colors.HexColor('#D5F5E3')
C_LORANGE = colors.HexColor('#FDEBD0')
C_LRED = colors.HexColor('#FADBD8')
C_LPURPLE = colors.HexColor('#E8DAEF')
C_LGREY = colors.HexColor('#F2F3F4')
C_WHITE = colors.white
C_BLACK = colors.black
C_YELLOW = colors.HexColor('#FFF9C4')
C_LYELLOW = colors.HexColor('#FFFDE7')
W = A4[0] - 20*mm # usable width
# ── Document ───────────────────────────────────────────────────────────────────
doc = SimpleDocTemplate(
'/home/daytona/workspace/fmge-cheatsheet/FMGE_Community_Medicine_Cheatsheet.pdf',
pagesize=A4,
leftMargin=10*mm, rightMargin=10*mm,
topMargin=10*mm, bottomMargin=10*mm,
)
# ── Styles ─────────────────────────────────────────────────────────────────────
base = getSampleStyleSheet()
def S(name, **kw):
return ParagraphStyle(name, **kw)
TITLE = S('TITLE', fontName='Helvetica-Bold', fontSize=18, textColor=C_WHITE,
alignment=TA_CENTER, spaceAfter=2)
SUB = S('SUB', fontName='Helvetica-Bold', fontSize=10, textColor=C_WHITE,
alignment=TA_CENTER, spaceAfter=1)
H1 = S('H1', fontName='Helvetica-Bold', fontSize=9, textColor=C_WHITE,
alignment=TA_LEFT, spaceAfter=1, spaceBefore=0, leading=11)
H2 = S('H2', fontName='Helvetica-Bold', fontSize=8, textColor=C_NAVY,
alignment=TA_LEFT, spaceAfter=1, spaceBefore=2, leading=10)
BODY = S('BODY', fontName='Helvetica', fontSize=7, textColor=C_BLACK,
alignment=TA_LEFT, spaceAfter=0, spaceBefore=0, leading=9)
BODYSM = S('BODYSM', fontName='Helvetica', fontSize=6.5,textColor=C_BLACK,
alignment=TA_LEFT, spaceAfter=0, spaceBefore=0, leading=8.5)
BOLD = S('BOLD', fontName='Helvetica-Bold', fontSize=7, textColor=C_BLACK,
alignment=TA_LEFT, spaceAfter=0, spaceBefore=0, leading=9)
RED = S('RED', fontName='Helvetica-Bold', fontSize=7, textColor=C_RED,
alignment=TA_LEFT, spaceAfter=0, spaceBefore=0, leading=9)
NOTE = S('NOTE', fontName='Helvetica-Oblique',fontSize=6.5,textColor=C_PURPLE,
alignment=TA_LEFT, spaceAfter=0, spaceBefore=0, leading=8)
TH = S('TH', fontName='Helvetica-Bold', fontSize=7, textColor=C_WHITE,
alignment=TA_CENTER, spaceAfter=0, spaceBefore=0, leading=9)
TH_L = S('TH_L', fontName='Helvetica-Bold', fontSize=7, textColor=C_WHITE,
alignment=TA_LEFT, spaceAfter=0, spaceBefore=0, leading=9)
TD = S('TD', fontName='Helvetica', fontSize=6.8,textColor=C_BLACK,
alignment=TA_LEFT, spaceAfter=0, spaceBefore=0, leading=8.5)
TD_B = S('TD_B', fontName='Helvetica-Bold', fontSize=6.8,textColor=C_BLACK,
alignment=TA_LEFT, spaceAfter=0, spaceBefore=0, leading=8.5)
TD_R = S('TD_R', fontName='Helvetica-Bold', fontSize=6.8,textColor=C_RED,
alignment=TA_LEFT, spaceAfter=0, spaceBefore=0, leading=8.5)
TD_C = S('TD_C', fontName='Helvetica', fontSize=6.8,textColor=C_BLACK,
alignment=TA_CENTER, spaceAfter=0, spaceBefore=0, leading=8.5)
TD_BC = S('TD_BC', fontName='Helvetica-Bold', fontSize=6.8,textColor=C_BLACK,
alignment=TA_CENTER, spaceAfter=0, spaceBefore=0, leading=8.5)
# ── Helper builders ────────────────────────────────────────────────────────────
def section_header(text, bg=C_NAVY, fg=C_WHITE, fs=9):
style = ParagraphStyle('sh', fontName='Helvetica-Bold', fontSize=fs,
textColor=fg, alignment=TA_LEFT, leading=fs+2,
spaceAfter=1, spaceBefore=3)
t = Table([[Paragraph(text, style)]], colWidths=[W])
t.setStyle(TableStyle([
('BACKGROUND', (0,0), (-1,-1), bg),
('LEFTPADDING', (0,0), (-1,-1), 4),
('RIGHTPADDING', (0,0), (-1,-1), 4),
('TOPPADDING', (0,0), (-1,-1), 2),
('BOTTOMPADDING', (0,0), (-1,-1), 2),
('ROUNDEDCORNERS', [3,3,3,3]),
]))
return t
def sub_header(text, bg=C_TEAL):
return section_header(text, bg=bg, fg=C_WHITE, fs=8)
def make_table(headers, rows, col_widths, header_bg=C_NAVY, alt=True, fontsize=6.8):
td_s = ParagraphStyle('tds', fontName='Helvetica', fontSize=fontsize,
textColor=C_BLACK, leading=fontsize+1.5, spaceAfter=0, spaceBefore=0)
td_b = ParagraphStyle('tdb', fontName='Helvetica-Bold', fontSize=fontsize,
textColor=C_BLACK, leading=fontsize+1.5, spaceAfter=0, spaceBefore=0)
th_s = ParagraphStyle('ths', fontName='Helvetica-Bold', fontSize=fontsize,
textColor=C_WHITE, leading=fontsize+1.5, spaceAfter=0, spaceBefore=0,
alignment=TA_CENTER)
th_l = ParagraphStyle('thl', fontName='Helvetica-Bold', fontSize=fontsize,
textColor=C_WHITE, leading=fontsize+1.5, spaceAfter=0, spaceBefore=0)
data = [[Paragraph(h, th_l) for h in headers]]
for row in rows:
data_row = []
for cell in row:
if isinstance(cell, str):
if cell.startswith('**') and cell.endswith('**'):
data_row.append(Paragraph(cell[2:-2], td_b))
else:
data_row.append(Paragraph(cell, td_s))
else:
data_row.append(cell)
data.append(data_row)
t = Table(data, colWidths=col_widths, repeatRows=1)
style = [
('BACKGROUND', (0,0), (-1,0), header_bg),
('GRID', (0,0), (-1,-1), 0.3, colors.HexColor('#CCCCCC')),
('ROWBACKGROUNDS', (0,1), (-1,-1), [C_WHITE, C_LGREY] if alt else [C_WHITE]),
('TOPPADDING', (0,0), (-1,-1), 2),
('BOTTOMPADDING', (0,0), (-1,-1), 2),
('LEFTPADDING', (0,0), (-1,-1), 3),
('RIGHTPADDING', (0,0), (-1,-1), 3),
('VALIGN', (0,0), (-1,-1), 'TOP'),
]
t.setStyle(TableStyle(style))
return t
def highlight_box(text, bg=C_LYELLOW, border=C_ORANGE):
p = Paragraph(text, ParagraphStyle('hb', fontName='Helvetica-Bold', fontSize=7,
textColor=C_BLACK, leading=9, spaceAfter=0, spaceBefore=0))
t = Table([[p]], colWidths=[W])
t.setStyle(TableStyle([
('BACKGROUND', (0,0), (-1,-1), bg),
('BOX', (0,0), (-1,-1), 1, border),
('LEFTPADDING', (0,0), (-1,-1), 5),
('RIGHTPADDING', (0,0), (-1,-1), 5),
('TOPPADDING', (0,0), (-1,-1), 3),
('BOTTOMPADDING', (0,0), (-1,-1), 3),
]))
return t
def two_col(left_content, right_content, lw=None, rw=None):
lw = lw or W*0.5 - 2*mm
rw = rw or W*0.5 - 2*mm
t = Table([[left_content, right_content]], colWidths=[lw, rw])
t.setStyle(TableStyle([
('VALIGN', (0,0), (-1,-1), 'TOP'),
('LEFTPADDING', (0,0), (-1,-1), 0),
('RIGHTPADDING', (0,0), (-1,-1), 2),
('TOPPADDING', (0,0), (-1,-1), 0),
('BOTTOMPADDING', (0,0), (-1,-1), 0),
]))
return t
def sp(h=2): return Spacer(1, h)
# ══════════════════════════════════════════════════════════════════════════════
# BUILD CONTENT
# ══════════════════════════════════════════════════════════════════════════════
story = []
# ─────────────────────────── COVER / PAGE 1 ────────────────────────────────
cover = Table([[
Paragraph('FMGE COMMUNITY MEDICINE', TITLE),
Paragraph('Quick Reference Cheat Sheet • Exam Day Edition • Park\'s Textbook Based', SUB),
Paragraph('Epidemiology • Biostatistics • Preventive Medicine • Health Programs • Environment', SUB),
]], colWidths=[W])
cover.setStyle(TableStyle([
('BACKGROUND', (0,0), (-1,-1), C_NAVY),
('LEFTPADDING', (0,0), (-1,-1), 6),
('RIGHTPADDING', (0,0), (-1,-1), 6),
('TOPPADDING', (0,0), (-1,-1), 5),
('BOTTOMPADDING', (0,0), (-1,-1), 5),
('ROUNDEDCORNERS', [4,4,4,4]),
]))
story.append(cover)
story.append(sp(3))
# ─────────────────────── PAGE 1: EPIDEMIOLOGY CORE ─────────────────────────
story.append(section_header('📊 PAGE 1 — EPIDEMIOLOGY: STUDY DESIGNS & MEASURES', C_NAVY))
story.append(sp(2))
# Study designs table
story.append(sub_header('STUDY DESIGNS AT A GLANCE', C_TEAL))
story.append(sp(1))
story.append(make_table(
['Study', 'Direction', 'Unit', 'Measures', 'Best For', 'Key Flaw'],
[
['**RCT**', 'Prospective', 'Individual', 'RR, NNT', '**Gold std causation**', 'Expensive, ethical issues'],
['**Cohort**', 'Prospective', 'Individual', '**RR, AR, Incidence**', 'Common exposure, multiple outcomes', 'Loss to follow-up, costly'],
['**Case-Control**', 'Retrospective', 'Individual', '**Odds Ratio (OR)**', '**Rare disease**', 'Recall bias, no incidence'],
['**Cross-Sectional**', 'Snapshot', 'Individual', '**Prevalence**', 'Planning, prevalence surveys', 'Cannot prove causality'],
['**Ecological**', 'Any', 'Group', 'Correlation', 'Hypothesis generation', '**Ecological fallacy**'],
['**Case Series/Report**', 'Retrospective', 'Individual', 'Descriptive', 'Rare/new disease description', 'No control group'],
],
[22*mm, 22*mm, 22*mm, 32*mm, 38*mm, 38*mm],
header_bg=C_TEAL
))
story.append(sp(2))
# 2x2 table + OR/RR
left_col = []
left_col.append(sub_header('2×2 CONTINGENCY TABLE', C_RED))
left_col.append(sp(1))
left_col.append(make_table(
['', 'Disease +', 'Disease −', 'Total'],
[
['**Exposed**', 'a', 'b', 'a+b'],
['**Not Exposed**', 'c', 'd', 'c+d'],
['**Total**', 'a+c', 'b+d', 'N'],
],
[22*mm, 20*mm, 20*mm, 16*mm], header_bg=C_RED
))
left_col.append(sp(2))
left_col.append(make_table(
['Measure', 'Formula', 'Study'],
[
['**OR**', 'ad / bc', 'Case-control'],
['**RR**', '[a/(a+b)] ÷ [c/(c+d)]', 'Cohort/RCT'],
['**AR**', 'Inc(exp) − Inc(unexp)', 'Cohort'],
['**AR%**', 'AR / Inc(exp) × 100', 'Cohort'],
['**PAR**', 'Inc(total) − Inc(unexp)', 'Cohort'],
['**NNT**', '1 / ARR', 'RCT'],
],
[20*mm, 35*mm, 22*mm], header_bg=C_RED
))
right_col = []
right_col.append(sub_header('INTERPRETATION', C_GREEN))
right_col.append(sp(1))
right_col.append(make_table(
['Value', 'Meaning'],
[
['RR/OR = 1', 'No association'],
['RR/OR > 1', 'Risk factor (positive assoc.)'],
['RR/OR < 1', 'Protective factor'],
['p < 0.05', '**Statistically significant**'],
['95% CI includes 1', 'NOT significant'],
['95% CI excludes 1', 'Significant'],
],
[18*mm, 52*mm], header_bg=C_GREEN
))
right_col.append(sp(2))
right_col.append(highlight_box('⚠ OR ≈ RR only when disease prevalence < 10% (rare disease assumption)', C_LYELLOW, C_ORANGE))
right_col.append(sp(1))
right_col.append(make_table(
['Error', 'Type', 'α/β'],
[
['False Positive (reject true H₀)', '**Type I (α)**', 'α = 0.05'],
['False Negative (accept false H₀)', '**Type II (β)**', 'β = 0.20'],
['Power = 1 − β', '**0.80 (80%)**', ''],
],
[42*mm, 22*mm, 13*mm], header_bg=C_PURPLE
))
lw = W*0.51
rw = W - lw - 2*mm
story.append(two_col(
Table([[f] for f in left_col], colWidths=[lw]),
Table([[f] for f in right_col], colWidths=[rw]),
lw=lw, rw=rw
))
story.append(PageBreak())
# ──────────────────── PAGE 2: BIOSTATISTICS ─────────────────────────────────
story.append(section_header('🔢 PAGE 2 — BIOSTATISTICS: TESTS, DISTRIBUTIONS & SAMPLING', C_NAVY))
story.append(sp(2))
b_left = []
b_left.append(sub_header('STATISTICAL TESTS', C_TEAL))
b_left.append(sp(1))
b_left.append(make_table(
['Situation', 'Test'],
[
['2 groups, continuous, normal', '**Independent t-test**'],
['2 groups, continuous, non-normal', '**Mann-Whitney U**'],
['Paired (before/after) normal', '**Paired t-test**'],
['Paired, non-normal', '**Wilcoxon signed-rank**'],
['≥3 groups, normal', '**ANOVA (F-test)**'],
['≥3 groups, non-normal', '**Kruskal-Wallis**'],
['2 categorical variables', '**Chi-square (χ²)**'],
['Expected cell < 5', '**Fisher\'s Exact**'],
['Correlation, normal', '**Pearson\'s r**'],
['Correlation, non-normal/ordinal', '**Spearman\'s rank**'],
['Binary outcome, multiple predictors', '**Logistic regression**'],
['Continuous outcome, multiple predictors', '**Multiple linear regression**'],
],
[52*mm, 36*mm], header_bg=C_TEAL
))
b_right = []
b_right.append(sub_header('NORMAL DISTRIBUTION', C_NAVY))
b_right.append(sp(1))
b_right.append(make_table(
['Range', '% Population'],
[
['Mean ± 1 SD', '**68.27%**'],
['Mean ± 1.96 SD', '**95%** (reference range)'],
['Mean ± 2 SD', '**95.45%**'],
['Mean ± 2.58 SD', '**99%**'],
['Mean ± 3 SD', '**99.73%**'],
],
[34*mm, 30*mm], header_bg=C_NAVY
))
b_right.append(sp(2))
b_right.append(sub_header('CONFIDENCE INTERVALS', C_PURPLE))
b_right.append(sp(1))
b_right.append(make_table(
['CI Level', 'Formula', 'Z'],
[
['95% CI', 'Mean ± 1.96 × SE', '1.96'],
['99% CI', 'Mean ± 2.58 × SE', '2.58'],
['SE of mean', 'SD / √n', '—'],
],
[22*mm, 32*mm, 10*mm], header_bg=C_PURPLE
))
b_right.append(sp(2))
b_right.append(sub_header('SAMPLING METHODS', C_ORANGE))
b_right.append(sp(1))
b_right.append(make_table(
['Method', 'Key Feature'],
[
['Simple Random', 'Equal probability; random number table'],
['Systematic', 'Every nth; risk of periodicity bias'],
['Stratified', 'Subgroups proportionally represented'],
['**Cluster**', 'Natural groups; used in **national surveys**; highest sampling error'],
['Multistage', 'Stages: state→district→village→HH'],
],
[26*mm, 46*mm], header_bg=C_ORANGE
))
lw2 = W*0.53
rw2 = W - lw2 - 2*mm
story.append(two_col(
Table([[f] for f in b_left], colWidths=[lw2]),
Table([[f] for f in b_right], colWidths=[rw2]),
lw=lw2, rw=rw2
))
story.append(sp(2))
# Measures of central tendency
story.append(sub_header('MEASURES OF CENTRAL TENDENCY & DISPERSION', C_GREEN))
story.append(sp(1))
story.append(make_table(
['Measure', 'Formula / Definition', 'Use When'],
[
['**Mean**', 'Sum / n', 'Normal distribution'],
['**Median**', 'Middle value (n/2 rank)', 'Skewed data, ordinal'],
['**Mode**', 'Most frequent value', 'Nominal data, bimodal'],
['**SD**', '√[Σ(x−x̄)² / (n−1)]', 'Spread around mean'],
['**SE**', 'SD / √n', 'Precision of sample mean (↑n → ↓SE)'],
['**CV**', 'SD / Mean × 100', 'Compare variability between different units'],
['**IQR**', 'Q3 − Q1', 'Non-normal data spread'],
],
[22*mm, 50*mm, 55*mm], header_bg=C_GREEN
))
story.append(PageBreak())
# ──────────────────── PAGE 3: SCREENING & VALIDITY ──────────────────────────
story.append(section_header('🔍 PAGE 3 — SCREENING, VALIDITY & RELIABILITY', C_NAVY))
story.append(sp(2))
sc_left = []
sc_left.append(sub_header('SENSITIVITY & SPECIFICITY', C_RED))
sc_left.append(sp(1))
sc_left.append(make_table(
['', 'Disease +', 'Disease −'],
[
['**Test +**', '**TP**', '**FP** (Type I)'],
['**Test −**', '**FN** (Type II)', '**TN**'],
],
[22*mm, 28*mm, 28*mm], header_bg=C_RED
))
sc_left.append(sp(1))
sc_left.append(make_table(
['Measure', 'Formula', 'Mnemonic'],
[
['**Sensitivity**', 'TP / (TP+FN)', '**SnNout**: High Sn → −ve rules OUT'],
['**Specificity**', 'TN / (TN+FP)', '**SpPin**: High Sp → +ve rules IN'],
['**PPV**', 'TP / (TP+FP)', '↑ with ↑ prevalence'],
['**NPV**', 'TN / (TN+FN)', '↑ with ↓ prevalence'],
['**LR+**', 'Sensitivity / (1−Specificity)', '>10 = very useful'],
['**LR−**', '(1−Sensitivity) / Specificity', '<0.1 = very useful'],
['**Accuracy**', '(TP+TN) / Total', '—'],
],
[22*mm, 34*mm, 40*mm], header_bg=C_RED
))
sc_left.append(sp(1))
sc_left.append(highlight_box('KEY: Sensitivity & Specificity are properties of the TEST (unchanged by prevalence). PPV & NPV depend on PREVALENCE of the disease.', C_LRED, C_RED))
sc_right = []
sc_right.append(sub_header('SCREENING CRITERIA (Wilson & Jungner)', C_GREEN))
sc_right.append(sp(1))
sc_right.append(make_table(
['#', 'Criterion'],
[
['1', 'Important health problem'],
['2', 'Recognizable latent / early stage'],
['3', 'Accepted treatment available'],
['4', 'Suitable screening test exists'],
['5', 'Natural history understood'],
['6', 'Cost-effective'],
['7', 'Facilities for diagnosis & treatment available'],
],
[8*mm, 60*mm], header_bg=C_GREEN
))
sc_right.append(sp(2))
sc_right.append(sub_header('VALIDITY vs RELIABILITY', C_PURPLE))
sc_right.append(sp(1))
sc_right.append(make_table(
['Term', 'Definition'],
[
['**Validity**', 'Measures what it should (Sn + Sp)'],
['**Reliability**', 'Reproducibility / Consistency'],
['**Accuracy**', 'Closeness to true value'],
['**Precision**', 'Repeatability (low random error)'],
['**Kappa (κ)**', 'Inter-rater agreement beyond chance: >0.75 excellent, 0.4–0.75 good, <0.4 poor'],
],
[22*mm, 46*mm], header_bg=C_PURPLE
))
sc_right.append(sp(2))
sc_right.append(sub_header('LEAD TIME & LENGTH BIAS', C_ORANGE))
sc_right.append(sp(1))
sc_right.append(make_table(
['Bias', 'Description'],
[
['**Lead time**', 'Early detection falsely appears to prolong survival'],
['**Length**', 'Slowly progressing disease over-represented in screening'],
['**Selection (Berkson\'s)**', 'Hospital controls differ from general population'],
['**Neyman**', 'Prevalence ≠ incidence cases (fatal cases missed)'],
['**Recall**', 'Cases recall exposure better than controls'],
],
[26*mm, 42*mm], header_bg=C_ORANGE
))
lw3 = W*0.51
rw3 = W - lw3 - 2*mm
story.append(two_col(
Table([[f] for f in sc_left], colWidths=[lw3]),
Table([[f] for f in sc_right], colWidths=[rw3]),
lw=lw3, rw=rw3
))
story.append(PageBreak())
# ──────────────────── PAGE 4: MORTALITY & MORBIDITY RATES ───────────────────
story.append(section_header('📈 PAGE 4 — MORTALITY, MORBIDITY & DEMOGRAPHIC RATES', C_NAVY))
story.append(sp(2))
story.append(sub_header('KEY MORTALITY RATES & RATIOS', C_RED))
story.append(sp(1))
story.append(make_table(
['Rate / Ratio', 'Numerator', 'Denominator', 'Multiplier', 'Normal (India)'],
[
['**Crude Death Rate**', 'Total deaths in year', 'Midyear population', '×1000', '~6-7/1000'],
['**Infant Mortality Rate (IMR)**', 'Deaths <1 yr', '**Live births**', '×1000', '~27-28 (India 2020)'],
['**Neonatal MR**', 'Deaths <28 days', 'Live births', '×1000', '~20 (India)'],
['**Post-neonatal MR**', 'Deaths 28d−<1yr', 'Live births', '×1000', '—'],
['**Perinatal MR**', 'Stillbirths + Deaths <7days', '**Stillbirths + Live births**', '×1000', '~30'],
['**Under-5 Mortality Rate**', 'Deaths <5yr', 'Live births', '×1000', '~32 (India 2020)'],
['**Maternal Mortality Ratio**', 'Maternal deaths', '**Live births**', '×100,000', '~97 (India 2020)'],
['**Maternal Mortality Rate**', 'Maternal deaths', 'Women 15−44 yrs', '×100,000', '—'],
['**Case Fatality Rate**', 'Deaths from disease X', 'Cases of disease X', '×100 (%)', 'Disease-specific'],
['**Proportional Mortality**', 'Deaths from cause X', 'Total deaths', '×100 (%)', '—'],
['**Standardized Mortality Ratio**', 'Observed deaths', 'Expected deaths', '×100', '>100 = excess mortality'],
],
[38*mm, 38*mm, 32*mm, 18*mm, 33*mm],
header_bg=C_RED
))
story.append(sp(2))
rates_left = []
rates_left.append(sub_header('MORBIDITY MEASURES', C_TEAL))
rates_left.append(sp(1))
rates_left.append(make_table(
['Measure', 'Definition', 'Formula'],
[
['**Incidence Rate**', 'NEW cases / time period', 'New cases / Pop-at-risk × k'],
['**Point Prevalence**', 'All cases at one point in time', 'Cases / Total pop × k'],
['**Period Prevalence**', 'All cases over a period', 'Cases / Total pop × k'],
['**Attack Rate**', 'Cases in exposed group', 'Cases / Exposed × 100'],
['**SAR**', 'New cases among contacts', 'New cases / Contacts × 100'],
],
[26*mm, 36*mm, 30*mm], header_bg=C_TEAL
))
rates_left.append(sp(1))
rates_left.append(highlight_box('Prevalence = Incidence × Duration of disease\nHigh prevalence despite low incidence = LONG DURATION disease (e.g., DM, TB)', C_LBLUE, C_TEAL))
rates_right = []
rates_right.append(sub_header('FERTILITY / NATALITY RATES', C_ORANGE))
rates_right.append(sp(1))
rates_right.append(make_table(
['Rate', 'Numerator', 'Denominator', '×'],
[
['**CBR** (Crude Birth Rate)', 'Live births', 'Midyear pop', '1000'],
['**GFR** (General Fertility)', 'Live births', 'Women 15−44', '1000'],
['**TFR** (Total Fertility)', 'Sum of age-specific fertility rates', '—', '—'],
['**NRR** (Net Reproduction)', 'Daughters born to one cohort', '—', '—'],
['**Sex Ratio at Birth**', 'Males', 'Females × 100', '—'],
],
[28*mm, 28*mm, 24*mm, 8*mm], header_bg=C_ORANGE
))
rates_right.append(sp(1))
rates_right.append(highlight_box('IMR = BEST indicator of: Socioeconomic development, Health services, Community health status\nIndia IMR target: <25/1000 (NHP 2017)', C_LYELLOW, C_ORANGE))
lw4 = W*0.51
rw4 = W - lw4 - 2*mm
story.append(two_col(
Table([[f] for f in rates_left], colWidths=[lw4]),
Table([[f] for f in rates_right], colWidths=[rw4]),
lw=lw4, rw=rw4
))
story.append(PageBreak())
# ──────────────────── PAGE 5: DISEASE CAUSATION & NATURAL HISTORY ────────────
story.append(section_header('🦠 PAGE 5 — DISEASE CAUSATION, NATURAL HISTORY & PREVENTION', C_NAVY))
story.append(sp(2))
nh_left = []
nh_left.append(sub_header('LEVELS OF PREVENTION', C_NAVY))
nh_left.append(sp(1))
nh_left.append(make_table(
['Level', 'Target', 'Examples'],
[
['**Primordial**', 'Prevent risk factor emergence', 'Mass media campaigns, policy (no junk food in schools)'],
['**Primary**', 'Prevent disease in healthy', 'Vaccination, health education, sanitation, seat belts'],
['**Secondary**', 'Early detection & treatment', 'Screening, early diagnosis, case finding'],
['**Tertiary**', 'Limit disability, rehabilitate', 'Physiotherapy, prosthesis, occupational therapy'],
],
[22*mm, 30*mm, 52*mm], header_bg=C_NAVY
))
nh_left.append(sp(1))
nh_left.append(sub_header('NATURAL HISTORY OF DISEASE (Leavell & Clark)', C_TEAL))
nh_left.append(sp(1))
nh_left.append(make_table(
['Phase', 'Stage', 'Prevention'],
[
['Pre-pathogenesis', 'Susceptibility → interaction of agent-host-env', '**Primary prevention**'],
['Pathogenesis (Early)', 'Pathological changes, sub-clinical', '**Secondary prevention** (screening)'],
['Pathogenesis (Late)', 'Clinical disease, disability', '**Tertiary prevention**'],
],
[32*mm, 48*mm, 28*mm], header_bg=C_TEAL
))
nh_left.append(sp(1))
nh_left.append(sub_header("BRADFORD HILL'S CRITERIA (Causation)", C_PURPLE))
nh_left.append(sp(1))
nh_left.append(make_table(
['Criterion', 'Key Point'],
[
['**Temporality**', '**Only ESSENTIAL criterion** — cause must precede effect'],
['Strength', 'High RR/OR'],
['Consistency', 'Repeated findings across studies'],
['Specificity', 'One cause → one disease'],
['Biological gradient', 'Dose-response relationship'],
['Plausibility', 'Biologically credible'],
['Coherence', 'Consistent with natural history'],
['Experiment', 'Removal of cause reduces disease'],
['Analogy', 'Similar cause → similar effect'],
],
[28*mm, 62*mm], header_bg=C_PURPLE
))
nh_right = []
nh_right.append(sub_header('EPIDEMIOLOGICAL TRIANGLE', C_RED))
nh_right.append(sp(1))
nh_right.append(make_table(
['Component', 'Details'],
[
['**Agent**', 'Biological (bacteria, virus), chemical, physical, nutritional deficiency'],
['**Host**', 'Immunity, genetics, age, sex, occupation, nutritional status'],
['**Environment**', 'Physical, biological, social, cultural, economic'],
['**Time**', 'Incubation period, epidemic threshold, duration of illness'],
],
[20*mm, 58*mm], header_bg=C_RED
))
nh_right.append(sp(1))
nh_right.append(sub_header('WEB OF CAUSATION', C_ORANGE))
nh_right.append(sp(1))
nh_right.append(Paragraph('Multiple interacting factors determine disease. No single cause is sufficient. Used for chronic non-communicable diseases (e.g., CHD). Proposed by MacMahon & Pugh.', BODYSM))
nh_right.append(sp(1))
nh_right.append(sub_header('MODES OF DISEASE TRANSMISSION', C_TEAL))
nh_right.append(sp(1))
nh_right.append(make_table(
['Mode', 'Examples'],
[
['**Direct**: Contact', 'STIs, rabies, ringworm'],
['**Direct**: Droplet', 'Measles, flu (>5µm, <1m distance)'],
['**Indirect**: Airborne', 'TB, measles (droplet nuclei <5µm, >1m)'],
['**Indirect**: Vehicle (fomite)', 'Hepatitis A, cholera (water/food)'],
['**Indirect**: Vector', 'Malaria (Anopheles), dengue (Aedes)'],
['**Vertical**: Transplacental', 'HIV, rubella, syphilis, CMV'],
],
[36*mm, 42*mm], header_bg=C_TEAL
))
nh_right.append(sp(1))
nh_right.append(sub_header('HERD IMMUNITY', C_GREEN))
nh_right.append(sp(1))
nh_right.append(make_table(
['Disease', 'Herd Immunity Threshold'],
[
['Measles', '**~95%**'],
['Polio', '**~85%**'],
['Smallpox', '**~80-85%**'],
['Diphtheria', '**~85%**'],
['COVID-19 (varies)', '~60-80%'],
],
[40*mm, 38*mm], header_bg=C_GREEN
))
lw5 = W*0.52
rw5 = W - lw5 - 2*mm
story.append(two_col(
Table([[f] for f in nh_left], colWidths=[lw5]),
Table([[f] for f in nh_right], colWidths=[rw5]),
lw=lw5, rw=rw5
))
story.append(PageBreak())
# ──────────────────── PAGE 6: IMMUNIZATION ──────────────────────────────────
story.append(section_header('💉 PAGE 6 — IMMUNIZATION & VACCINES', C_NAVY))
story.append(sp(2))
story.append(sub_header('UNIVERSAL IMMUNIZATION PROGRAMME (UIP) — INDIA', C_TEAL))
story.append(sp(1))
story.append(make_table(
['Age', 'Vaccine', 'Route', 'Dose', 'Notes'],
[
['**At birth**', 'BCG', 'Intradermal (left arm)', '0.05 mL (<1 yr), 0.1 mL (>1 yr)', 'Scar appears 2-4 wks; PPD+ at 6 wks'],
['**At birth**', 'OPV-0 (Birth dose)', 'Oral', '2 drops', 'Given within 24 hrs'],
['**At birth**', 'Hepatitis B (HepB-0)', 'IM (antero-lateral thigh)', '0.5 mL', 'Within 24 hrs of birth'],
['**6, 10, 14 wks**', 'OPV-1,2,3 + IPV', 'Oral + IM', '2 drops + 0.5mL', 'IPV at 6 & 14 wks'],
['**6, 10, 14 wks**', 'Pentavalent (DPT+HepB+Hib)', 'IM', '0.5 mL', 'Antero-lateral thigh'],
['**6, 10, 14 wks**', 'Rotavirus vaccine', 'Oral', '5 drops', 'Under UIP 2016'],
['**9-12 months**', 'MR (Measles-Rubella)', 'SC (right arm)', '0.5 mL', '**No MR after 9 months**'],
['**9-12 months**', 'JE vaccine (endemic areas)', 'SC', '0.5 mL', 'Endemic areas only'],
['**9-12 months**', 'Vitamin A (1st dose)', 'Oral', '1 lakh IU', 'With MR vaccine'],
['**16-24 months**', 'DPT Booster-1 + OPV Booster', 'IM + Oral', '0.5mL + 2 drops', '—'],
['**16-24 months**', 'MR Booster', 'SC', '0.5 mL', '—'],
['**5-6 years**', 'DPT Booster-2', 'IM', '0.5 mL', 'School entry'],
['**10 & 16 years**', 'Td (Tetanus+low-dose diphtheria)', 'IM', '0.5 mL', 'Replaces TT'],
['**Pregnant women**', 'Td (2 doses or 1 booster)', 'IM', '0.5 mL', 'TT-1 early; TT-2 4 wks later'],
],
[22*mm, 32*mm, 26*mm, 22*mm, 55*mm],
header_bg=C_TEAL, fontsize=6.5
))
story.append(sp(2))
vac_left = []
vac_left.append(sub_header('COLD CHAIN TEMPERATURES', C_RED))
vac_left.append(sp(1))
vac_left.append(make_table(
['Level', 'Temperature'],
[
['State / Regional store (ILR)', '**+2°C to +8°C**'],
['District / PHC level (ILR)', '+2°C to +8°C'],
['Walk-in cooler', '+2°C to +8°C'],
['Deep Freezer (OPV, Measles)', '**−15°C to −25°C**'],
['Vaccine carrier (field)', '+2°C to +8°C (ice packs)'],
['VVM (Vaccine Vial Monitor)', 'Color change = discard'],
],
[42*mm, 30*mm], header_bg=C_RED
))
vac_right = []
vac_right.append(sub_header('VACCINE TYPES & EXAMPLES', C_PURPLE))
vac_right.append(sp(1))
vac_right.append(make_table(
['Type', 'Examples'],
[
['**Live attenuated**', 'BCG, OPV, MMR, Varicella, Yellow fever, Rotavirus'],
['**Killed/Inactivated**', 'IPV (Salk), Rabies (HDCV), Hep A, Pertussis (whole cell), TCV'],
['**Toxoid**', 'Tetanus (TT/Td), Diphtheria'],
['**Subunit/recombinant**', 'Hepatitis B, HPV, Acellular pertussis'],
['**Conjugate**', 'Hib, PCV, MenACWY'],
['**mRNA**', 'COVID-19 (Pfizer, Moderna)'],
],
[28*mm, 44*mm], header_bg=C_PURPLE
))
vac_right.append(sp(1))
vac_right.append(highlight_box('OPV: Sabin (live oral) — can cause VAPP (1/2.4M doses)\nIPV: Salk (killed injectable) — cannot cause VAPP\nBCG contraindicated in HIV+ (if symptomatic)', C_LRED, C_RED))
lw6 = W*0.48
rw6 = W - lw6 - 2*mm
story.append(two_col(
Table([[f] for f in vac_left], colWidths=[lw6]),
Table([[f] for f in vac_right], colWidths=[rw6]),
lw=lw6, rw=rw6
))
story.append(PageBreak())
# ──────────────────── PAGE 7: COMMUNICABLE DISEASE CONTROL ──────────────────
story.append(section_header('🦟 PAGE 7 — COMMUNICABLE DISEASES: KEY FACTS FOR FMGE', C_NAVY))
story.append(sp(2))
story.append(sub_header('IMPORTANT INCUBATION PERIODS', C_RED))
story.append(sp(1))
story.append(make_table(
['Disease', 'Incubation Period', 'Disease', 'Incubation Period'],
[
['**Cholera**', '6 hrs – 5 days (usually 1-3d)', '**Measles**', '10-14 days (range 7-21d)'],
['**Typhoid**', '1-3 weeks (range 3-60d)', '**Mumps**', '14-21 days'],
['**Rabies**', '2-8 weeks (range 10d-2yr)', '**Rubella**', '14-21 days'],
['**Polio**', '7-14 days (range 3-35d)', '**Chickenpox**', '14-16 days (range 10-21d)'],
['**Diphtheria**', '2-5 days', '**Hepatitis A**', '15-50 days (avg 28d)'],
['**Tetanus**', '3-21 days (avg 10d)', '**Hepatitis B**', '45-180 days (avg 60-90d)'],
['**Pertussis**', '7-10 days', '**HIV/AIDS**', '2-4 wks (seroconversion)'],
['**Meningococcal**', '2-10 days', '**Plague**', '2-6 days'],
['**Malaria (P.falciparum)**', '7-14 days', '**Malaria (P.vivax)**', '12-17 days'],
['**Dengue**', '4-7 days (range 3-14d)', '**COVID-19**', '2-14 days (avg 5-6d)'],
],
[28*mm, 36*mm, 28*mm, 36*mm],
header_bg=C_RED, fontsize=6.5
))
story.append(sp(2))
cd_left = []
cd_left.append(sub_header('VECTORS & DISEASES', C_TEAL))
cd_left.append(sp(1))
cd_left.append(make_table(
['Vector', 'Disease'],
[
['**Anopheles** mosquito', 'Malaria, Filariasis (also Culex)'],
['**Aedes aegypti**', '**Dengue**, Chikungunya, Yellow fever, Zika'],
['**Culex** mosquito', 'Filariasis (W.bancrofti), JE, West Nile'],
['**Phlebotomus** (sandfly)', 'Kala-azar (Leishmaniasis)'],
['**Ixodes** tick', 'Lyme disease, TBE'],
['**Ornithodoros** tick', 'Relapsing fever'],
['**Body louse** (Pediculus)', 'Epidemic typhus, Relapsing fever'],
['**Rat flea** (Xenopsylla)', 'Plague, Endemic typhus'],
['**Tsetse fly**', 'African trypanosomiasis (sleeping sickness)'],
['**Blackfly** (Simulium)', 'Onchocerciasis (river blindness)'],
['**Cyclops** (water flea)', 'Guinea worm (Dracunculiasis)'],
],
[30*mm, 52*mm], header_bg=C_TEAL, fontsize=6.5
))
cd_right = []
cd_right.append(sub_header('DISEASE SURVEILLANCE & NOTIFICATION', C_PURPLE))
cd_right.append(sp(1))
cd_right.append(make_table(
['Category', 'Examples'],
[
['**Notifiable diseases (India)**', 'Cholera, Plague, Yellow fever, Smallpox (internationally notifiable IHR)'],
['**IHR 2005 — Always notify**', 'Smallpox, Polio (wild), SARS, Human influenza (new subtype)'],
['**Zero-dose surveillance**', 'AFP, Measles, Neonatal tetanus'],
['**Sentinel surveillance**', 'HIV, Influenza (selected sites)'],
],
[28*mm, 54*mm], header_bg=C_PURPLE
))
cd_right.append(sp(1))
cd_right.append(sub_header('REPRODUCTIVE NUMBER (R₀)', C_ORANGE))
cd_right.append(sp(1))
cd_right.append(make_table(
['Disease', 'R₀'],
[
['**Measles**', '**12–18** (highest)'],
['Chickenpox', '8–10'],
['Mumps', '4–7'],
['Polio', '5–7'],
['COVID-19 (original)', '2–3'],
['Influenza (seasonal)', '1.2–1.4'],
['HIV', '2–5'],
],
[38*mm, 24*mm], header_bg=C_ORANGE
))
cd_right.append(sp(1))
cd_right.append(highlight_box('R₀ > 1 = epidemic potential | R₀ < 1 = epidemic will die out\nEffective R (Rt) accounts for immunity in population', C_LYELLOW, C_ORANGE))
lw7 = W*0.52
rw7 = W - lw7 - 2*mm
story.append(two_col(
Table([[f] for f in cd_left], colWidths=[lw7]),
Table([[f] for f in cd_right], colWidths=[rw7]),
lw=lw7, rw=rw7
))
story.append(PageBreak())
# ──────────────────── PAGE 8: NUTRITION ─────────────────────────────────────
story.append(section_header('🥗 PAGE 8 — NUTRITION & NUTRITIONAL DISORDERS', C_NAVY))
story.append(sp(2))
nut_left = []
nut_left.append(sub_header('PROTEIN-ENERGY MALNUTRITION (PEM)', C_RED))
nut_left.append(sp(1))
nut_left.append(make_table(
['Feature', 'Kwashiorkor', 'Marasmus'],
[
['**Deficiency**', 'Protein (adequate calories)', 'Calories + Protein (starvation)'],
['**Age**', '1-3 years', '<1 year (weaning)'],
['**Oedema**', '**Present** (pitting)', 'Absent'],
['**Skin changes**', 'Flaky paint dermatosis', 'Wrinkled, loose skin'],
['**Hair**', 'Flag sign (depigmentation)', 'Thin, sparse'],
['**Wt for age**', '60-80% of expected', '<60% of expected'],
['**Appetite**', 'Poor', 'Good (voracious)'],
['**Mood**', 'Miserable, apathetic', 'Alert, hungry'],
['**Fatty liver**', '**Present**', 'Absent'],
],
[22*mm, 36*mm, 36*mm], header_bg=C_RED
))
nut_left.append(sp(1))
nut_left.append(sub_header('ANTHROPOMETRIC INDICES (WHO)', C_TEAL))
nut_left.append(sp(1))
nut_left.append(make_table(
['Index', 'Reflects', 'Cut-off (Z-score)'],
[
['**Wt/Age** (underweight)', 'Overall malnutrition', '< −2 SD = underweight'],
['**Ht/Age** (stunting)', '**Chronic** malnutrition', '< −2 SD = stunted'],
['**Wt/Ht** (wasting)', '**Acute** malnutrition', '< −2 SD = wasted'],
['**MUAC**', 'Rapid field assessment', '<11.5 cm = SAM (<5yr)'],
['**BMI for age**', 'Overweight/obesity', '>+2 SD = overweight'],
],
[28*mm, 28*mm, 32*mm], header_bg=C_TEAL
))
nut_right = []
nut_right.append(sub_header('MICRONUTRIENT DEFICIENCIES', C_ORANGE))
nut_right.append(sp(1))
nut_right.append(make_table(
['Nutrient', 'Deficiency Disease', 'Key Features'],
[
['**Vitamin A**', 'Xerophthalmia', 'Night blindness → Bitot\'s spots → Corneal ulcer → Keratomalacia'],
['**Vitamin D**', 'Rickets (child) / Osteomalacia (adult)', 'Bow legs, Harrison\'s sulcus, Looser\'s zones on X-ray'],
['**Vitamin C**', 'Scurvy', 'Perifollicular haemorrhage, bleeding gums, Corkscrew hair, Frankel\'s line'],
['**Vitamin B1**', 'Beriberi', 'Wet (cardiac), Dry (neurological), Wernicke\'s (Wernicke-Korsakoff)'],
['**Vitamin B2**', 'Ariboflavinosis', 'Angular stomatitis, cheilosis, corneal vascularisation'],
['**Niacin (B3)**', 'Pellagra', '**4 Ds**: Dermatitis, Diarrhoea, Dementia, Death'],
['**Folate / B12**', 'Megaloblastic anaemia', 'Neural tube defects (folate), subacute combined degeneration (B12)'],
['**Iron**', 'IDA', 'Koilonychia, angular stomatitis, Plummer-Vinson syndrome'],
['**Iodine**', 'Goitre / Cretinism', 'Endemic goitre, hypothyroid, deaf-mutism'],
['**Zinc**', 'Growth retardation', 'Acrodermatitis enteropathica, hypogonadism, ageusia'],
['**Fluoride**', 'Dental/Skeletal fluorosis (>1.5 ppm)', 'Mottled enamel (0.5-1 ppm = optimal)'],
],
[18*mm, 28*mm, 58*mm], header_bg=C_ORANGE, fontsize=6.5
))
nut_right.append(sp(1))
nut_right.append(highlight_box('Vitamin A prophylaxis (UIP): 1 lakh IU at 9m, then 2 lakh IU every 6m up to 5yr\nOptimal fluoride in water: 0.5-0.8 ppm (India: 1 ppm)\nIodized salt: ≥30 ppm at production, ≥15 ppm at consumer level', C_LYELLOW, C_ORANGE))
lw8 = W*0.49
rw8 = W - lw8 - 2*mm
story.append(two_col(
Table([[f] for f in nut_left], colWidths=[lw8]),
Table([[f] for f in nut_right], colWidths=[rw8]),
lw=lw8, rw=rw8
))
story.append(PageBreak())
# ──────────────────── PAGE 9: MATERNAL & CHILD HEALTH ───────────────────────
story.append(section_header('👶 PAGE 9 — MATERNAL & CHILD HEALTH + FAMILY PLANNING', C_NAVY))
story.append(sp(2))
mch_left = []
mch_left.append(sub_header('ANTENATAL CARE (ANC) — MINIMUM CONTACTS', C_TEAL))
mch_left.append(sp(1))
mch_left.append(make_table(
['Contact', 'Timing', 'Key Activities'],
[
['**ANC-1**', '<12 weeks', 'Confirm pregnancy, BP, Hb, blood group, urine, counselling, IFA, TT-1'],
['**ANC-2**', '14-16 wks', 'Review tests, TT-2, weight, BP'],
['**ANC-3**', '28-32 wks', 'Lie/presentation, BP, Hb repeat, plan delivery'],
['**ANC-4**', '36 wks', 'Final check, plan place of delivery, danger signs'],
],
[15*mm, 18*mm, 68*mm], header_bg=C_TEAL
))
mch_left.append(sp(1))
mch_left.append(sub_header('DANGER SIGNS IN PREGNANCY (ABCDEFG)', C_RED))
mch_left.append(sp(1))
mch_left.append(make_table(
['Letter', 'Sign'],
[
['A', 'Absent or reduced fetal movements'],
['B', 'Bleeding P/V'],
['C', 'Convulsions'],
['D', 'Difficulty in breathing'],
['E', 'Excessive vomiting'],
['F', 'Fever'],
['G', 'Generalized oedema of face/hands'],
],
[10*mm, 80*mm], header_bg=C_RED
))
mch_left.append(sp(1))
mch_left.append(sub_header('BREAST FEEDING', C_GREEN))
mch_left.append(sp(1))
mch_left.append(make_table(
['Term', 'Definition'],
[
['**Colostrum**', 'First 3-4 days; rich in SIgA, vitamin A, protein; yellow, thick'],
['**Exclusive BF**', 'Only breast milk for **first 6 months** (no water, no food)'],
['**Complementary feeds**', 'Start at **6 months** (while continuing BF up to 2 yrs)'],
['**Rooming-in**', 'Mother-baby together 24hr; promotes BF initiation'],
],
[22*mm, 68*mm], header_bg=C_GREEN
))
mch_right = []
mch_right.append(sub_header('FAMILY PLANNING METHODS', C_PURPLE))
mch_right.append(sp(1))
mch_right.append(make_table(
['Method', 'Failure Rate (Pearl Index)', 'Notes'],
[
['**OCP (Combined)**', '0.1 (perfect); 3-8 (typical)', 'No protection vs STIs'],
['**POP (Mini-pill)**', '0.3-3', 'Suitable for lactating mothers'],
['**Cu-IUD (380A)**', '**0.6-0.8%**; lasts 10 yrs', 'Emergency contraception within 5 days'],
['**Condom (male)**', '2 (perfect); 15 (typical)', 'Only method protecting vs STIs'],
['**Vasectomy**', '**<0.1%**; failure if early intercourse', 'Simpler than tubectomy'],
['**Tubectomy (TL)**', '**0.5%**; Minilap under LA', 'Most effective LARC'],
['**Depo-Provera**', '0.3%', 'Injectable; every 3 months'],
['**LAM**', '<2% (if criteria met)', 'Amenorrhoea + exclusive BF + <6 months PP'],
['**Emergency contraception**', '75-85% effective', 'Levonorgestrel 1.5mg within 72 hrs'],
],
[30*mm, 30*mm, 48*mm], header_bg=C_PURPLE, fontsize=6.5
))
mch_right.append(sp(1))
mch_right.append(sub_header('GROWTH MILESTONES', C_ORANGE))
mch_right.append(sp(1))
mch_right.append(make_table(
['Age', 'Weight', 'Height', 'Milestone'],
[
['Birth', '3 kg', '50 cm', 'Head circumference ~33 cm'],
['**3 months**', '**Double birth weight** not yet', '—', 'Neck holding'],
['**5 months**', '**Double birth weight** (~6 kg)', '—', 'Roll over'],
['**1 year**', '**Triple birth weight** (~9 kg)', '**75 cm**', 'Walk with support'],
['**2 years**', '**4× birth wt** (~12 kg)', '**87 cm**', 'Runs, 2-3 word sentences'],
['5 years', '~18-20 kg', '~110 cm', 'Skip, full sentences'],
],
[14*mm, 20*mm, 16*mm, 40*mm], header_bg=C_ORANGE, fontsize=6.5
))
lw9 = W*0.51
rw9 = W - lw9 - 2*mm
story.append(two_col(
Table([[f] for f in mch_left], colWidths=[lw9]),
Table([[f] for f in mch_right], colWidths=[rw9]),
lw=lw9, rw=rw9
))
story.append(PageBreak())
# ──────────────────── PAGE 10: ENVIRONMENT & WATER ──────────────────────────
story.append(section_header('🌍 PAGE 10 — ENVIRONMENTAL HEALTH, WATER & AIR QUALITY', C_NAVY))
story.append(sp(2))
env_left = []
env_left.append(sub_header('WATER QUALITY STANDARDS (WHO / BIS)', C_TEAL))
env_left.append(sp(1))
env_left.append(make_table(
['Parameter', 'Desirable / Permissible Limit'],
[
['**Turbidity**', '1 NTU (desirable); <5 NTU (permissible)'],
['**pH**', '**6.5 – 8.5**'],
['**Fluoride**', '**1.0 ppm** (India); 0.5-0.8 ppm optimal'],
['**Nitrate**', '<45 mg/L (WHO: <50 mg/L); >45 = methaemoglobinaemia'],
['**Arsenic**', '0.01 mg/L (WHO); 0.05 mg/L (India)'],
['**Total Dissolved Solids**', '<500 mg/L (desirable); <2000 mg/L (permissible)'],
['**E. coli (coliforms)**', '**0** per 100 mL (treated supply)'],
['**Hardness**', '<200 mg/L (desirable); <600 mg/L (permissible)'],
['**Chlorine residual**', '**0.5 ppm** at consumer end'],
['**Chlorine demand**', 'Amount needed to disinfect; = Applied chlorine – Residual chlorine'],
],
[32*mm, 62*mm], header_bg=C_TEAL
))
env_left.append(sp(1))
env_left.append(sub_header('WATER PURIFICATION METHODS', C_NAVY))
env_left.append(sp(1))
env_left.append(make_table(
['Method', 'Effect / Notes'],
[
['**Sedimentation**', 'Removes suspended matter; coagulants (alum) used'],
['**Filtration (slow sand)**', 'Removes 99% bacteria; Schmutzdecke biological layer'],
['**Filtration (rapid sand)**', 'Faster; needs coagulation first; does NOT remove bacteria alone'],
['**Chlorination**', '**Most important** disinfection; kills bacteria and viruses'],
['**Boiling**', 'Most effective household method; kills all pathogens'],
['**UV radiation**', 'Kills bacteria/viruses; does not remove chemicals'],
['**Reverse osmosis**', 'Removes dissolved salts, arsenic, fluoride, bacteria'],
],
[32*mm, 62*mm], header_bg=C_NAVY
))
env_right = []
env_right.append(sub_header('AIR QUALITY & POLLUTION', C_RED))
env_right.append(sp(1))
env_right.append(make_table(
['Pollutant', 'Sources', 'Health Effect'],
[
['**PM2.5 / PM10**', 'Combustion, dust', 'Respiratory & CVS disease'],
['**CO**', 'Incomplete combustion, vehicles', 'Binds Hb (COHb); headache, death'],
['**SO₂**', 'Coal burning, smelters', 'Acid rain, bronchoconstriction'],
['**NO₂**', 'Vehicles, power plants', 'Respiratory inflammation'],
['**Ozone (O₃)**', 'Photochemical smog', 'Eye/lung irritation; high altitude = protective'],
['**Lead**', 'Leaded petrol, paint', 'Neurotoxic, anaemia, nephrotoxic'],
['**Benzene**', 'Petrol, solvents', 'Leukaemia (AML)'],
['**Asbestos**', 'Insulation, old buildings', 'Mesothelioma, asbestosis, lung Ca'],
['**Radon**', 'Soil/rock, building materials', 'Lung cancer (2nd commonest cause)'],
],
[18*mm, 24*mm, 32*mm], header_bg=C_RED, fontsize=6.5
))
env_right.append(sp(1))
env_right.append(sub_header('IMPORTANT POLLUTION DISASTERS', C_ORANGE))
env_right.append(sp(1))
env_right.append(make_table(
['Disaster', 'Location', 'Cause', 'Disease'],
[
['**Minamata**', 'Japan', 'Methyl mercury in fish', 'Neurological damage'],
['**Itai-itai**', 'Japan', 'Cadmium in rice/water', 'Osteoporosis, renal failure'],
['**Bhopal gas tragedy**', 'India, 1984', 'MIC (methyl isocyanate)', 'Pulmonary oedema, death'],
['**London smog**', 'UK, 1952', 'Sulphur dioxide + fog', '4000+ deaths'],
],
[22*mm, 18*mm, 26*mm, 26*mm], header_bg=C_ORANGE, fontsize=6.5
))
env_right.append(sp(1))
env_right.append(sub_header('SOLID WASTE & BIOMEDICAL WASTE', C_GREEN))
env_right.append(sp(1))
env_right.append(make_table(
['Category (BMW Rules 2016)', 'Color Bag/Container', 'Examples'],
[
['Yellow bag', '**Yellow**', 'Anatomical waste, soiled items, expired medicines'],
['Red bag', '**Red**', 'Plastic waste, IV sets, syringes (without needles)'],
['White (puncture-proof)', '**White**', 'Needles, sharps, scalpels'],
['Blue box', '**Blue**', 'Glassware, metallic implants'],
],
[38*mm, 20*mm, 38*mm], header_bg=C_GREEN, fontsize=6.5
))
lw10 = W*0.52
rw10 = W - lw10 - 2*mm
story.append(two_col(
Table([[f] for f in env_left], colWidths=[lw10]),
Table([[f] for f in env_right], colWidths=[rw10]),
lw=lw10, rw=rw10
))
story.append(PageBreak())
# ──────────────────── PAGE 11: NATIONAL HEALTH PROGRAMS ─────────────────────
story.append(section_header('🏥 PAGE 11 — NATIONAL HEALTH PROGRAMMES (INDIA)', C_NAVY))
story.append(sp(2))
story.append(sub_header('KEY NATIONAL PROGRAMS — QUICK REFERENCE', C_TEAL))
story.append(sp(1))
story.append(make_table(
['Program', 'Year Launched', 'Target', 'Key Features'],
[
['**RNTCP → NTP** (Nikshay)', '1997 → 2020', 'TB', 'DOTS strategy; Nikshay Poshan Yojana ₹500/month; End TB by 2025'],
['**NVBDCP**', '2003 (merged)', 'Vector-borne diseases', 'Malaria, Dengue, Kala-azar, JE, Filariasis, Chikungunya'],
['**NACP** (HIV/AIDS)', 'Phase 1: 1992', 'HIV/AIDS', '4th phase (NACP-IV); free ART; ICTC; blood safety'],
['**NPCDCS**', '2010', 'NCDs', 'Cancer, Diabetes, CVD, Stroke at district/sub-district level'],
['**NPCB** (Blindness)', '1976', 'Blindness', 'Cataract surgery, School eye screening, Vitamin A'],
['**NLEP**', '1983', 'Leprosy', 'MDT (Rifampicin, Dapsone, Clofazimine); elimination <1/10,000'],
['**NAMP**', '—', 'Mental health', 'District Mental Health Program (DMHP)'],
['**NPCDCS (Cancer)**', '2010', 'Cancer', 'Cervical, Breast, Oral cancer screening'],
['**NPPCF**', '2014', 'Fluorosis', 'Prevent dental/skeletal fluorosis'],
['**NPHED**', '—', 'Hearing impairment', 'Neonatal hearing screening'],
['**RASHTRIYA KISHOR SWASTHYA KARYAKRAM**', '2014', 'Adolescents 10-19yr', 'Nutrition, sexual health, mental health, substance abuse'],
['**Surakshit Matritva Aashwasan (SUMAN)**', '2019', 'Maternal/newborn', 'Free, respectful, quality care; zero tolerance for denial'],
['**PM-ABHIM**', '2021', 'Health infra', 'Strengthen public health infrastructure post-COVID'],
],
[38*mm, 18*mm, 26*mm, 73*mm],
header_bg=C_TEAL, fontsize=6.3
))
story.append(sp(2))
nhp_left = []
nhp_left.append(sub_header('AYUSHMAN BHARAT', C_NAVY))
nhp_left.append(sp(1))
nhp_left.append(make_table(
['Component', 'Details'],
[
['**Health & Wellness Centres (HWC)**', '1.5 lakh sub-centres & PHCs converted; Comprehensive Primary Health Care'],
['**PM-JAY (Pradhan Mantri Jan Arogya Yojana)**', '**₹5 lakh/family/year** health cover; 10.74 crore poor families; cashless hospitalization'],
],
[36*mm, 53*mm], header_bg=C_NAVY
))
nhp_left.append(sp(1))
nhp_left.append(sub_header('HEALTH SYSTEM STRUCTURE (Rural)', C_GREEN))
nhp_left.append(sp(1))
nhp_left.append(make_table(
['Level', 'Population Served', 'Facility'],
[
['Sub-centre (SC)', 'Plain: 5000 / Hilly: 3000', '1 ANM + 1 MPW(M)'],
['**PHC**', 'Plain: **30,000** / Hilly: 20,000', '1 MBBS doctor; 4-6 beds; 24×7 delivery'],
['**CHC**', '**1,20,000** (4 PHCs)', '30 beds; 4 specialists (surgery, medicine, OBG, paediatrics)'],
['Sub-district hospital', '5-6 lakh', 'Specialist care'],
['**District hospital**', '**10-12 lakh**', 'Full specialist care; blood bank'],
],
[26*mm, 28*mm, 56*mm], header_bg=C_GREEN
))
nhp_right = []
nhp_right.append(sub_header('MDGs → SDGs', C_PURPLE))
nhp_right.append(sp(1))
nhp_right.append(make_table(
['Goal', 'Target'],
[
['**SDG 3**', 'Good health and well-being'],
['End AIDS, TB, malaria by 2030', '—'],
['UHC (Universal Health Coverage)', 'By 2030'],
['Reduce neonatal mortality', '<12/1000 LB by 2030'],
['Reduce maternal mortality', '<70/100,000 LB by 2030'],
['End preventable deaths', '<25/1000 LB under-5 by 2030'],
],
[52*mm, 20*mm], header_bg=C_PURPLE
))
nhp_right.append(sp(1))
nhp_right.append(sub_header('NHP 2017 TARGETS (INDIA)', C_RED))
nhp_right.append(sp(1))
nhp_right.append(make_table(
['Indicator', 'Target by 2025'],
[
['**IMR**', '< 28/1000 LB → <20 by 2025'],
['**U5MR**', '< 23/1000 LB'],
['**MMR**', '< 100/1,00,000 LB'],
['**TFR**', '**2.1** (replacement level)'],
['Life expectancy at birth', '70 years'],
['Malnutrition (under-5)', 'Reduce by 40%'],
['Health expenditure (public)', 'Increase to 2.5% of GDP'],
],
[36*mm, 36*mm], header_bg=C_RED
))
lw11 = W*0.52
rw11 = W - lw11 - 2*mm
story.append(two_col(
Table([[f] for f in nhp_left], colWidths=[lw11]),
Table([[f] for f in nhp_right], colWidths=[rw11]),
lw=lw11, rw=rw11
))
story.append(PageBreak())
# ──────────────────── PAGE 12: OCCUPATIONAL HEALTH ─────────────────────────
story.append(section_header('🏭 PAGE 12 — OCCUPATIONAL HEALTH & NON-COMMUNICABLE DISEASES', C_NAVY))
story.append(sp(2))
occ_left = []
occ_left.append(sub_header('OCCUPATIONAL DISEASES (EXPOSURE → DISEASE)', C_RED))
occ_left.append(sp(1))
occ_left.append(make_table(
['Exposure / Occupation', 'Disease'],
[
['**Coal dust** (miners)', '**Coal workers\' pneumoconiosis (CWP)**; Anthracosis'],
['**Silica** (quarry, sand-blasting)', '**Silicosis** (most dangerous pneumoconiosis); ↑TB risk'],
['**Asbestos** (insulation, ship-building)', '**Asbestosis**, Mesothelioma (pleural), Lung Ca'],
['**Cotton dust** (textile)', '**Byssinosis** (Monday fever); progressive dyspnoea'],
['**Bagasse** (sugar cane)', '**Bagassosis** (extrinsic allergic alveolitis)'],
['**Bird droppings** / Farmer\'s lung', '**Extrinsic allergic alveolitis (EAA)**'],
['**Lead** (paint, battery, printing)', 'Lead poisoning: Burton\'s line, anaemia, basophilic stippling, colic, foot drop'],
['**Mercury** (thermometers, gold mining)', 'Minamata disease; tremor, gingivitis, erethism'],
['**Arsenic** (pesticides, smelting)', 'Mees\' lines, rain-drop pigmentation, Bowen\'s disease, skin/lung Ca'],
['**Benzene** (solvents, petrol)', 'AML (leukaemia), aplastic anaemia'],
['**Vinyl chloride**', 'Hepatic angiosarcoma'],
['**Vibration** (chain saw)', 'Raynaud\'s phenomenon, white finger'],
['**Noise > 85 dB** (8hrs)', 'NIHL (noise-induced hearing loss); 4000 Hz first affected'],
['**UV radiation** (welders)', 'Arc eye (photokeratitis), skin cancer (SCC, BCC, melanoma)'],
['**Radiation** (X-ray workers)', 'Aplastic anaemia, leukaemia, cataracts, thyroid Ca'],
],
[40*mm, 62*mm], header_bg=C_RED, fontsize=6.3
))
occ_right = []
occ_right.append(sub_header('NON-COMMUNICABLE DISEASES (NCDs)', C_TEAL))
occ_right.append(sp(1))
occ_right.append(make_table(
['Disease', 'Key Risk Factor', 'FMGE Point'],
[
['**CHD**', 'Smoking, HTN, DM, dyslipidaemia', 'Framingham score; Metabolic syndrome (NCEP-ATP III)'],
['**Hypertension**', 'Obesity, salt, alcohol, sedentary', 'JNC 8: ≥140/90; Stage 1: 130-139/80-89 (AHA 2017)'],
['**DM Type 2**', 'Obesity, sedentary, family history', 'FPG ≥126; 2-hr PG ≥200; HbA1c ≥6.5%'],
['**Cancer (lung)**', 'Smoking (80%), radon', '2nd most common cancer worldwide'],
['**Cancer (cervix)**', '**HPV (16, 18)**', 'Most common Ca in developing countries (India)'],
['**Cancer (breast)**', 'BRCA1/2, obesity, HRT', 'Most common Ca in women worldwide'],
['**COPD**', 'Smoking, biomass fuel', 'FEV1/FVC < 0.70 post-bronchodilator'],
['**Stroke**', 'HTN, AF, diabetes', 'FAST: Face, Arm, Speech, Time'],
],
[20*mm, 26*mm, 54*mm], header_bg=C_TEAL, fontsize=6.5
))
occ_right.append(sp(1))
occ_right.append(sub_header('METABOLIC SYNDROME (NCEP-ATP III)', C_ORANGE))
occ_right.append(sp(1))
occ_right.append(make_table(
['Criterion', 'Value'],
[
['Waist circumference', 'Men >102 cm; Women >88 cm (Asian: men >90, women >80)'],
['Triglycerides', '≥150 mg/dL'],
['HDL cholesterol', 'Men <40 mg/dL; Women <50 mg/dL'],
['Blood pressure', '≥130/85 mmHg'],
['Fasting glucose', '≥100 mg/dL'],
['**Diagnosis: ≥3 of above criteria**', '—'],
],
[36*mm, 52*mm], header_bg=C_ORANGE
))
lw12 = W*0.51
rw12 = W - lw12 - 2*mm
story.append(two_col(
Table([[f] for f in occ_left], colWidths=[lw12]),
Table([[f] for f in occ_right], colWidths=[rw12]),
lw=lw12, rw=rw12
))
story.append(PageBreak())
# ──────────────────── PAGE 13: MALARIA, TB, LEPROSY ─────────────────────────
story.append(section_header("🦠 PAGE 13 — MALARIA, TB & LEPROSY (HIGH-YIELD DISEASES)", C_NAVY))
story.append(sp(2))
mal_left = []
mal_left.append(sub_header('MALARIA', C_RED))
mal_left.append(sp(1))
mal_left.append(make_table(
['Feature', 'P. vivax / P. ovale', 'P. falciparum'],
[
['Incubation', '12-17 days', '7-14 days'],
['Fever cycle', '**48 hr (Benign tertian)**', '**36-48 hr (Malignant tertian)**'],
['Relapse', '**Yes** (hypnozoites in liver)', 'No relapse (recrudescence only)'],
['Dangerous', 'No', '**Yes** — Cerebral malaria, severe anaemia'],
['RBC affected', 'Young RBCs', 'All RBCs'],
['Schuffner\'s dots', 'Present', 'Absent (Maurer\'s clefts)'],
['Anti-relapse Rx', 'Primaquine 14 days', 'Not needed'],
],
[26*mm, 36*mm, 36*mm], header_bg=C_RED
))
mal_left.append(sp(1))
mal_left.append(make_table(
['Treatment', 'Drug'],
[
['**P. vivax**', 'Chloroquine 3 days + Primaquine 14 days'],
['**P. falciparum**', 'ACT (Artemether-Lumefantrine) 3 days + Primaquine single dose'],
['**Severe malaria**', 'IV Artesunate (replaces quinine)'],
['**Prevention**', 'LLIN (Long-lasting insecticidal nets), IRS (DDT/Deltamethrin)'],
],
[22*mm, 76*mm], header_bg=C_RED
))
mal_left.append(sp(1))
mal_left.append(sub_header('TB (RNTCP/NTP)', C_TEAL))
mal_left.append(sp(1))
mal_left.append(make_table(
['Category', 'Regimen (old DOTS)', 'Notes'],
[
['**New cases**', '2HRZE / 4HR', 'H=INH, R=Rifampicin, Z=Pyrazinamide, E=Ethambutol'],
['**Previously treated**', '2HRZES/1HRZE/5HRE', 'Category II (being phased out for DST-guided)'],
['**DR-TB (MDR)**', 'Bedaquiline + Linezolid-based regimen', 'Resist INH + Rifampicin; culture confirmation'],
['**XDR-TB**', 'Resistant to INH, Rif + FQ + injectable', 'Newer drugs: Bedaquiline, Delamanid'],
['**Latent TB**', '6H or 3HP (isoniazid + rifapentine)', 'IGRA or TST positive; no active disease'],
],
[20*mm, 38*mm, 40*mm], header_bg=C_TEAL, fontsize=6.3
))
mal_right = []
mal_right.append(sub_header('LEPROSY', C_PURPLE))
mal_right.append(sp(1))
mal_right.append(make_table(
['Feature', 'Tuberculoid (TT)', 'Lepromatous (LL)'],
[
['Immunity', 'High cell-mediated', 'Low/absent CMI'],
['Lesions', 'Few (1-5), well-defined', 'Many, ill-defined, symmetrical'],
['Sensation', '**Absent** in lesion', 'Reduced but not absent early'],
['Bacteria', '**Very few** (PB)', '**Many** (MB); Globi present'],
['Lepromin test', '**Positive**', '**Negative**'],
['Nerve damage', 'Early, one nerve', 'Late, multiple nerves'],
['Transmissibility', 'Low', 'High'],
],
[20*mm, 38*mm, 40*mm], header_bg=C_PURPLE
))
mal_right.append(sp(1))
mal_right.append(make_table(
['Classification', 'Criteria', 'MDT Regimen'],
[
['**PB (Paucibacillary)**', '1-5 patches, skin smear −ve', '**6 months**: Rifampicin 600mg monthly + Dapsone 100mg daily'],
['**MB (Multibacillary)**', '>5 patches, smear +ve or borderline', '**12 months**: Rifampicin + Dapsone + Clofazimine'],
['**Single lesion PB**', '1 patch, no nerve', 'ROM (single dose: Rifampicin + Ofloxacin + Minocycline)'],
],
[18*mm, 30*mm, 52*mm], header_bg=C_PURPLE, fontsize=6.3
))
mal_right.append(sp(1))
mal_right.append(sub_header('LEPROSY REACTIONS', C_ORANGE))
mal_right.append(sp(1))
mal_right.append(make_table(
['Reaction', 'Type', 'Treatment'],
[
['**Type 1 (Reversal)**', 'Occurs in BT, BB, BL; Delayed hypersensitivity', 'Prednisolone 40-60mg/day'],
['**Type 2 (ENL)**', 'Occurs in BL, LL; Immune complex (Type III)', 'Thalidomide (drug of choice) or steroids'],
['**Lucio phenomenon**', 'Only in LL; vasculitis with skin ulceration', 'Continue MDT'],
],
[22*mm, 36*mm, 40*mm], header_bg=C_ORANGE, fontsize=6.3
))
lw13 = W*0.5
rw13 = W - lw13 - 2*mm
story.append(two_col(
Table([[f] for f in mal_left], colWidths=[lw13]),
Table([[f] for f in mal_right], colWidths=[rw13]),
lw=lw13, rw=rw13
))
story.append(PageBreak())
# ──────────────────── PAGE 14: HEALTH INDICATORS & CONCEPTS ─────────────────
story.append(section_header('📋 PAGE 14 — HEALTH INDICATORS, CONCEPTS & DEFINITIONS', C_NAVY))
story.append(sp(2))
ind_left = []
ind_left.append(sub_header('WHO DEFINITION & DIMENSIONS OF HEALTH', C_TEAL))
ind_left.append(sp(1))
ind_left.append(Paragraph('<b>WHO 1948:</b> "Health is a state of complete physical, mental and social well-being and not merely the absence of disease or infirmity"', BODYSM))
ind_left.append(sp(1))
ind_left.append(make_table(
['Dimension', 'Components'],
[
['**Physical**', 'Normal physiological function; no disease'],
['**Mental**', 'Absence of mental illness; emotional well-being'],
['**Social**', 'Ability to function in society; relationships'],
['**Spiritual**', 'Sense of purpose, meaning, values'],
['**Vocational**', 'Ability to perform productive work'],
],
[22*mm, 66*mm], header_bg=C_TEAL
))
ind_left.append(sp(1))
ind_left.append(sub_header('COMPOSITE HEALTH INDICATORS', C_NAVY))
ind_left.append(sp(1))
ind_left.append(make_table(
['Indicator', 'Definition'],
[
['**HALE**', 'Health-Adjusted Life Expectancy; years in full health'],
['**DALY**', 'Disability-Adjusted Life Year = YLL + YLD; measures disease burden'],
['**YLL**', 'Years of Life Lost due to premature death'],
['**YLD**', 'Years Lived with Disability (weighted)'],
['**QALY**', 'Quality-Adjusted Life Year; used in cost-effectiveness'],
['**HDI**', 'Human Development Index: Life expectancy + Education + Income'],
['**PQLI**', 'Physical Quality of Life Index: Infant literacy + Life expectancy at age 1 + IMR'],
],
[16*mm, 76*mm], header_bg=C_NAVY
))
ind_left.append(sp(1))
ind_left.append(sub_header('PRIMARY HEALTH CARE (Alma-Ata 1978)', C_GREEN))
ind_left.append(sp(1))
ind_left.append(Paragraph('<b>Declaration of Alma-Ata 1978</b> — "Health For All by 2000 AD" (goal unmet → renewed as HFA in SDGs 2030)', BODYSM))
ind_left.append(sp(1))
ind_left.append(make_table(
['Element (SAFE WMEN)', 'Full Form'],
[
['S', 'Safe water & sanitation'],
['A', 'Adequate nutrition'],
['F', 'Immunization (Fundamental prevention)'],
['E', 'Essential drugs provision'],
['W', 'Women & child health, family planning'],
['M', 'Maternal health'],
['E', 'Endemic disease control'],
['N', 'Non-communicable disease treatment'],
],
[10*mm, 82*mm], header_bg=C_GREEN
))
ind_right = []
ind_right.append(sub_header('IMPORTANT DEFINITIONS', C_PURPLE))
ind_right.append(sp(1))
ind_right.append(make_table(
['Term', 'Definition'],
[
['**Epidemic**', 'Occurrence clearly in excess of normal expectancy in area/period'],
['**Endemic**', 'Constant presence of disease in a given geographic area'],
['**Pandemic**', 'Worldwide epidemic'],
['**Sporadic**', 'Irregular occurrence, not constant'],
['**Hyperendemic**', 'Consistently high levels, evenly distributed across age groups'],
['**Holoendemic**', 'Very high in children; lower in adults due to acquired immunity (e.g., malaria)'],
['**Eradication**', 'Permanent reduction to zero worldwide (e.g., Smallpox 1980)'],
['**Elimination**', 'Reduction to zero in specific geographic area (not globally)'],
['**Control**', 'Reduction of disease to acceptable level; ongoing control needed'],
['**Herd immunity**', 'Indirect protection of susceptibles when large proportion immune'],
['**Surveillance**', 'Ongoing systematic collection, analysis & use of health data'],
['**Quarantine**', 'Restriction of movement of exposed (well) persons for max incubation period'],
['**Isolation**', 'Separation of **infected/ill** persons from others'],
['**Case finding**', 'Active search for cases among known at-risk groups'],
['**Screening**', 'Presumptive identification of unrecognized disease in apparently healthy'],
['**Sentinel surveillance**', 'Selected sites for monitoring trends (not representative)'],
],
[28*mm, 80*mm], header_bg=C_PURPLE, fontsize=6.3
))
ind_right.append(sp(1))
ind_right.append(highlight_box('SMALLPOX eradicated 1980 | POLIO: India polio-free since 2014 | GUINEA WORM: Near eradication | LEPROSY: Eliminated in India (<1/10,000) 2005', C_LYELLOW, C_GREEN))
lw14 = W*0.47
rw14 = W - lw14 - 2*mm
story.append(two_col(
Table([[f] for f in ind_left], colWidths=[lw14]),
Table([[f] for f in ind_right], colWidths=[rw14]),
lw=lw14, rw=rw14
))
story.append(PageBreak())
# ──────────────────── PAGE 15: RAPID FIRE ONE-LINERS ────────────────────────
story.append(section_header('⚡ PAGE 15 — RAPID FIRE ONE-LINERS & EXAM DAY QUICK RECALL', C_NAVY))
story.append(sp(2))
# Two columns of one-liners
rf_data_l = [
['**Best indicator of community health**', '→ IMR'],
['**Best indicator of nutritional status**', '→ Weight for age (Wt/Age)'],
['**Gold standard study design**', '→ RCT (Double-blind RCT)'],
['**Best for rare disease study**', '→ Case-control study'],
['**Incidence measured by**', '→ Cohort study'],
['**Prevalence = Incidence ×**', '→ Duration of disease'],
['**OR ≈ RR when**', '→ Disease prevalence < 10%'],
['**SnNout**', '→ High Sensitivity → Negative rules OUT'],
['**SpPin**', '→ High Specificity → Positive rules IN'],
['**Screening needs high**', '→ Sensitivity'],
['**Confirmatory test needs high**', '→ Specificity'],
['**PPV/NPV depend on**', '→ Prevalence'],
['**Type I error (α)**', '→ False positive; α = 0.05'],
['**Type II error (β)**', '→ False negative; β = 0.20'],
['**Power of study**', '→ 1 − β = 0.80 (80%)'],
['**p < 0.05 means**', '→ Statistically significant'],
['**95% CI excludes 1 (RR/OR)**', '→ Significant association'],
['**Mean ± 1.96 SD covers**', '→ 95% of population'],
['**Mean = Median = Mode**', '→ Normal distribution'],
['**Most important Hill\'s criterion**', '→ Temporality'],
['**Best to control confounding**', '→ Randomization (in RCT)'],
['**Recall bias occurs in**', '→ Case-control studies'],
['**Lead time bias occurs in**', '→ Screening studies (false prolonged survival)'],
['**Berkson\'s bias**', '→ Hospital-based case-control studies'],
['**Ecological fallacy**', '→ Ecological/correlation studies'],
]
rf_data_r = [
['**IMR denominator**', '→ LIVE births (not total births)'],
['**MMR denominator**', '→ Live births (per 1,00,000)'],
['**Perinatal MR denominator**', '→ Stillbirths + Live births'],
['**Best single indicator of childbirth services**', '→ MMR'],
['**Herd immunity threshold for measles**', '→ ~95%'],
['**R₀ highest**', '→ Measles (12-18)'],
['**VAPP caused by**', '→ OPV (not IPV)'],
['**BCG route**', '→ Intradermal (left deltoid)'],
['**MR vaccine age**', '→ 9-12 months + 16-24 months'],
['**DPT booster-2 age**', '→ 5-6 years'],
['**Optimal fluoride in water**', '→ 0.5-0.8 ppm; India standard = 1 ppm'],
['**Residual chlorine at consumer end**', '→ 0.5 ppm'],
['**Slow sand filter removes**', '→ 99% bacteria (Schmutzdecke)'],
['**Rapid sand filter**', '→ Requires coagulation; does NOT remove bacteria alone'],
['**Minamata disease**', '→ Methyl mercury poisoning'],
['**Itai-itai disease**', '→ Cadmium poisoning'],
['**Bhopal tragedy gas**', '→ MIC (Methyl isocyanate)'],
['**Silicosis risk**', '→ ↑ susceptibility to TB'],
['**Noise: frequency first affected**', '→ 4000 Hz (NIHL)'],
['**Mesothelioma caused by**', '→ Asbestos'],
['**Leukaemia (AML) caused by**', '→ Benzene'],
['**Kwashiorkor has**', '→ Oedema, fatty liver, flaky paint rash'],
['**Marasmus has**', '→ No oedema, wasted, hungry'],
['**Pellagra: 4 Ds**', '→ Dermatitis, Diarrhoea, Dementia, Death'],
['**HPV types causing cervical Ca**', '→ 16 & 18'],
]
def rf_table(data, bg):
rows = [[Paragraph(a, ParagraphStyle('rfa', fontName='Helvetica-Bold', fontSize=6.3, leading=8, textColor=C_BLACK)),
Paragraph(b, ParagraphStyle('rfb', fontName='Helvetica', fontSize=6.3, leading=8, textColor=C_BLACK))]
for a, b in [(d[0], d[1]) for d in data]]
t = Table(rows, colWidths=[50*mm, 34*mm])
style_list = [
('ROWBACKGROUNDS', (0,0), (-1,-1), [C_WHITE, C_LGREY]),
('GRID', (0,0), (-1,-1), 0.2, colors.HexColor('#DDDDDD')),
('TOPPADDING', (0,0), (-1,-1), 1),
('BOTTOMPADDING', (0,0), (-1,-1), 1),
('LEFTPADDING', (0,0), (-1,-1), 3),
('RIGHTPADDING', (0,0), (-1,-1), 3),
('VALIGN', (0,0), (-1,-1), 'TOP'),
]
t.setStyle(TableStyle(style_list))
return t
lw15 = W*0.5 - 2*mm
rw15 = W - lw15 - 2*mm
left_block = []
left_block.append(sub_header('EPIDEMIOLOGY & BIOSTATISTICS', C_TEAL))
left_block.append(sp(1))
left_block.append(rf_table(rf_data_l, C_TEAL))
right_block = []
right_block.append(sub_header('DISEASE CONTROL, NUTRITION & ENVIRONMENT', C_RED))
right_block.append(sp(1))
right_block.append(rf_table(rf_data_r, C_RED))
story.append(two_col(
Table([[f] for f in left_block], colWidths=[lw15]),
Table([[f] for f in right_block], colWidths=[rw15]),
lw=lw15, rw=rw15
))
story.append(sp(3))
# Footer banner
footer = Table([[
Paragraph('Park\'s Textbook of Preventive & Social Medicine | FMGE Community Medicine Cheat Sheet | All rights reserved | For examination revision only',
ParagraphStyle('foot', fontName='Helvetica-Oblique', fontSize=6, textColor=C_WHITE, alignment=TA_CENTER)),
]], colWidths=[W])
footer.setStyle(TableStyle([
('BACKGROUND', (0,0), (-1,-1), C_NAVY),
('TOPPADDING', (0,0), (-1,-1), 3),
('BOTTOMPADDING', (0,0), (-1,-1), 3),
]))
story.append(footer)
# ── Build ──────────────────────────────────────────────────────────────────────
doc.build(story)
print("PDF generated successfully!")
Running Command
cd /home/daytona/workspace/fmge-cheatsheet && python generate_cheatsheet.py 2>&1
Running Command
ls -lh /home/daytona/workspace/fmge-cheatsheet/FMGE_Community_Medicine_Cheatsheet.pdf && python3 -c "from pypdf import PdfReader; r=PdfReader('/home/daytona/workspace/fmge-cheatsheet/FMGE_Community_Medicine_Cheatsheet.pdf'); print(f'Pages: {len(r.pages)}')"
Your 15-page FMGE Community Medicine Cheat Sheet is ready!
FMGE Community Medicine Cheatsheet
PDF Document · PDF
Here's what's packed into each page:
| Page | Topic |
|---|---|
| 1 | Epidemiology - Study designs, 2×2 table, OR/RR/AR formulas, Type I & II errors |
| 2 | Biostatistics - Statistical tests (parametric vs non-parametric), Normal distribution, Sampling methods, Central tendency & dispersion |
| 3 | Screening - Sensitivity/Specificity, SnNout/SpPin, Validity vs Reliability, Bias types, Wilson & Jungner criteria |
| 4 | Mortality & Morbidity rates - All formulas with denominators, IMR, MMR, Perinatal MR, Fertility rates |
| 5 | Disease causation - Levels of prevention, Natural history, Bradford Hill's 9 criteria, Epidemiological triangle, Modes of transmission, Herd immunity thresholds |
| 6 | Immunization - Complete UIP schedule, cold chain temperatures, Vaccine types (live/killed/toxoid/recombinant) |
| 7 | Communicable diseases - Incubation periods (20 diseases), Vectors & diseases, R₀ values, IHR notifiable diseases |
| 8 | Nutrition - Kwashiorkor vs Marasmus, Anthropometric indices, Micronutrient deficiency diseases |
| 9 | Maternal & Child Health - ANC contacts, danger signs in pregnancy, Breastfeeding, Family planning methods (Pearl Index), Growth milestones |
| 10 | Environment - Water quality standards, Purification methods, Air pollutants, Pollution disasters, Biomedical waste colors |
| 11 | National Health Programs - UIP, RNTCP, NACP, NVBDCP, NPCDCS, Ayushman Bharat, PHC/CHC structure, NHP 2017 targets |
| 12 | Occupational health - 15 occupational disease pairs, NCDs (CHD, HTN, DM, Cancer), Metabolic syndrome criteria |
| 13 | Malaria, TB & Leprosy - P.vivax vs P.falciparum, ACT regimen, DOTS regimen, MDT, Leprosy reactions |
| 14 | Health indicators - WHO definition, DALY/HALE/QALY/PQLI, Primary Health Care (Alma-Ata 8 elements), 16 key definitions |
| 15 | Rapid-fire one-liners - 50 exam-day quick recall facts covering all topics |
This is a shared conversation. Sign in to Orris to start your own chat.