
Cardiac output explanations with flowcharts and diagrams
Reading File
Now let me search the medical library for cardiac output content in parallel:
Finding Sources
Finding Sources
Reading File
Finding Sources
Finding Sources
Reading File
Finding Sources
Reading File
Finding Sources
Reading File
Loading Image
Loading Image
Now let me get more diagrams and information on the Fick principle, cardiac index, and factors affecting CO:
Finding Sources
Finding Sources
Reading File
Reading File
Loading Image
Loading Image
Now let me get the Frank-Starling curve image from the Miller's Anesthesia section:
Reading File
Loading Image
Reading File
Loading Image
Loading Image
Loading Image
I now have all the content and diagrams needed. Let me compile the comprehensive response:
Cardiac Output - Complete Guide with Diagrams
1. Definition and Core Formula
Cardiac output (CO) is the total volume of blood ejected by the left ventricle per minute.
CO = Stroke Volume (SV) × Heart Rate (HR)
| Parameter | Definition | Normal Value |
|---|---|---|
| Cardiac Output | Volume ejected per minute | ~5,000 mL/min (5 L/min) |
| Stroke Volume | Volume ejected per single beat | ~70 mL |
| Heart Rate | Beats per minute | ~72 bpm |
| Ejection Fraction | SV ÷ End-diastolic volume | ~50-65% |
Sample calculation (from Costanzo Physiology):
- EDV = 140 mL, ESV = 70 mL, HR = 75 bpm
- SV = EDV - ESV = 140 - 70 = 70 mL
- CO = 70 mL × 75 bpm = 5,250 mL/min
- EF = 70/140 = 0.50 (50%)
2. Master Flowchart of Cardiac Output Regulation
                    CARDIAC OUTPUT
                   CO = SV × HR
                  /              \
         STROKE VOLUME          HEART RATE
        /      |      \         /        \
   Preload  Afterload Contractility  Sympathetic  Parasympathetic
      ↑         ↓         ↑           ↑ HR           ↓ HR
   (EDV)    (SVR/BP)  (Inotropy)   (↑ inotropy)   (vagal tone)
3. Cardiac Index
The cardiac index normalizes CO for body surface area:
Cardiac Index = CO ÷ Body Surface Area (BSA)
- Normal adult: ~3.0 L/min/m² (for 70 kg, 1.7 m² BSA)
- Peaks at age 10: >4 L/min/m²
- Declines to ~2.4 L/min/m² by age 80
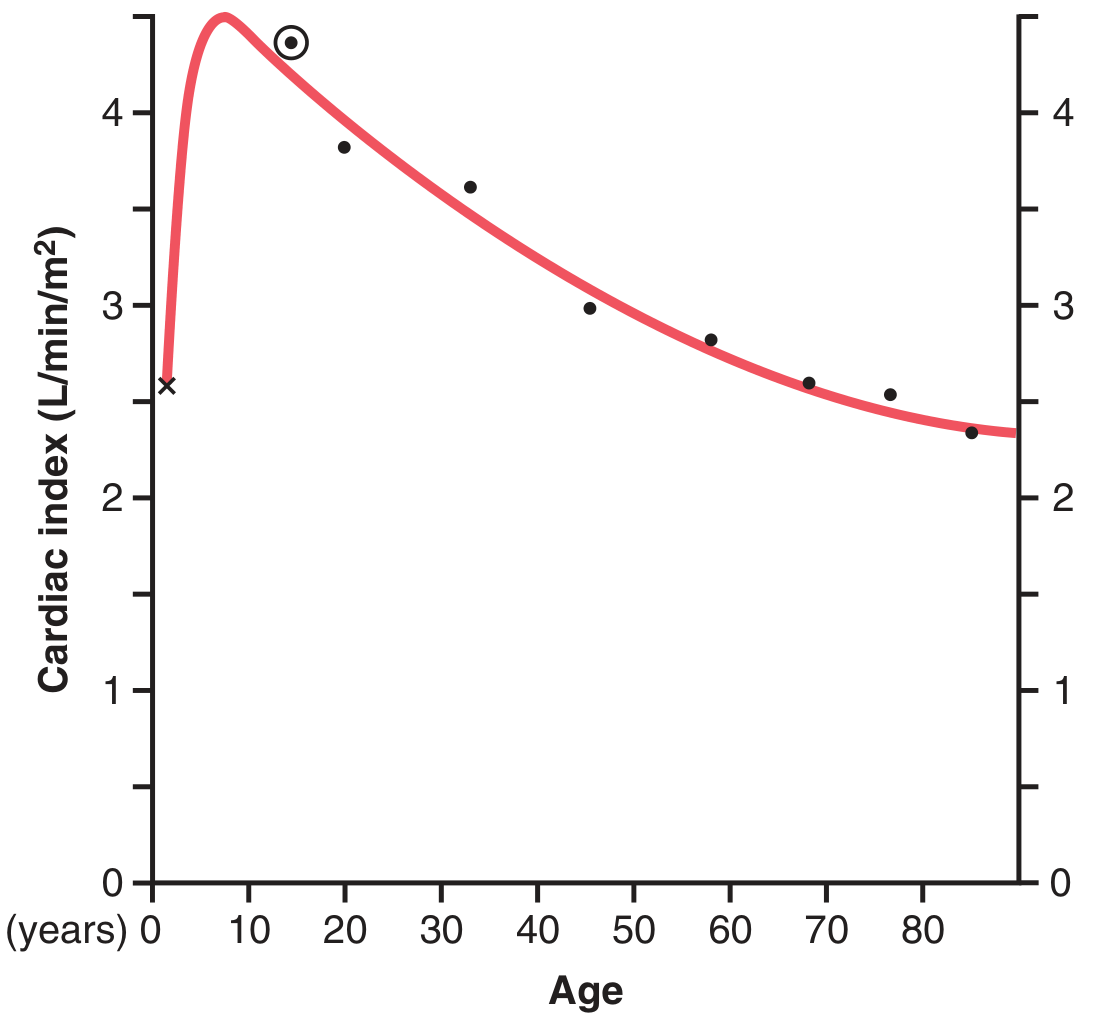
Fig. 20.1 - Guyton & Hall: Cardiac index across the lifespan
4. The Three Determinants of Stroke Volume
A. Preload
- Defined as the ventricular load at end-diastole, before contraction begins
- Clinically estimated by: PCWP (pulmonary capillary wedge pressure), CVP, or echocardiographic EDV
- Greater preload → greater stretch → greater SV (Frank-Starling law)
B. Afterload
- Defined as the systolic load after contraction begins
- Clinically approximated by systolic blood pressure (when aortic stenosis is absent)
- Governed by Laplace's Law:
Wall Stress (σ) = P × R / (2 × h)
- P = pressure, R = radius, h = wall thickness
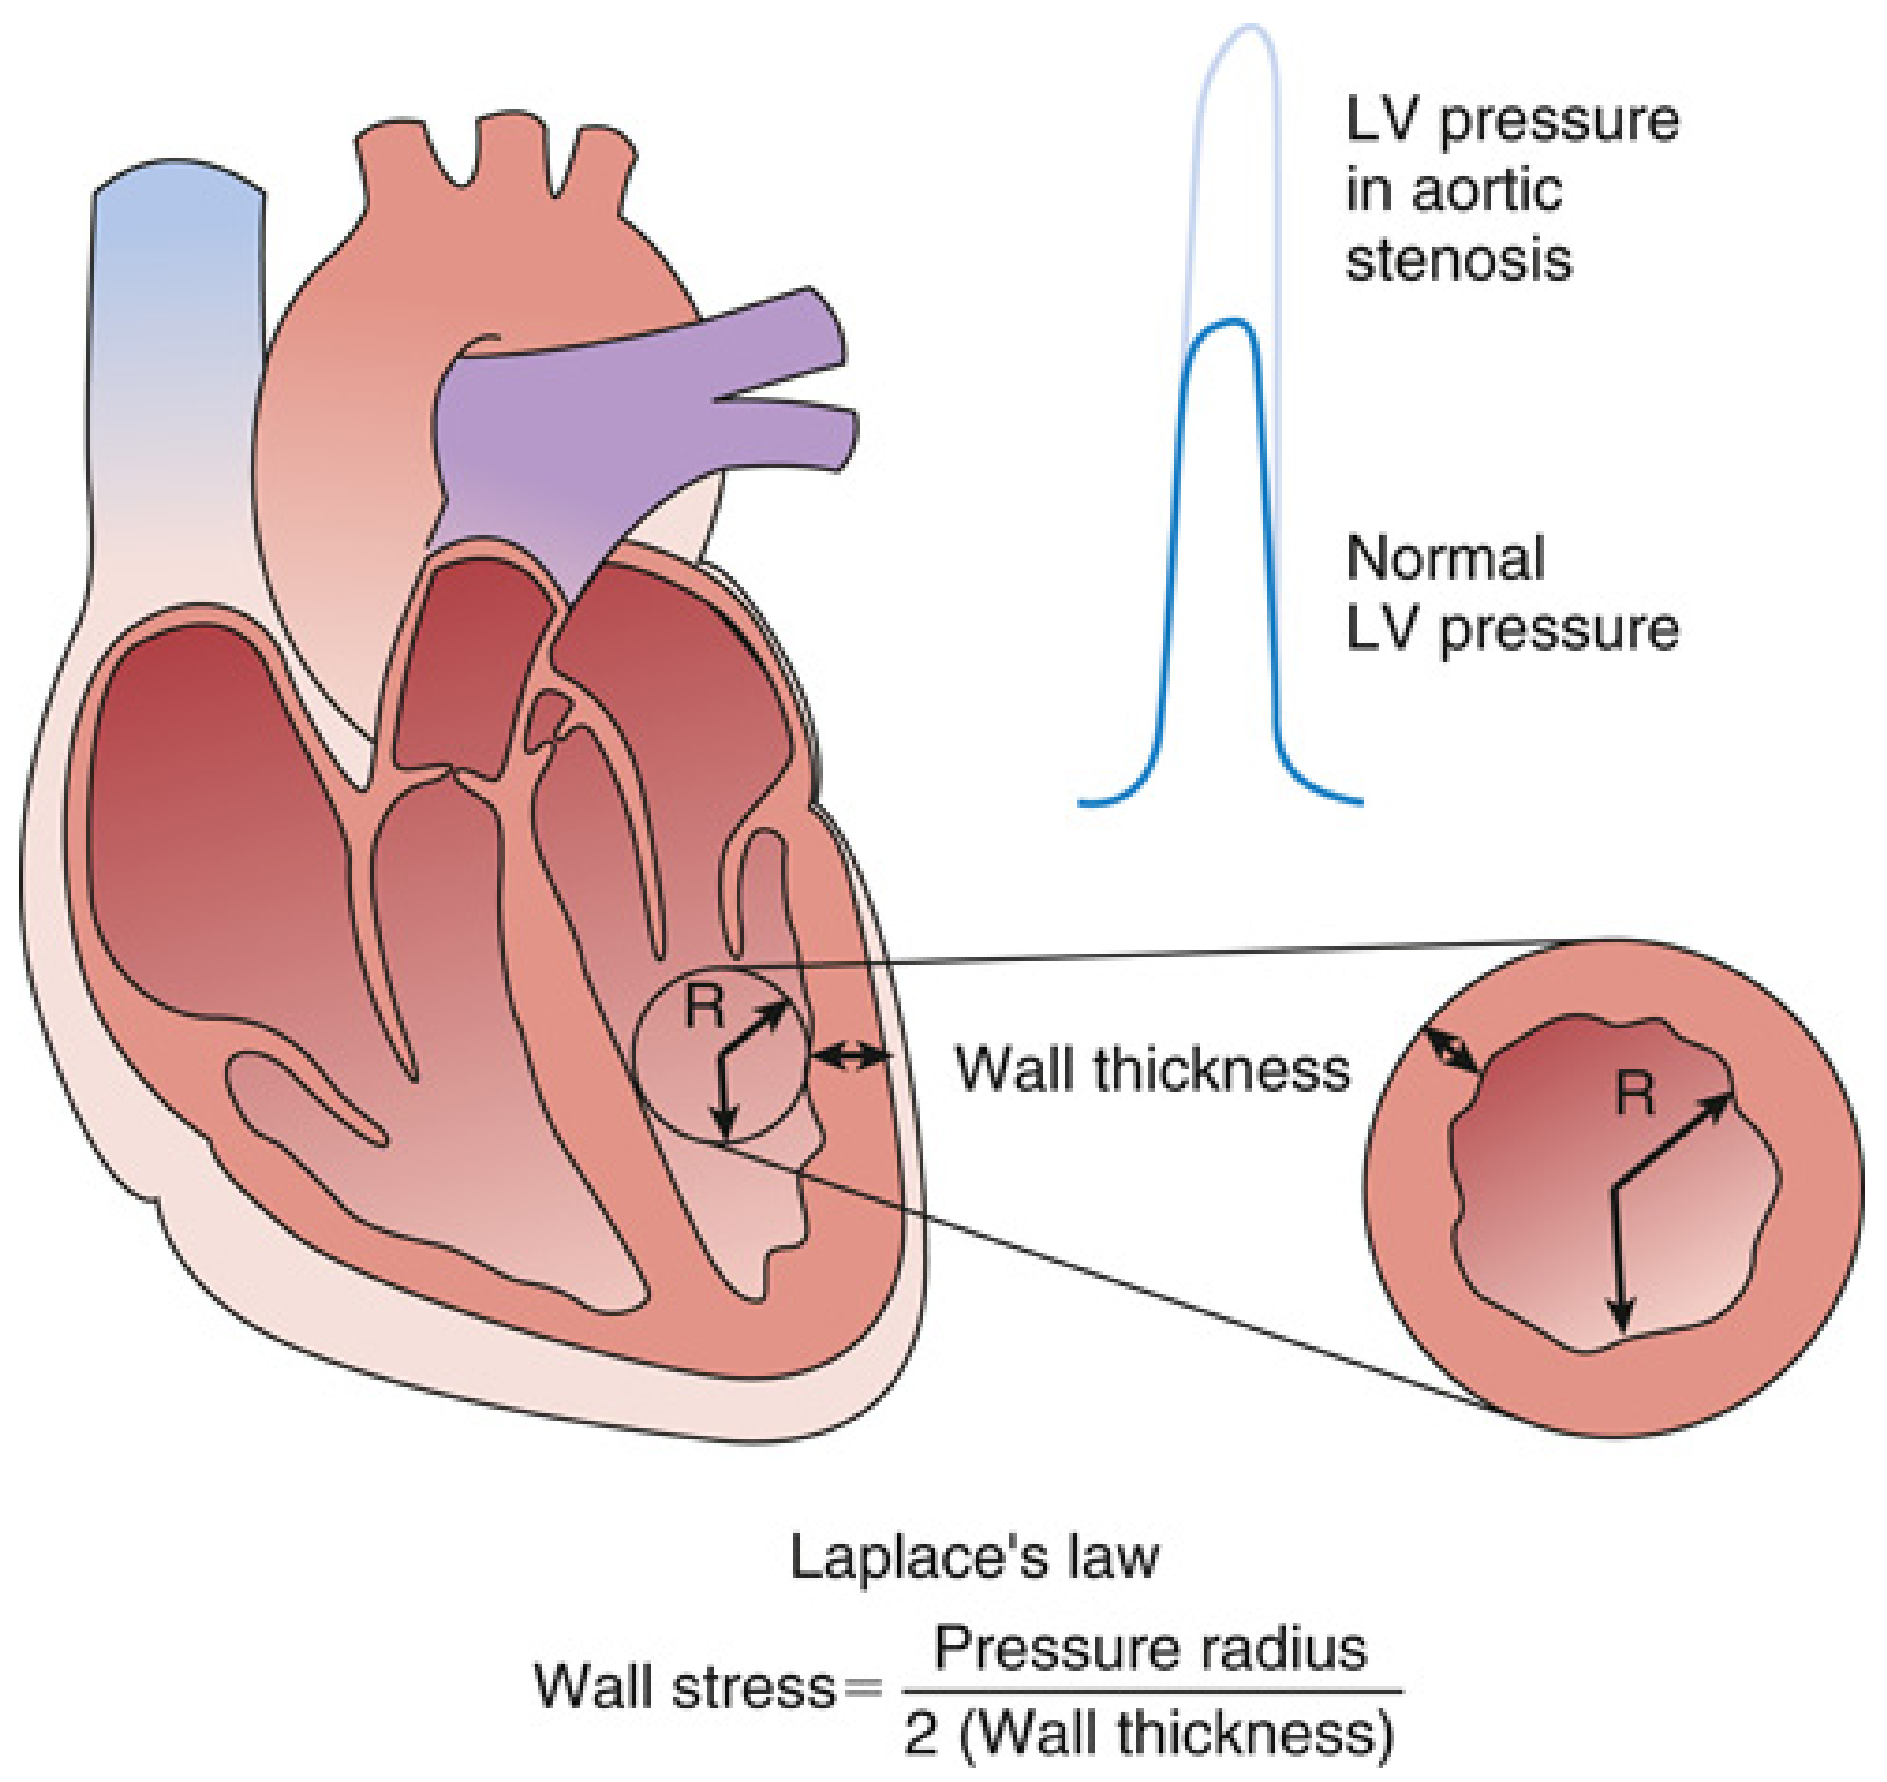
Fig. 13.3 - Miller's Anesthesia: Laplace's Law and LV wall stress. In aortic stenosis, compensatory LV hypertrophy (↑h) normalizes wall stress despite higher pressure.
C. Contractility (Inotropy)
- The intrinsic ability of the heart to generate force at a given end-diastolic volume
- Increased by: sympathetic stimulation, catecholamines, milrinone, digoxin, exercise, ↑Ca²⁺
- Decreased by: heart failure, ↓pH, hypothermia, beta-blockers, myocardial ischemia
5. Frank-Starling Mechanism
The Frank-Starling law states: the greater the end-diastolic volume (stretch), the greater the stroke volume and cardiac output - up to an optimal sarcomere length.
Molecular basis: Longer sarcomere length (2.0-2.2 μm) → optimal actin-myosin overlap → increased cross-bridge cycling and increased Ca²⁺ sensitivity of myofilaments.
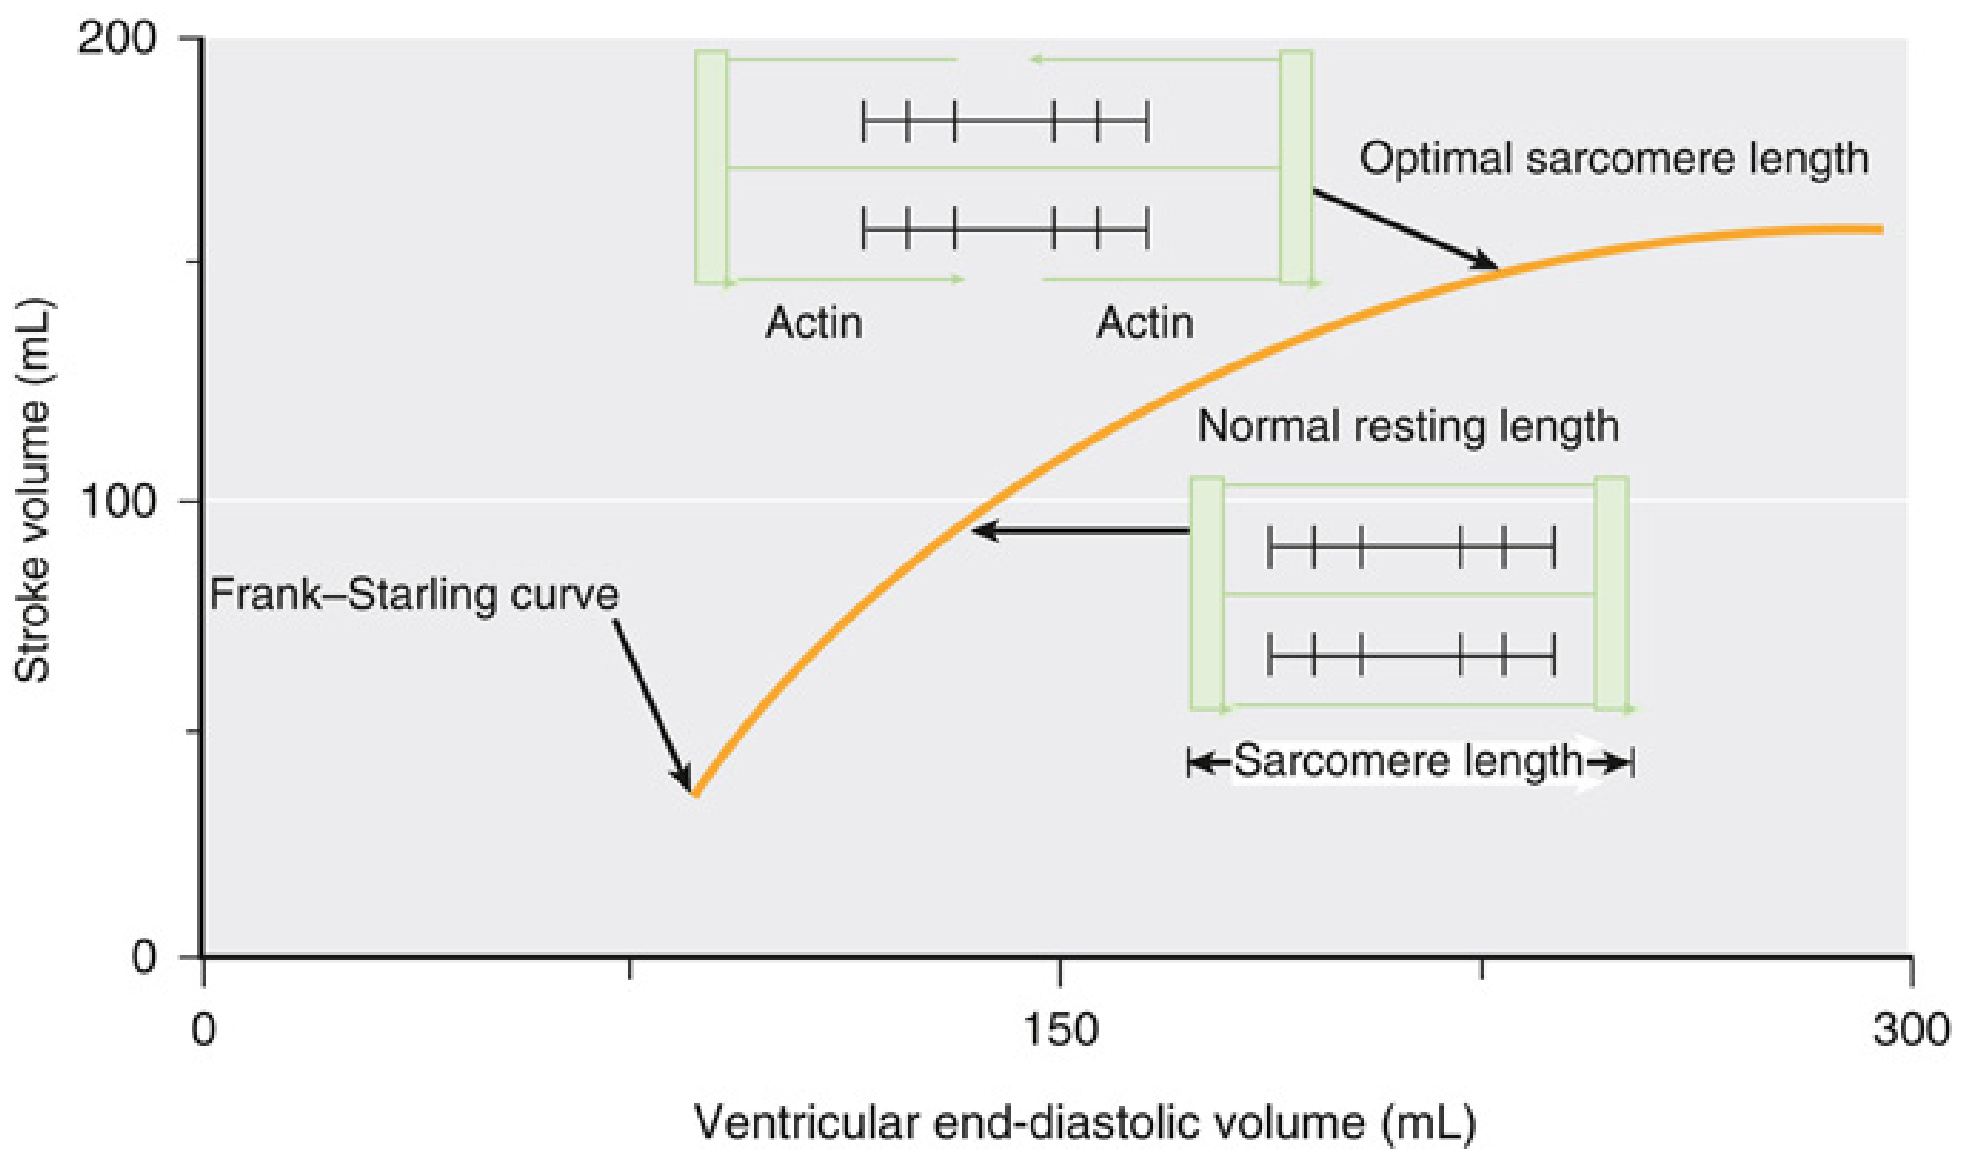
Fig. 13.4 - Miller's Anesthesia: Frank-Starling curve. As EDV rises, stroke volume increases. Insets show sarcomere length and actin-myosin overlap at different points.
Family of Frank-Starling Curves
Contractility shifts the entire curve up or down:
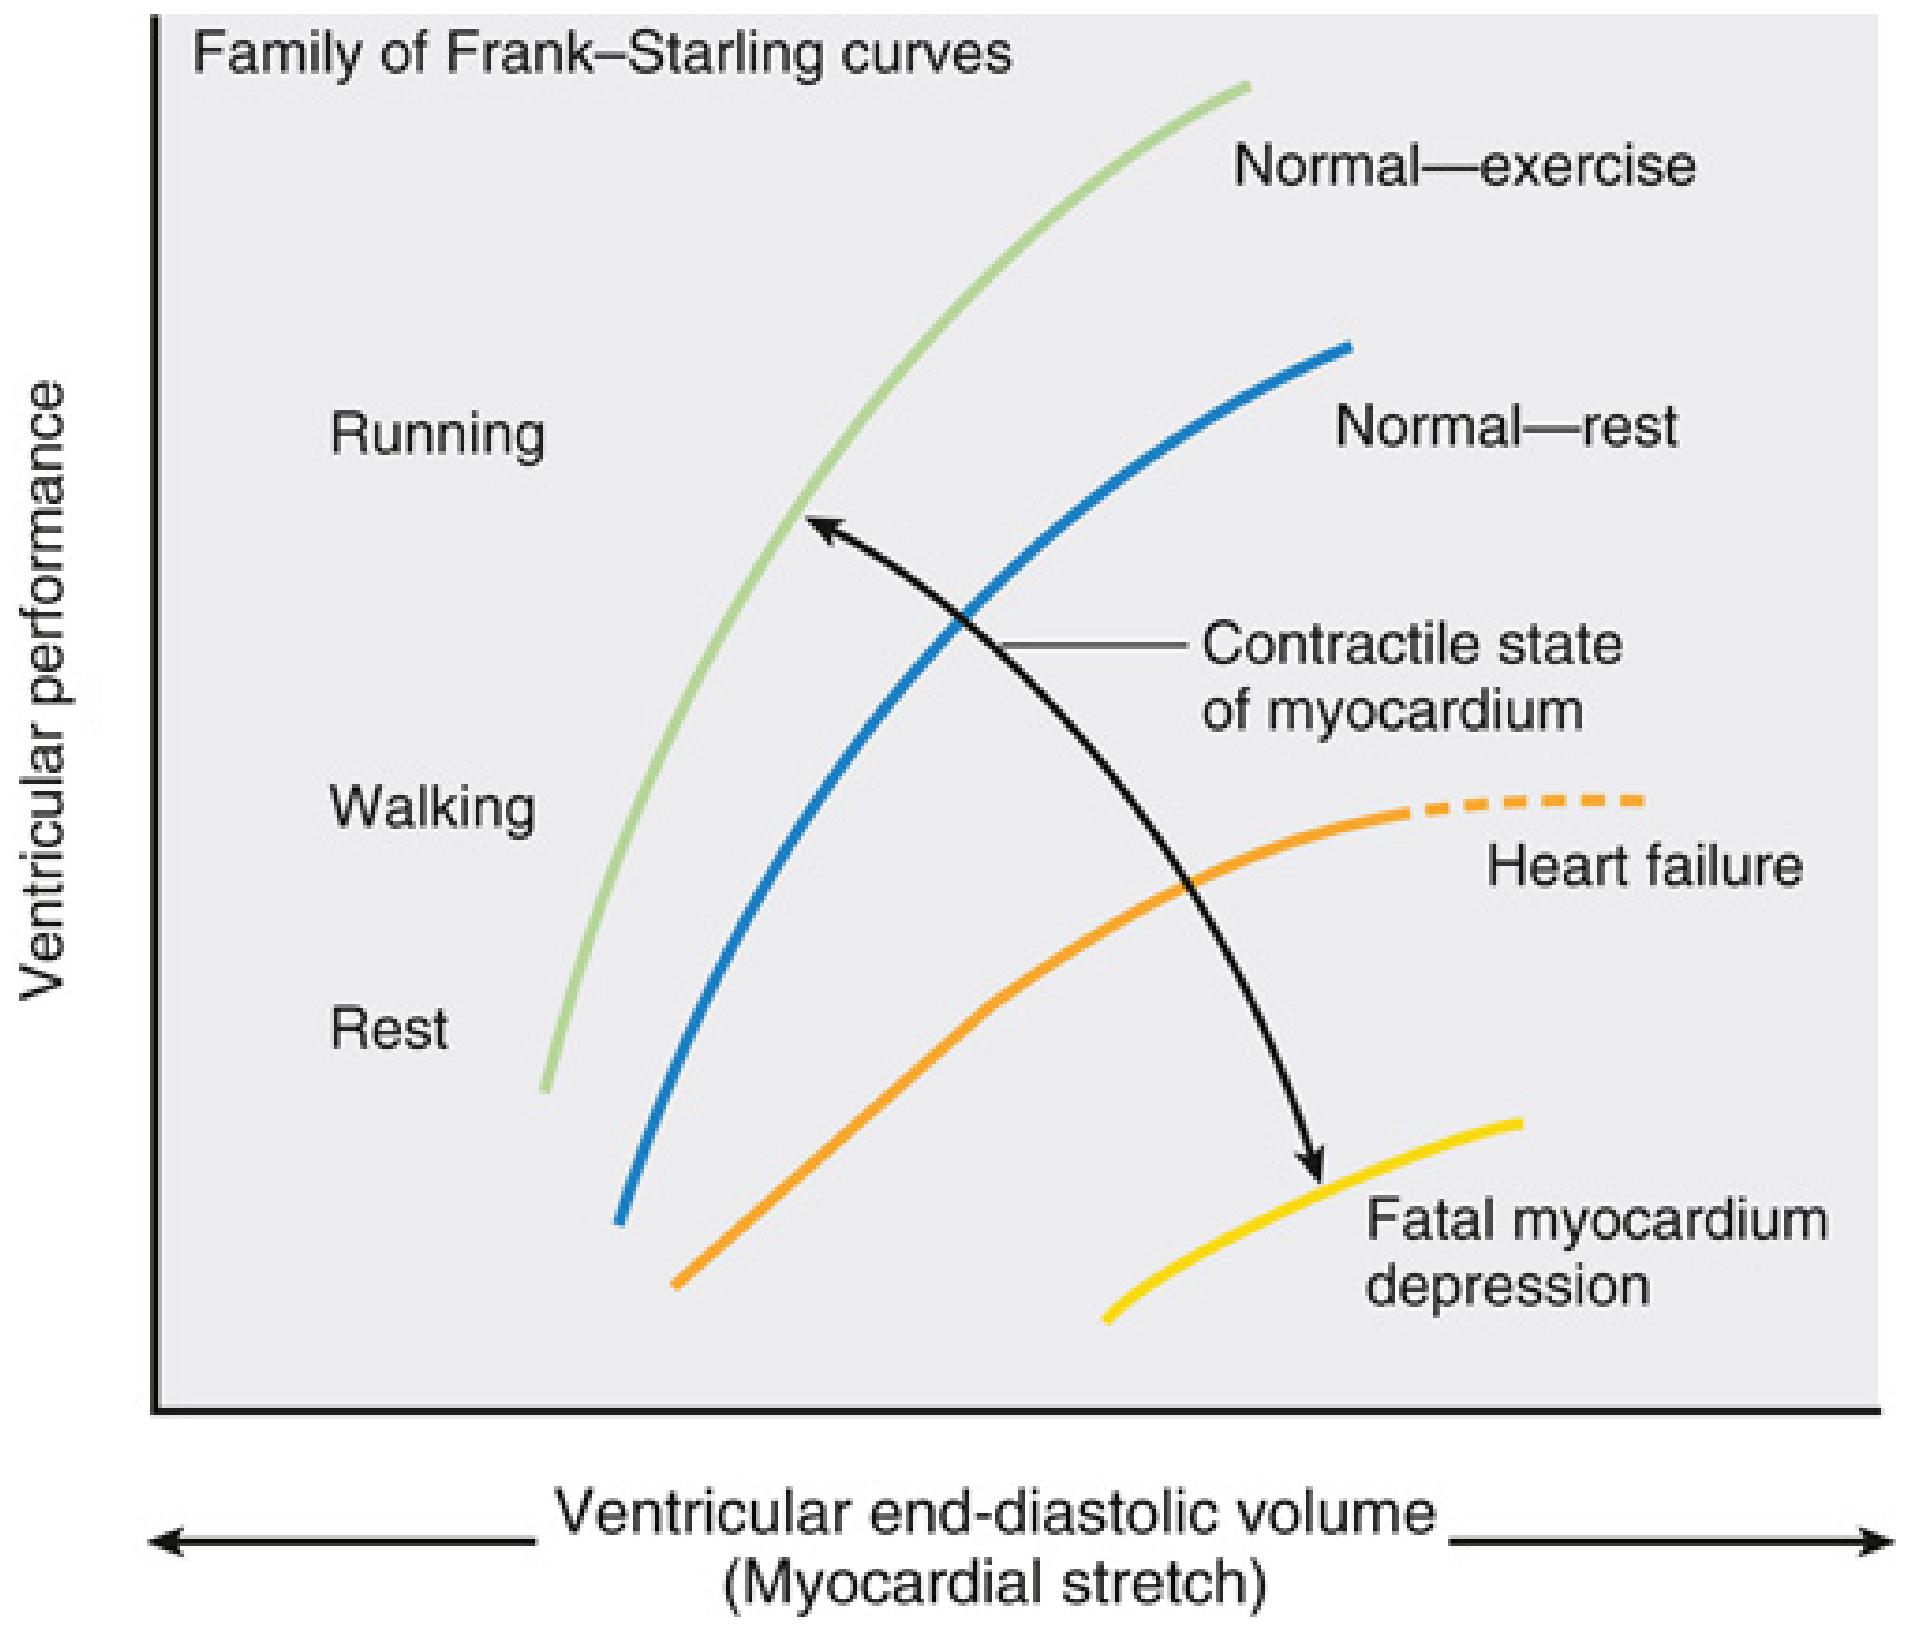
Fig. 13.5 - Miller's Anesthesia: A family of Frank-Starling curves. Leftward/upward shift = enhanced inotropy (exercise, catecholamines). Rightward/downward shift = impaired inotropy (heart failure, myocardial depression).
6. Ventricular Function Curves (Starling Curves)
These show stroke work output or ventricular volume output vs. atrial filling pressure:
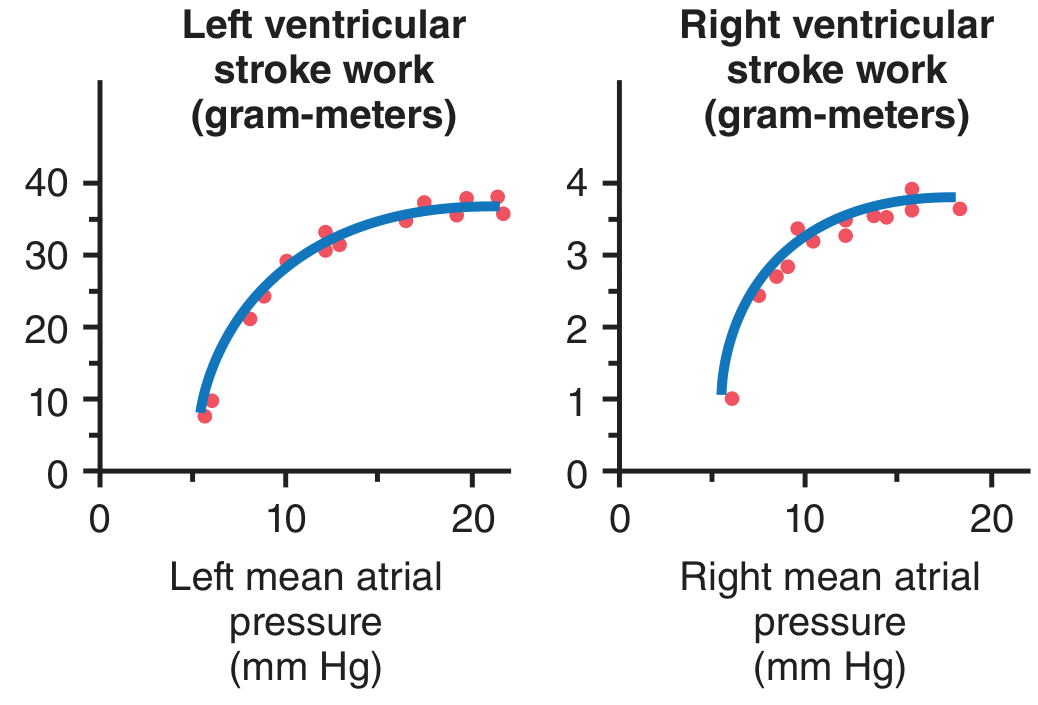
Fig. 9.12 - Guyton & Hall: Stroke work output curves for LV and RV. As atrial pressure rises, stroke work increases until the ventricle's limit.
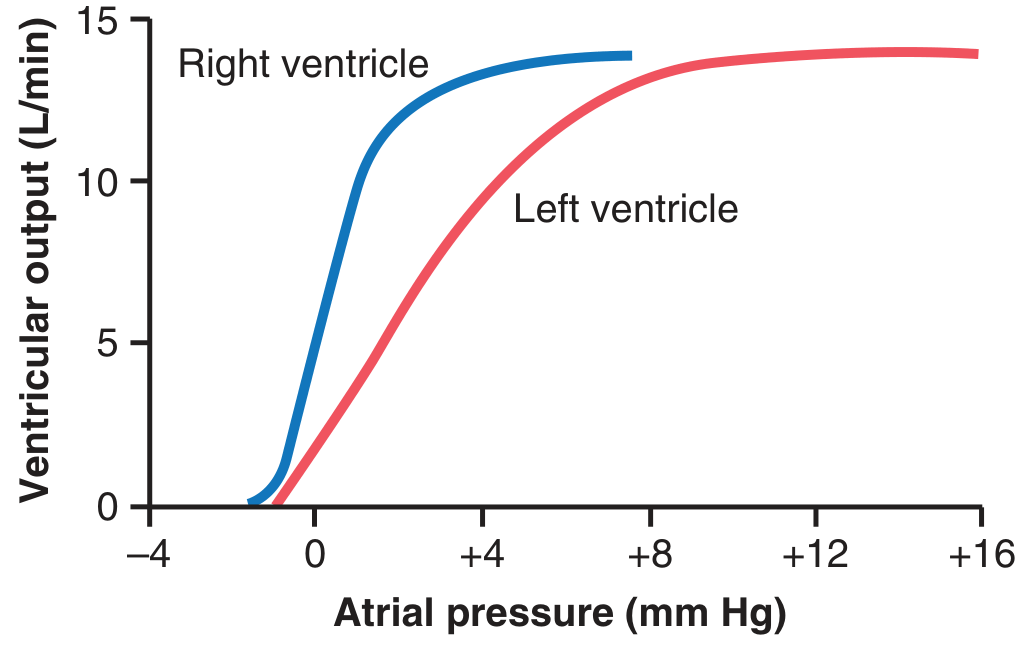
Fig. 9.13 - Guyton & Hall: Volume output curves. The RV (blue) reaches max output at much lower atrial pressures than the LV (red), reflecting the low-pressure pulmonary circuit.
7. Pressure-Volume Loop
The PV loop is the gold-standard tool to assess ventricular contractility:
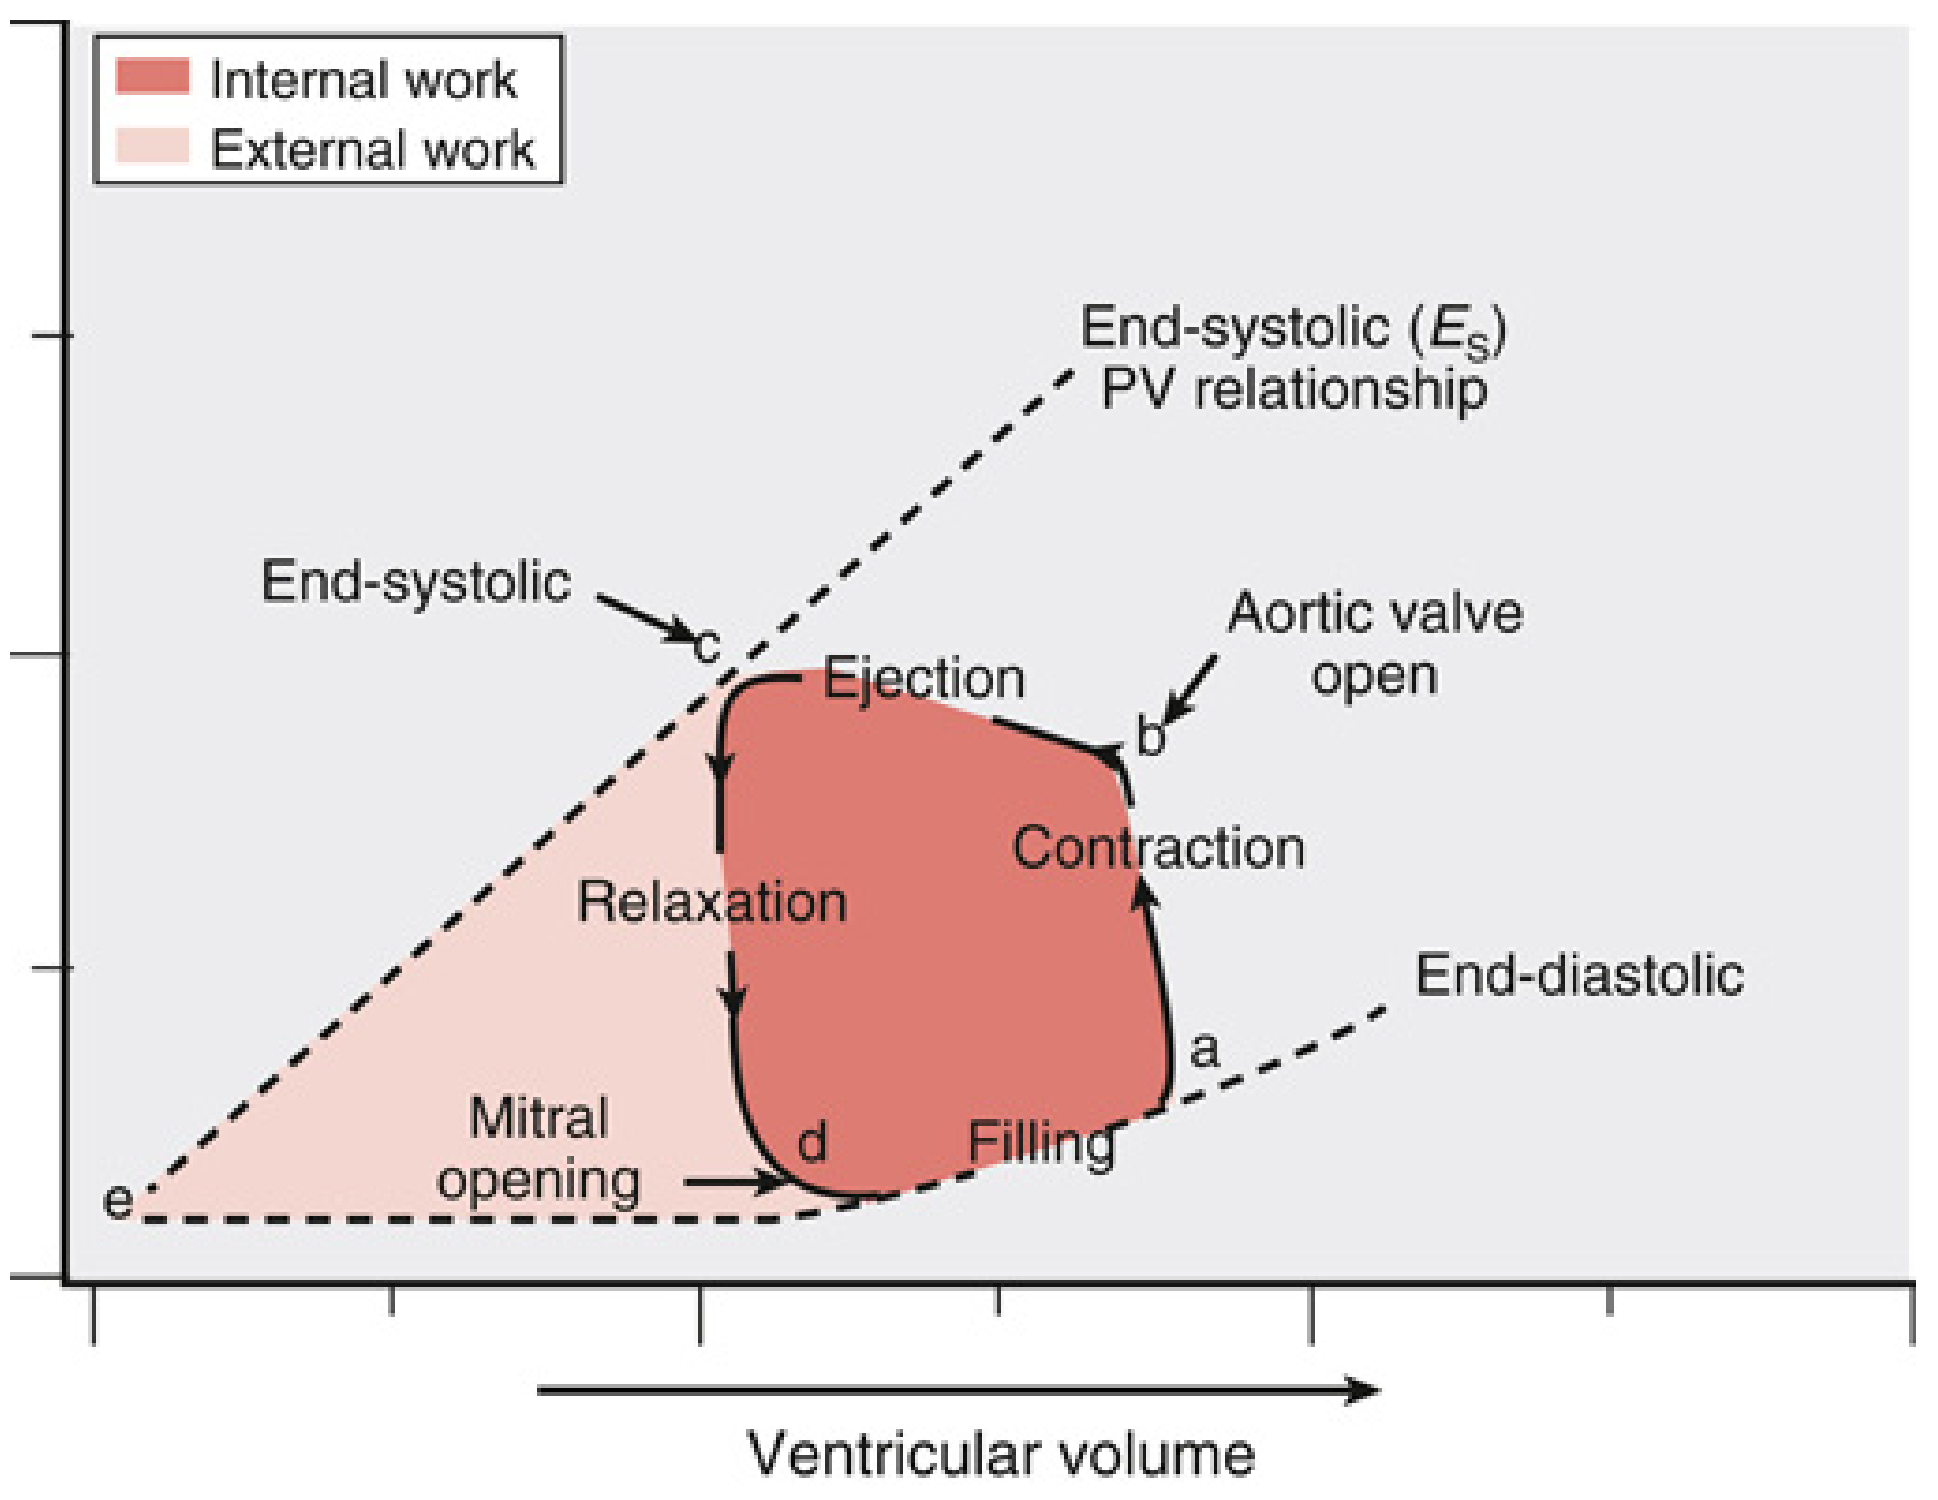
Fig. 13.6 - Miller's Anesthesia: Pressure-Volume loop. Point a = start of isovolumetric contraction; b = aortic valve opens (ejection); c = end-systole; d = mitral valve opens (filling). The width of the loop = stroke volume. The slope of the end-systolic PV relationship (Es) = contractility index.
Reading the loop:
- Wider loop (more horizontal) = greater SV = higher CO
- Steeper Es slope = better contractility
- In heart failure: narrower loop, shifted right, flatter Es
8. Autonomic Control of CO
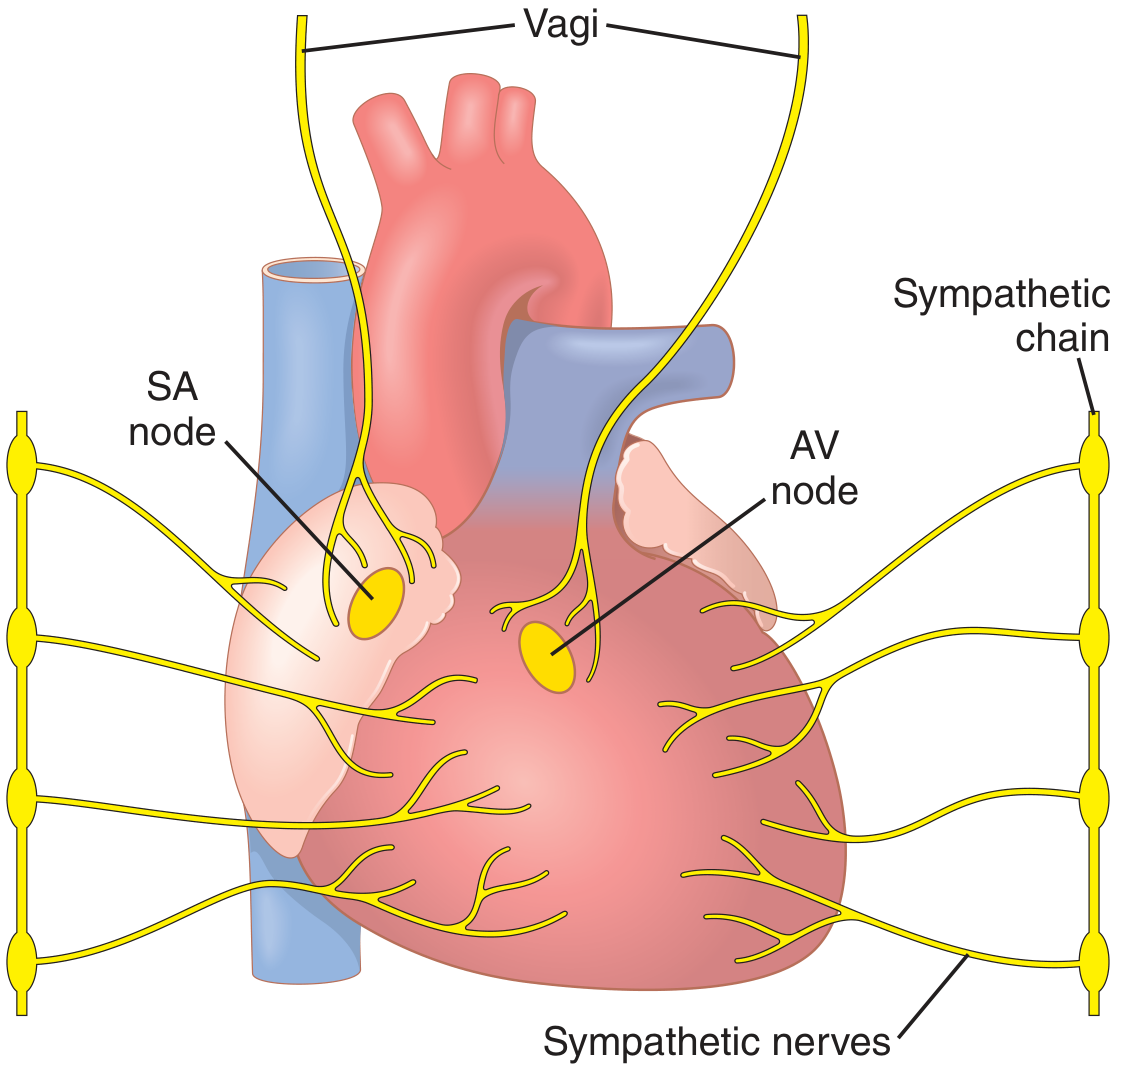
Fig. 9.14 - Guyton & Hall: Cardiac autonomic innervation. Sympathetic nerves (yellow) supply SA node, AV node, and myocardium bilaterally. Vagus carries parasympathetic fibers.
| Stimulus | HR Effect | Contractility Effect | Net CO Change |
|---|---|---|---|
| Sympathetic activation | ↑ (chronotropy) | ↑ (inotropy) | ↑↑ (up to 3x) |
| Parasympathetic (vagal) | ↓↓ (can arrest heart) | ↓ (mild) | ↓ |
| Normal resting tone | Sympathetic maintains CO ~30% above zero |
Strong sympathetic stimulation can raise HR from 70 to 180-250 bpm and can double contractility, increasing max CO 2- to 3-fold beyond Frank-Starling alone.
9. Measuring Cardiac Output - The Fick Principle
The Fick principle states that O₂ consumption by the body = O₂ leaving lungs - O₂ returning to lungs:
         O₂ Consumption (mL/min)
CO = ─────────────────────────────────────────────────
     [O₂]pulmonary vein - [O₂]pulmonary artery
Sample (Costanzo Physiology):
- O₂ consumption = 250 mL/min
- Arterial O₂ content = 0.20 mL O₂/mL blood
- Pulmonary arterial O₂ content = 0.15 mL O₂/mL blood
CO = 250 / (0.20 - 0.15) = 250 / 0.05 = 5,000 mL/min
Key assumption: In steady state, right heart CO = left heart CO.
Other CO measurement methods: thermodilution (Swan-Ganz catheter), echocardiography (outflow tract VTI), dye dilution.
10. Summary: Factors That Change Cardiac Output
| Factor | Change | Effect on CO |
|---|---|---|
| Venous return (preload) | ↑ | ↑ CO (Frank-Starling) |
| Heart rate | ↑ (moderate) | ↑ CO |
| Heart rate | ↑↑ (extreme, >180) | ↓ CO (↓ diastolic filling) |
| Contractility | ↑ | ↑ CO (curve shifts up) |
| Afterload (SVR/BP) | ↑↑ | ↓ SV, ↓ CO |
| Sympathetic activation | ↑ | ↑ CO |
| Parasympathetic/vagal | ↑ | ↓ CO |
| Heart failure | - | ↓ CO, curve shifts down |
| Exercise | - | ↑ CO (up to 5x in athletes) |
| Aortic stenosis | - | ↑ afterload, ↓ CO |
Sources: Guyton and Hall Textbook of Medical Physiology, Costanzo Physiology 7th Edition, Miller's Anesthesia 10th Edition
This is a shared conversation. Sign in to Orris to start your own chat.