Explain myocardial infarction
Reading File
Finding Sources
Searching PubMed
"myocardial infarction"[MeSH Terms] AND "management"[MeSH Terms]
Reading File
Reading File
Reading File
Searching Images
myocardial infarction pathology coronary artery atherosclerosis
Reading File
Reading File
Searching Images
myocardial infarction ECG ST elevation STEMI
Reading File
Reading File
I now have comprehensive information from multiple authoritative sources. Let me compile a thorough, well-organized response.
Myocardial Infarction
Myocardial infarction (MI), commonly called a "heart attack," is the death (necrosis) of cardiac muscle resulting from prolonged ischemia. The 2018 joint U.S./European Cardiology task force defines it as "acute myocardial injury detected by abnormal cardiac biomarkers in the setting of evidence of acute myocardial ischemia." — Robbins, Basic Pathology, p. 465
Epidemiology
- ~800,000 MIs occur in the United States each year (nearly one every 40 seconds), causing ~400,000 deaths annually
- 10% occur in people <40 years; 45% occur in people <65 years
- Males carry higher relative risk before menopause; after menopause, the gap narrows significantly — ischemic heart disease is the leading cause of death in older women
- Postmenopausal hormone replacement therapy has not been proven protective and may be pro-thrombotic in some cases
— Robbins & Kumar, Pathologic Basis of Disease
Pathogenesis
The Atherothrombotic Cascade
The overwhelming majority of MIs follow this sequence:
- Plaque disruption — An atheromatous plaque undergoes erosion or rupture due to endothelial injury, intraplaque hemorrhage, or mechanical stress, exposing subendothelial collagen and necrotic plaque contents to the bloodstream
- Platelet activation — Platelets adhere, aggregate, and release thromboxane A₂, ADP, and serotonin, driving further platelet aggregation and vasoconstriction
- Coagulation activation — Tissue factor exposure activates the coagulation cascade, expanding the thrombus
- Occlusion — Within minutes, the thrombus can completely occlude the coronary lumen
Angiography within 4 hours of MI onset demonstrates thrombotic occlusion in ~90% of cases. By 12–24 hours, this falls to 60% (due to spontaneous thrombolysis), which has clear therapeutic implications for early intervention. — Robbins, Pathologic Basis of Disease, p. 511
Non-atherosclerotic Causes (~10% of MIs)
- Coronary artery vasospasm (with or without atherosclerosis)
- Embolism from mural thrombi (e.g., in atrial fibrillation) or valve vegetations
- Small vessel disease: vasculitis, amyloid deposition, sickle cell disease
- Subendocardial infarcts from prolonged demand (tachycardia, hypertension) on a marginally perfused heart
Coronary Anatomy & Infarct Territory
| Occluded Vessel | Area Infarcted |
|---|---|
| Left anterior descending (LAD) | Anterior LV, anterior septum, apex (most common) |
| Right coronary artery (RCA) | Posterior LV, posterior septum, RV; often AV node |
| Left circumflex (LCx) | Lateral LV wall |
The subendocardium is most vulnerable because it has higher oxygen consumption and its vessels are compressed during systolic contraction. — Guyton & Hall Textbook of Medical Physiology
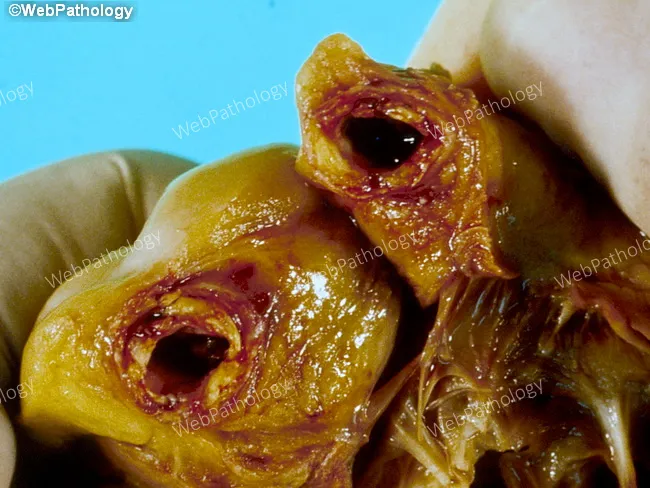
Gross Pathology: Gross image of coronary thrombosis
Morphological Evolution Over Time
| Time | Gross Features | Light Microscopy | Electron Microscopy |
|---|---|---|---|
| 0–0.5 hr | None | None | Myofibril relaxation, glycogen loss, mitochondrial swelling |
| 0.5–4 hr | None | Variable wavy fibers at border | Sarcolemmal disruption, amorphous mitochondrial densities |
| 4–12 hr | Dark mottling (occasional) | Early coagulative necrosis, edema, hemorrhage | — |
| 12–24 hr | Dark mottling | Coagulative necrosis; pyknosis; myocyte hypereosinophilia; early neutrophils | — |
| 1–3 days | Yellow-tan center | Coagulative necrosis with brisk neutrophilic infiltrate | — |
| 3–7 days | Hyperemic border; soft center | Neutrophil death; early macrophage phagocytosis; granulation tissue at border | — |
| 7–10 days | Maximally soft, yellow-tan | Well-developed phagocytosis; granulation tissue at margins | — |
| 10–14 days | Red-gray depressed borders | Granulation tissue with new vessels and collagen | — |
| 2–8 weeks | Gray-white scar | Increasing collagen, decreasing cellularity | — |
| >2 months | Dense white scar | Dense fibrous scar | — |
Triphenyl tetrazolium chloride (TTC) stain: Normal myocardium stains brick-red (intact lactate dehydrogenase); infarcted tissue appears as an unstained pale zone due to enzyme leakage from damaged membranes. Useful for infarcts >2–3 hours old. — Robbins, Pathologic Basis of Disease
ECG Changes
Three electrical abnormalities underlie the ECG findings in acute MI:
| Defect in Infarcted Cells | Current Flow | ECG Change (leads over infarct) |
|---|---|---|
| Rapid repolarization (K⁺ channel opening) | Out of infarct | ST elevation |
| Decreased resting membrane potential | Into infarct | TQ depression (recorded as ST elevation) |
| Delayed depolarization | Out of infarct | ST elevation |
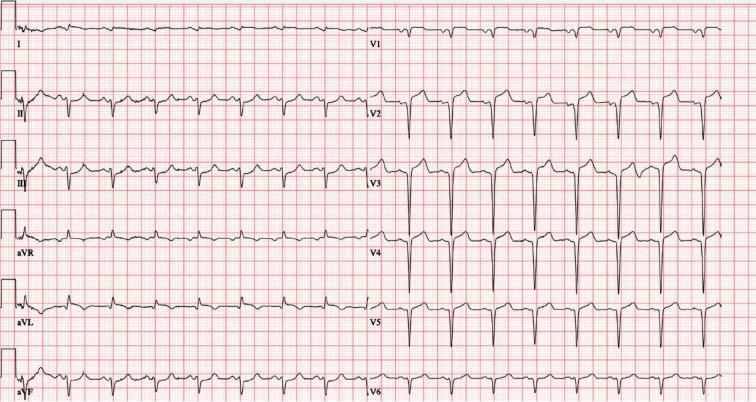
The hallmark of acute MI is ST-segment elevation in leads overlying the infarcted area, with reciprocal ST depression in opposing leads. After days–weeks, dead muscle becomes electrically silent → pathological Q waves develop. "Non-Q-wave" infarcts (NSTEMIs) tend to be less severe but carry high risk of reinfarction. — Ganong's Review of Medical Physiology, p. 534
STEMI ECG Example
Clinical Classification
| Type | Definition |
|---|---|
| STEMI | ST-elevation MI — full-thickness (transmural) occlusion; requires emergent reperfusion |
| NSTEMI | Non-ST-elevation MI — partial occlusion or subendocardial; biomarker-positive without persistent ST elevation |
| Unstable angina | Ischemia without biomarker elevation; precursor to MI |
Cardiac Biomarkers
- Troponin I and T — Most sensitive and specific; begin rising 3–6 hours after onset, peak at 24–48 hours, remain elevated for up to 14 days
- CK-MB — Rises within 3–4 hours; returns to normal within 48–72 hours (useful for detecting reinfarction)
- Myoglobin — Rises earliest (1–3 hours) but is non-specific
Complications
Immediate / Early
- Arrhythmias — ~90% of MI patients develop some rhythm disturbance; highest risk in the first hour. Includes ventricular fibrillation (most lethal), heart block, ventricular tachycardia, bradycardia
- Cardiogenic shock — Reduced cardiac output from loss of contractile mass; worsened by "systolic stretch" (infarcted zone bulges outward during systole, stealing energy from healthy myocardium)
- Pulmonary edema — From LV failure and back-pressure into pulmonary circulation
Days to Weeks
- Myocardial rupture (1–3% of MIs, often fatal): Occurs 3–7 days post-MI (peak of neutrophilic lysis):
- Free wall rupture → hemopericardium, cardiac tamponade
- Ventricular septal rupture → VSD with left-to-right shunt
- Papillary muscle rupture → acute mitral regurgitation
- Risk factors: age >60, anterior/lateral infarcts, female sex, first MI, no LVH
- Pericarditis — Fibrinohemorrhagic; appears 2–3 days post-MI with chest pain and friction rub; rare late form = Dressler syndrome (autoimmune, weeks later)
- Mural thrombus — From stasis + endocardial damage → risk of systemic embolism
Late
- Ventricular aneurysm — Thinned scar wall, commonly from large anteroseptal infarcts → arrhythmias, mural thrombus, heart failure (rarely ruptures)
- Progressive heart failure — Most common cause of delayed death after MI
— Robbins, Pathologic Basis of Disease, pp. 518–520
Causes of Death Summary
| Cause | Mechanism |
|---|---|
| Decreased cardiac output | Infarcted zone cannot contract; systolic stretch worsens pump failure |
| Pulmonary edema | LV failure → pulmonary venous hypertension |
| Ventricular fibrillation | Electrical instability in ischemic zone |
| Cardiac rupture | Softening of necrotic wall 3–7 days post-MI |
— Guyton & Hall Textbook of Medical Physiology
Management Principles
Time is muscle. The goal is rapid reperfusion:
- STEMI: Primary percutaneous coronary intervention (PCI) is preferred (ideally within 90 min of first medical contact); thrombolysis if PCI unavailable within 120 min
- NSTEMI/UA: Risk-stratified approach — anticoagulation, antiplatelet therapy, early invasive strategy for high-risk patients
- Adjunct therapies: Aspirin + P2Y12 inhibitor (dual antiplatelet), heparin/LMWH, beta-blockers, ACE inhibitors/ARBs, high-intensity statins
- Secondary prevention: Lifelong antiplatelet therapy, statins, BP and glycemic control, cardiac rehabilitation
Key Points Summary
| Feature | Detail |
|---|---|
| Core mechanism | Atherosclerotic plaque rupture → coronary thrombosis → ischemic necrosis |
| Most vulnerable region | Subendocardium (highest O₂ demand, lowest perfusion) |
| Earliest reversible change | Mitochondrial swelling (0–30 min) |
| Irreversibility threshold | ~20–40 min of complete ischemia |
| Earliest gross change | TTC pale zone (>2–3 hr), dark mottling by 12–24 hr |
| Peak rupture risk | 3–7 days (maximal neutrophilic lysis) |
| Scar complete | >2 months |
| Most common cause of immediate death | Ventricular fibrillation |
| Most common late complication | Heart failure |
This is a shared conversation. Sign in to Orris to start your own chat.